
 ?Mathematical formulae have been encoded as MathML and are displayed in this HTML version using MathJax in order to improve their display. Uncheck the box to turn MathJax off. This feature requires Javascript. Click on a formula to zoom.
Abstract
Land suitability analysis is one of the most beneficial applications in planning and managing land recourses. The main objective of this study was to assess suitable areas for sorghum (Sorghum bicolor L. Moench) cultivation in Agamsa sub watershed, Northeastern Ethiopia by integrating an Analytical Hierarchy Process (AHP) methods with Geographic Information System (GIS). Soil, climate and topographic characteristics were considered for suitability assessments in the study. The potential land suitability results showed that 116.65 ha (28.58%) and 291.47 ha (71.42%), of the area is highly suitable and moderately suitable for sorghum crop production respectively. The study has shown that the area is the potential for producing sorghum crops. However, it should be noted that the combined use of organic and inorganic fertilizers, appropriate tillage management coupled with soil and water conservation measures should be taken into consideration to enhance the current land suitability of the study area and improve the yield of the selected crop. The soil map for land suitability designed in this study could be helpful in management decisions. However, the criteria considered for land suitability evaluation were mainly biophysical and, hence, further studies can be made by incorporating socio-economic variables to improve the suitability results of the study area.
Keywords:
PUBLIC INTEREST STATEMENT
In Ethiopia, Agriculture is the main source of the national economy. However, many agricultural lands in the country are facing various problems like soil erosion, land degradation, waterlogging, groundwater depletion, and annual and seasonal rainfall variability and these results in low yield of cereal crops. Hence, to get the optimum benefit out of the land, land suitability evaluation which is a process of predicting land performance based on its attributes can help establish strategies to increase agricultural productivity. This study, therefore, highlights the integrated role of GIS and the AHP method to identify areas that are highly suitable, moderately suitable and not suitable for sorghum crops in the study area. The weighted overlay result showed that only a small part of the watershed was highly suitable and most of the area was moderately suitable for sorghum cultivation.
Competing Interests
The authors declares no competing interests.
1. Introduction
In Ethiopia, the agricultural sector provides an employment opportunity for about 85 percent of the labor force and is a backbone of the national economies. It accounts for approximately 42 percent of the GDP and more than 90 percent of the total export earnings of the country (CSA, Citation2018). Therefore, the sustainability of agricultural systems is an important issue for the survival and well-being of Ethiopian communities (Gelaw et al., Citation2015). However, many agricultural lands in the country are facing various problems like soil erosion, land degradation, waterlogging, groundwater depletion, heavy run-off and productivity losses (Bhagat, Citation2014) which are threatening the quality and availability of food, water, and energy. Inappropriate use of natural resources (Negusse et al., Citation2013), annual and seasonal rainfall variability (Mekuriaw, Citation2017; Motuma et al., Citation2016) coupled with lack of appropriate soil management practices (Worqlul et al., Citation2017) are also posing crop production in Ethiopia. To meet the ever-increasing demands for food to support the exponentially growing human population, agricultural production has to grow either by bringing more land under cultivation or by increasing productivity per unit area of land (Motuma et al., Citation2016). Therefore, to get the optimum benefit out of the land, land suitability evaluation which is a process of predicting land performance based on its attributes can help establish strategies to increase agricultural productivity (Sonneveld et al., Citation2010). This process includes identification, selection, and description of land-use types relevant to the area under consideration; mapping and description of the different types of land that occur in the area and the assessment of the suitability of the different types of land for the selected land-use types (Rossiter, Citation1990). At the same time, it provides information on the constraints and opportunities for the use of the land and enables decision-makers to develop a crop management system for increasing land productivity (Abdelrahman et al., Citation2016).
The increasing demand for existing intensive cultivation and opening up new areas of land can be satisfied if the land is classified according to its suitability for different kinds of use. It is known that Geographic Information Systems (GIS) can offer various opportunities for improving the convenience and accuracy of spatial data, more productive analysis and improved data access (El Baroudy, Citation2016). It has been designed to efficiently capture, store, update, manipulate, analyze and display all forms of geographically referenced information required to define the suitability of land (Hamzeh et al., Citation2014) and was also adopted for the present study. However, GIS does not take into account criteria linkages as all criteria are not equally important (Kazemi et al., Citation2016). It cannot deal with the issue of inconsistency when judging and assigning relative importance of criteria required for land suitability evaluation (Rad & Haghyghy, Citation2014). Hence, land managers and land-use planners are encouraged to use multiple-criteria decision-making tools in combination with GIS for integrating and managing numerous and heterogeneous factors (Torrieri & Batà, Citation2017). Those techniques provide well-structured and spatially explicit evaluation frameworks for sustainable land-use management practices (Musakwa, Citation2018). The analytical hierarchy process (AHP) method is, therefore, one of the most commonly used multiple-criteria decision-making techniques in GIS-based suitability assessment due to its relevance for making decisions on the basis of multiple factors ranked according to expert’s judgment (Qureshi et al., Citation2018). It enables the evaluation of group decisions with a specific systematic and logical approach, is used to choose the best alternative among the determined alternatives for a specific purpose considering various criteria (Saaty & Vargas, Citation2012).
Sorghum is among the major cereal crops grown in Ethiopia and accounted for the staple food of local people (Motuma et al., Citation2016). It grows in a wide range of agro-ecologies most importantly in the moisture stressed parts worldwide (Abdelrahman et al., Citation2016) where other crops can least survive and food insecurity is extensive (Adugna, Citation2007). Sorghum requires at least 0.50 m soil depth (Verdoodt & Van Ranst, Citation2003), 450–650 mm rain, higher CEC, nutrient, and moisture contained clayey soils (Naidu, Citation2006) to allow optimal growth. The main objective of this research is to assess suitable areas for sorghum cultivation using a combined application of the GIS and Analytical Hierarchy Process (AHP) method in Agamsa Watershed, Northeastern Ethiopia. The final output of this study could be helpful in management decisions. It will assist land managers and land-use planners to identify areas with physical constraints and the management requirements that will ensure the sustainable productions of sorghum without causing significant degradation to land quality in the study area. The study also provides information about the suitability of sorghum in the study area and hence offers farmers alternative land uses to lessen the risk of crop failure. However, the criteria considered for land suitability evaluation in this study were mainly biophysical and, hence, further studies can be made by incorporating socio-economic variables to improve the suitability results of sorghum cultivation in the study area. Similarly, the present study focus only on the suitability of sorghum cultivation but, further research can be conducted for determining the optimum locations for different types of crops to enhance the sustainable crop production in the study area.
2. Materials and methods
2.1. Description of the study area
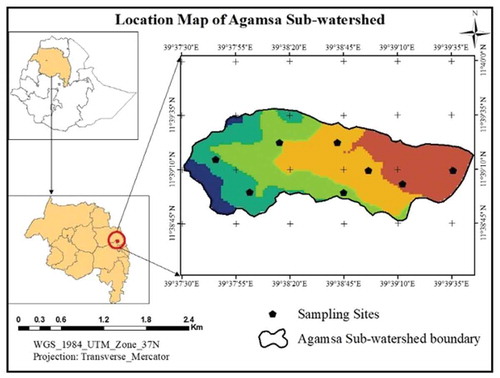
The study was conducted at Agamsa sub-watershed, which is located in Habru District of Northeastern, Ethiopia (Figure ). Geographically, the study area lies between 11°38ʹ46”N and 11°39ʹ38”N latitude; and 39°37ʹ30”E and 39°39ʹ43”E longitude, and at an altitude ranging from 1,575 to 1,870 meters above sea level. The total area of the watershed is about 408.12 ha and is characterized by flat and hilly topography. The study area is characterized by a bimodal rainfall pattern. The short (Belg) rain starts in February and ends in April while the main rainy (kiremt) season starts in June and ends in September with the erratic distribution. Its land use is mainly subsistence rain-fed agriculture and has a mean annual rainfall of 500–950 mm and a mean annual temperature of 14 − 31°C. According to the Ethiopian Mapping Agency, the study sub-watershed is covered by Pellic Vertisols, Eutric Cambisols, Regosols, and Eutric Lithosols. Pellic Vertisols is among the dominant soil type which covers about 68.4 % of the study area.
Figure 1. Location map of the study area
2.2. Soil sample collection and analysis
Field data collection and soil sampling were carried out by considering the slope variation and fertility gradients of the study area. The soil samples were collected from each sampling site, and soil profiles were opened to measure soil depth conditions. Besides, representative soil samples from a depth of 0 to 30 cm were collected to examine the soil’s physical and chemical properties. At each sampling site, a GPS (Global Position Systems, Garmin 76x model) reading was used in taking the coordinates. For each sampling site, a minimum of 10 to 15 subsamples was collected and composited within 50 m distance between two sampling points using a random sampling technique. As a result, a total of eight composite soil samples were collected, by using Edelman auger at the surface layer (0–30 cm), for sorghum suitability evaluation purposes. Then the collected soil samples were air-dried, gently crushed with mortar and pestle, mixed well and passed through a 2-mm sieve. For the determination of total nitrogen (N) and organic carbon (OC), a 0.5-mm sieve was used. Then, approximately one kg of the composited fine soil sample was transported for analysis at Water Works Design and Supervision Enterprise, Addis Ababa, following the standard procedures (Table ).
Table 1. Standard laboratory methods for soil sample analysis
The overall suitability criteria for rain-fed sorghum production were identified (Table ) based on different works of literature (Ahmed & Jeb, Citation2014; Bingham, Citation1962; Elaalem, Citation2012; Kaaya et al., Citation1994; Metson, Citation1961) and available data. Accordingly, the physico-chemical soil data were collected from laboratory analysis results (Table ) while rainfall and temperature data were obtained from Sirinka Agricultural Research Center. Similarly, the 30 m spatial resolution digital elevation model was used to generate the slope map from ASTER GDEM, obtained from Aster Global Digital Elevation Map (http://gdex.cr.usgs.gov/gdex/) by using Spatial Analyst Tool in Arc GIS environment for suitability map preparation.
Table 2. Rating of land use requirements for rainfed sorghum production
Table 3. Random consistency index (RI) for fourteen criteria
Table 4. The pair-wise comparison matrix of the main criteria
Table 5. Normalized pair-wise comparison matrix and criteria weights
Table 6. Calculating consistency
Table 7. Criteria weight
2.3. Criteria weight estimation
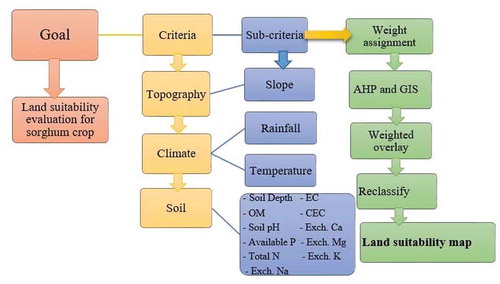
The weighted factor was estimated by the pairwise comparison matrix (Ahmed & Jeb, Citation2014) based on expert opinion and by designing the Analytic Hierarchy Process (AHP) method (Saaty, Citation1980). AHP method enables evaluation of group decisions with a specific systematic and logical approach, is used to choose the best alternative among the determined alternatives for a specific purpose considering various criteria (Saaty & Vargas, Citation2012). The first and foremost step in AHP is creating the Hierarchical structure (Figure ) in which the goal is kept at the first level and other sub-criteria were placed at the remaining level (Patil et al., Citation2012). The second step is to create a pair-wise comparison matrix that gives the relative importance of various attributes/criteria with respect to the goal (Table ). The first stage in the pair-wise comparison matrix is creating a scale of relative importance ranges from 1 to 9 (1 = equal importance, 3 = moderate importance, 5 = strong importance, 7 = very strong importance, and 2, 4, and 6 = intermediate values) to express individual judgments (Saaty, Citation1980).
The criteria weight (Tables and ) was calculated from the pairwise comparison matrix undertaken and Eigen-vector values based on the formula below.
Where, w1 is the sum of a row for pairwise comparison and n is the size of the matrix.
Figure 2. Hierarchical organizations of the land characteristics for sorghum production
The Consistency Ratio (CR) in the comparison matrix can be calculated (Table ) to check whether the calculated value is correct or not and it ranges from 0 to 1. A CR of 0.1 or less is a reasonable level of consistency (Saaty, Citation1980). In this case, the CR of the matrix of paired comparisons between 14 factors for land suitability was 0.063, which indicates logical judgment. Consistency index (CI) is computed from the formula:
Where, λmax is the Largest Eigenvalue of the pairwise comparison matrix and n is the number of criteria. Then, CR was computed by the formula (Saaty, Citation1980):
Where, CR is a consistency ratio, CI is a consistency index and RI is a random index of a randomly generated pair-wise comparison matrix, simply obtained from the table of Random Inconsistency Indices (Table ).
2.4. Method of analysis using GIS
After weighting each parameter using AHP, spatial interpolation (30 m pixel size) using ArcGIS 10.4 software was employed to drive raster layers for each criterion. Values in raster layers were reclassified to a common suitability class (S1 for highly suitable, S2 for moderately suitable, S3 for marginally suitable and N for not suitable) (Table ). Finally, the weighted overlay method was employed to generate the overall suitability raster layer. The reclassified raster layers were overlayed by multiplying each raster cell suitability value by its layer weight and totaling the values to drive the map of overall suitability (Figure and equation 4).
Where, S is the suitability, Wi is the weight of factor i, and Xi is the criterion score of factor i.
3. Results and discussion
3.1. Climatic suitability
The study area was characterized by a bimodal rainfall pattern. The short (Belg) rain starts in February and ends in April while the main rainy (kiremt) season starts in June and ends in September with a mean annual rainfall of 763 mm. The results indicated that the mean growing season rainfall is highly suitable (S1) while the mean growing season temperature is moderately suitable (S2) for the rain-fed sorghum cultivation in the study area (Table and Figure (a,b)).
Figure 3. (a) Temperature suitability class-map for sorghum. (b) Rainfall suitability class -map for sorghum
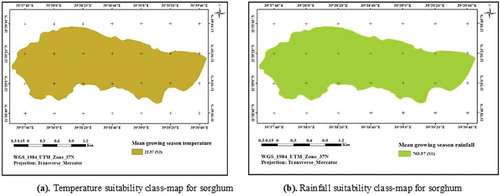
Figure 4. (a) Slope suitability class-map for sorghum. (b) Soil depth suitability class-map for sorghum
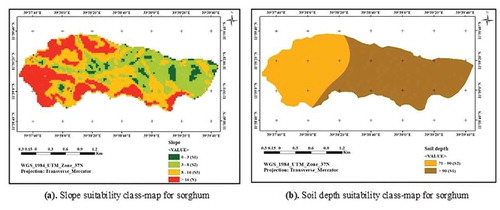
Figure 5. (a)pH suitability class-map for sorghum. (b) OM suitability class-map for sorghum. (c) TN suitability class-map for sorghum. (d) EC suitability class-map for sorghum
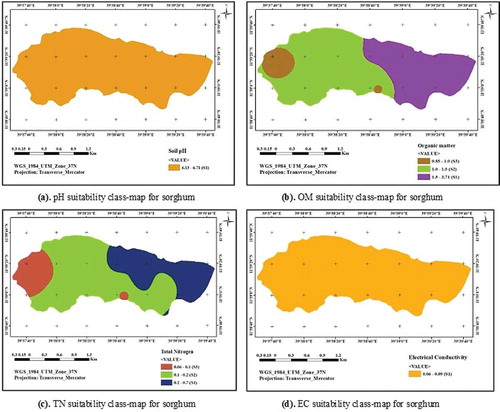
Figure 6. (a) Av. Psuitability class-map for sorghum. (b) CEC suitability class-map for sorghum
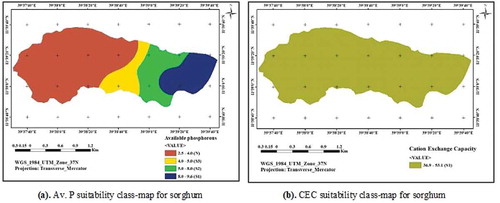
Figure 7. (a)Ca suitability class-map for sorghum. (b) K suitability class-map for sorghum. (c) Mg suitability class-map for sorghum. (d) Na suitability class-map for sorghum
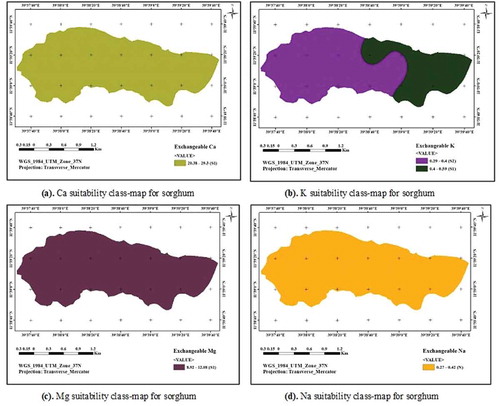
Figure 8. Overall suitability map for sorghum cultivation
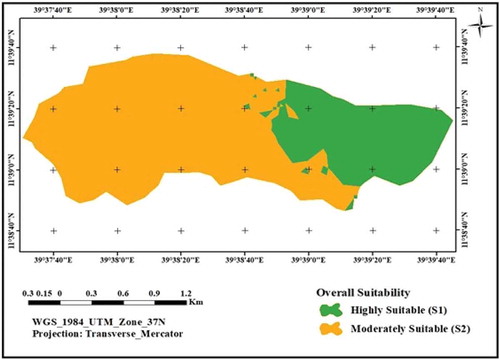
Table 8. Soil nutrient distribution in eight sampling points (SP) of the study sub-watershed
Table 9. Suitability classes for sorghum in the study area
3.2. Slope suitability
The slope of an area determines the rate of erosion (Atalay, Citation2006) and is one of the factors used in this study for the determination of suitable areas for sorghum. The classification of the slope was determined from the Digital Elevation Model (DEM) for the suitability classes in the study area. Hence, the slope of the study area has been classified into four categories ranging between 0-3%, 3-8%, 8-16% and greater than 16% (Figure (a)). The reclassified slope suitability result shows that suitable area (S1) with 22.88 ha (5.51%), while moderately suitable (S2) within 128.74 ha (31.53%), marginally suitable (S3) 144.56 ha (35.48%) and area that is not suitable (N) with 111.94 ha (27.48%). Thus, 62.96 % of the study area was marginally and not suitable for sorghum cultivation.
3.3. Soil suitability
Soil pH is the most important soil criterion in land suitability classification and it controls many chemical and physical soil characteristics. It provides information about the solubility and potential availability of elements for crops and subsequently specifies the soil suitability for a specific crop (Brady & Weil, Citation1999). The pH of the soil measured in water ranged from 6.13 to 6.71 (Table ), indicating that the soil of the study area is a moderate acid reaction. The analysis for pH showing in Figure (a) and Table that the area is highly suitable (S1) for sorghum cultivation. The electrical conductivity (EC) is an indicator for the determination of saline soils, and the analysis in Figure (d) and Table shows that the area is highly suitable (S1) for the cultivation of sorghum crop.
The analysis for OM in Figure (b) and Table shows that the highly suitable area for sorghum production (S1) is 39% (159.17 ha) while the moderately suitable (S2) and marginally suitable (S3) is 53.49% (218.31 ha) and 7.51% (30.64 ha), respectively. Soil OM is an important soil parameter and is considered the main reservoir for many elements in soil, and helps to maintain the aggregates of soils, improves soil water retention, and increases resistance to erosion (Mi et al., Citation2019). Nitrogen (N) is the most growth-limiting element for optimum sorghum production (Ahmed & Jeb, Citation2014). The analysis for total Nitrogen (TN) in Figure (c) and Table shows that the highly suitable area with (S1) 29.57% (120.75 ha), moderately suitable (S2) 57.43% (234.33 ha) and marginally suitable with a total area of 13% (53.04 ha). The low content of total N in the study area might have resulted from a low level of soil OM content, low application of N rich organic materials and mineralization of the existing soil OM following cultivation. Crop residues are collected for animal feed, fuel, and thatching in the study area. Similarly, animal dung and wastes are collected for fuel and temporary construction.
The cation exchange capacity (CEC) is used as one way of estimating soil fertility (Rossiter, Citation1990). A soil with a low CEC generally has a low organic matter content, low water-holding capacity, requires more fertilizer additions, and is subject to leaching and such soils will have lower yield potential than soils with higher CEC under the same level of management. The CEC values in the study area ranging from 36.9 to 53.1 (Table ) and this indicated that the area is highly suitable (S1) for sorghum cultivation (Figure (b) and Table ).
The analysis for exchangeable potassium (K) in Table and Figure (b) shows that the highly suitable (S1) and moderately suitable (S2) areas for sorghum cultivation are 136.7 ha (33.5%) and 271.42 ha (66.5%), respectively. Similarly, the analysis for both calcium (Ca) in Figure (a) and magnesium (Mg) in Figure (c) generally shows that the area is highly suitable (S1). However, the analysis of total sodium (Na) in Figure (d) shows the total area is not suitable (N) for sorghum crop.
Soil depth is another important factor used for suitability analysis for the cultivation of sorghum crops. In this study, the result in Figure (b) indicated that the suitable (S1) and moderately suitable (S2) area for sorghum is 239.69 ha (58.73%) and 168.43 ha (41.27%), respectively.
3.4. Overall suitability
The weighted overlay results in Table and Figure shows that 116.65 ha (28.58%) of the area is highly suitable (S1), which has all the quality that is required to cultivate sorghum. However, the remaining 291.47 ha (71.42%) of the watershed is moderately suitable (S2) for sorghum cultivation. This area has constraints that can be affected by low levels of available phosphorus (P), organic matter (OM), and slope. In agreement with this finding, different authors indicated that most cultivated soils of Ethiopia are poor in OM content (Haile et al., Citation2014) and insufficient total N and available P (Emiru & Gebrekidan, Citation2013) probable due to continuous uptake by crops, crop residue removal, intensive cultivation and low inherent content of these nutrients in the parent material from which the soil is developed. This situation has become worse as the current land management practice continues without any improvement. Therefore, increasing any economical agricultural production would require integrated efforts from land-use planners, agriculture extension workers, researchers, and rural communities. This can be enhanced by applying appropriate interventions such as soil and water conservation measures, integrated soil fertility management, moisture harvesting structures, and agronomic practices.
Table 10. Area and percentage distribution of suitability classes
4. Conclusion and recommendation
Soil, climate and topographic characteristics were the main criteria used to generate land suitability evaluation for sorghum crop in Agamsa sub-watershed of northeastern Ethiopia. GIS integrated with AHP analysis was found with great assistance in integrating soil, climate and topographic parameters for land suitability evaluation in the study. According to the land suitability map produced, highly suitable (S1) and moderately suitable (S2) lands cover 116.65 ha (28.58%) and 291.47 ha (71.42%), respectively. The study has shown that the area is the potential for producing sorghum crops. However, it should be noted that the combined use of organic and inorganic fertilizers, appropriate tillage management coupled with soil and water conservation measures should be taken into consideration to enhance the current land suitability of the study area and improve the yield of the selected crop. The final output of this study could be helpful in management decisions. It will assist land managers and land-use planners to identify areas with physical constraints and the management requirements that will ensure the sustainable productions of sorghum without causing significant degradation to land quality in the study area. However, the criteria considered for land suitability evaluation were mainly biophysical and, hence, further studies can be made by incorporating socio-economic variables to improve the suitability results of the study area.
Additional information
Funding
Notes on contributors
Moges Tadesse
Moges Tadesse is an MSc holder in Soil Science from Haramaya University. Currently, he is working as a lecturer and researcher in the Department of Soil and Water Resource Management at Woldia University, Ethiopia. He teaches Soil Chemistry, Soil Microbiology, Soil Genesis, Soil Fertility and Plant Nutrition and soil and water conservation courses for undergraduate students. He has an interest and actively engaged in problem-solving researches.
Ajanaw Negese
Ajanaw Negese is an MA holder in Land and Water Resource Management from Adama Science and Technology University, Ethiopia. He is currently working as a lecturer in the Department of Soil and Water Resource Management at Woldia University, Ethiopia. He teaches land evaluation and land use planning, GIS and remote sensing, watershed management, soil and water conservation, agro-climatology and environmental impact assessment courses for undergraduate students. He is also actively involved in various research and community services activities at the University.
References
- Abdelrahman, M. A., Natarajan, A., & Hegde, R. (2016). Assessment of land suitability and capability by integrating remote sensing and GIS for agriculture in Chamarajanagar district, Karnataka, India. The Egyptian Journal of Remote Sensing and Space Science, 19(1), 125–18. https://doi.org/10.1016/j.ejrs.2016.02.001
- Adugna, A. (2007). The role of introduced sorghum and millets in Ethiopian agriculture. Nazareth, Ethiopia: Melkassa Agricultural Research Center.
- Ahmed, M., & Jeb, D. (2014). Land suitability for sorghum using multicriteria evaluation (MCE) and analytical hierarchy process (AHP) in Bunkure Kano State, Nigeria. Journal of Agriculture and Veterinary Science (IOSRJAVS) e-, 7, 2319–2380. http://10.9790/2380-07942537
- Atalay, I. (2006). Toprak Olusumu, Sınıflandırılması ve Cografyası. Meta Basım Matbaacılık, Izmir (in Turkish). Çevre ve Orman Bakanlığı.
- Bhagat, V. (2014). Use of IRS P6 LISS-IV data for land suitability analysis for cashew plantation in a hilly zone. Asian Journal of Geoinformatics, 14.
- Bingham, F. T. (1962). Chemical soil tests for available phosphorus. Soil Science, 94(2), 87–95. https://doi.org/10.1097/00010694-196208000-00005
- Brady, N., & Weil, R. (1999). Micronutrient elements. In The nature and properties of soils (12th ed., pp. 585–611). Prentice-Hall.
- Bremner, J. M., & Mulvaney, C. (1982). Nitrogen-total 1. In Methods of soil analysis. Part 2. Chemical and microbiological properties (pp. 595–624). American Society of Agronomy, Soil Science Society of America.
- Central Statistical Agency (CSA). (2018). The key findings of the 2017/2018 agricultural sample surveysa. Ababa, Addis, Ethiopia: The Federal Democratic Republic of Ethiopia.
- Chapman, H. (1965). Cation-exchange capacity 1. In A. G. Norman (Ed.), Methods of soil analysis. Part 2. Chemical and microbiological properties (pp. 891–901). https://doi.org/10.2134/agronmonogr9.2.c6
- El Baroudy, A. (2016). Mapping and evaluating land suitability using a GIS-based model. Catena, 140, 96–104. https://doi.org/10.1016/j.catena.2015.12.010
- Elaalem, M. (2012). land suitability evaluation for sorghum based on boolean and fuzzy-multi-criteria decision analysismethods. International Journal of Environmental Science and Development, 3, 357. https://doi.org/10.7763/IJESD.2012.V3.247
- Emiru, N., & Gebrekidan, H. (2013). Effect of land-use changes and soil depth on soil organic matter, total nitrogen and available phosphorus contents of soils in Senbat Watershed, Western Ethiopia. ARPN Journal of Agricultural and Biological Science, 8, 206–2012.
- Gelaw, A., Singh, B., & Lal, R. (2015). Soil quality indices for evaluating smallholder agricultural land use in northern Ethiopia. Sustainability, 7(3), 2322–2337. https://doi.org/10.3390/su7032322
- Haile, G., Lemenhi, M., Itanna, F., & Senbeta, F. (2014). Impacts of land-use changes on soil fertility, carbon and nitrogen stock under smallholder farmers in central highlands of Ethiopia: Implication for sustainable agricultural landscape management around Butajira area. New York Science Journal, 7, 27–44.
- Hamzeh, S., Mokarram, M., & Alavipanah, S. K. (2014). Combination of Fuzzy and AHP methods to assess land suitability for barley: Case Study of semi-arid lands in the southwest of Iran. Desert, 19, 173–181. http://Doi.org/10.22059/JDESERT.2014.52346
- Kaaya, A. K., Msanya, B. M., & Mrema, J. P. (1994). Soils and land evaluation of part of the Sokoine University of agriculture farm (Tanzania) for some crops under rainfed conditions. Department of Soil Science, Sokoine University of Agriculture.
- Kazemi, H., Sadeghi, S., & Akinci, H. (2016). Developing a land evaluation model for faba bean cultivation using a geographic information system and multi-criteria analysis (A case study: Gonbad-Kavous region, Iran). Ecological Indicators, 63, 37–47. https://doi.org/10.1016/j.ecolind.2015.11.021
- Mekuriaw, A. (2017). Assessing the effectiveness of land resource management practices on erosion and vegetative cover using GIS and remote sensing techniques in Melaka watershed, Ethiopia. Environmental Systems Research, 6(1), 16. https://doi.org/10.1186/s40068-017-0093-6
- Metson, A. (1961). Methods of chemical analysis for soil survey samples, soil bureau bulletin 12. Department of Scientific and Industrial Research.
- Mi, W., Sun, Y., Zhao, C., & Wu, L. (2019). Soil organic carbon and its labile fractions in paddy soil as influenced by water regimes and straw management. Agricultural Water Management, 224, 105752. https://doi.org/10.1016/j.agwat.2019.105752
- Motuma, M., Suryabhagavan, K., & Balakrishnan, M. (2016). Land suitability analysis for wheat and sorghum crops in Wogdie District, South Wollo, Ethiopia, using geospatial tools. Applied Geomatics, 8(1), 57–66. https://doi.org/10.1007/s12518-016-0168-5
- Musakwa, W. (2018). Identifying land suitable for agricultural land reform using GIS-MCDA in South Africa. Environment, Development, and Sustainability, 20(5), 2281–2299. https://doi.org/10.1007/s10668-017-9989-6
- Naidu, L. (2006). Manual, soil-site suitability criteria for major crops. National Bureau of Soil Survey and Land Use Planning, ICAR.
- Negusse, T., Yazew, E., & Tadesse, N. (2013). Quantification of the impact of integrated soil and water conservation measures on groundwater availability in Mendae Catchment, Abraha We-Atsebaha, eastern Tigray, Ethiopia. Momona Ethiopian Journal of Science, 5(2), 117–136. https://doi.org/10.4314/mejs.v5i2.91495
- Olsen, S. R. (1954). Estimation of available phosphorus in soils by extraction with sodium bicarbonate. US Department of Agriculture.
- Patil, V., Sankhua, R., & Jain, R. (2012). Analytic hierarchy process for evaluation of environmental factors for residential land use suitability. International Journal of Computer Engineering Research, 2, 182–189.
- Qureshi, M. R. N., Singh, R. K., & Hasan, M. A. (2018). Decision support model to select crop patterns for sustainable agricultural practices using fuzzy MCDM. Environment, Development, and Sustainability, 20(2), 641–659. https://doi.org/10.1007/s10668-016-9903-7
- Rad, L. K., & Haghyghy, M. (2014). Integrated analytical hierarchy process (AHP) and GIS for land-use suitability analysis. World Applied Sciences Journal, 32, 587–594.
- Rossiter, D. G. (1990). ALES: A framework for land evaluation using a microcomputer. Soil Use and Management, 6(1), 7–20. https://doi.org/10.1111/sum.1990.6.issue-1
- Rowell, D. (1994). The meaning of pH and its measurement, the determination of organic nitrogen and the dichromate method for the determination of oxidizable carbon and soil organic matter. In Soil science, methods and applications (pp. 48–161). Addison Wesley Longman Limited.
- Saaty, T. (1980). The analytic hierarchy process. McGraw-Hill international.
- Saaty, T. L., & Vargas, L. G. (2012). Models, methods, concepts & applications of the analytic hierarchy process. Springer Science & Business Media.
- Sonneveld, M., Hack-Ten Broeke, M., Van Diepen, C., & Boogaard, H. (2010). Thirty years of systematic land evaluation in the Netherlands. Geoderma, 156(3–4), 84–92. https://doi.org/10.1016/j.geoderma.2010.02.023
- Torrieri, F., & Batà, A. (2017). Spatial multi-criteria decision support system and strategic environmental assessment: A case study. Buildings, 7(4), 96. https://doi.org/10.3390/buildings7040096
- Van Reeuwijk, L. P. (1986). Procedures for soil analysis. Wageningen, Netherlands: International Soil Reference and Information Centre.
- Verdoodt, A., & Van Ranst, E. (2003). Land evaluation for agricultural production in the tropics. A large-scale land suitability classification for Rwanda. Ghent University. Laboratory of Soil Science.
- Walkley, A., & Black, I. A. (1934). An examination of the Degtjareff method for determining soil organic matter, and a proposed modification of the chromic acid titration method. Soil Science, 37(1), 29–38. https://doi.org/10.1097/00010694-193401000-00003
- Worqlul, A. W., Jeong, J., Dile, Y. T., Osorio, J., Schmitter, P., Gerik, T., Srinivasan, R., & Clark, N. (2017). Assessing potential land suitable for surface irrigation using groundwater in Ethiopia. Applied Geography, 85, 1–13. https://doi.org/10.1016/j.apgeog.2017.05.010