
 ?Mathematical formulae have been encoded as MathML and are displayed in this HTML version using MathJax in order to improve their display. Uncheck the box to turn MathJax off. This feature requires Javascript. Click on a formula to zoom.
Abstract
The population of Ethiopia is growing rapidly and consequently, the country may face aggravated food insecurity. Therefore, improving agricultural productivity is critical to feed its inhabitants. The occurrence of drought and poor irrigation systems lead to a real burden on water resources. Thus, optimal irrigation planning and management should be considered. In this study, the linear programming (LP) model was applied to optimally allocate water and land for different field crops at Koga irrigation scheme. The model was applied for an optimally defined cropping pattern and three levels of deficit (10%, 20%, and 30% of ET) irrigation. The objective function of the study was to maximize net benefit and water productivity. The model was developed using constraints of water, land and different field crop diversifications. CROPWAT 8.0 was used for the estimation of crop water requirements using local climate and soil data. The result showed that using 20% deficit irrigation for the identified optimal cropping pattern, 7361 ha of land (2018 ha additional land from the irrigated land of the scheme in 2016/17) could be irrigated. Under this scenario of deficit irrigation, a net benefit of 284.7 million Birr and water productivity of 5.3 Birr m−3 have been achieved. This indicates that using 20% deficit irrigation, the net benefit increases by 23% and the water productivity by 55% as compared to the existing irrigation practice. Wheat, barley and pepper were not found to be attractive crops in the cropping pattern system. The actual irrigation system has been found poorly managed in addition; the cropping system and the irrigation activity were operated below the optimal. Therefore, the practice of deficit irrigation (recommended 20% deficit irrigation) can substantially increase the net benefit and water productivity of the scheme.
PUBLIC INTEREST STATEMENT
The agricultural sector around the world is under pressure due to an increase in water demand for irrigation, climate change, and frequent droughts. In Ethiopia, the population is growing rapidly and the growth is expected to continue which can lead to increases food insecurity. Therefore, to meet this problem, the country has implemented many infrastructures like Koga irrigation scheme. However, the water allocation and cropping pattern of most of the schemes have not been well defined. Efficient water allocation saves water and increases the cultivated land. Generally, optimal water allocation and cropping pattern are the management alternatives that improve water productivity and benefit of farmers. But this optimal water allocation has to be clearly defined under different scenarios using different tools (mathematical programming models). Therefore, this piece of research work can be a good insight to show deficit irrigation as one option to increase productivity of the irrigation schemes.
Competing Interests
The authors declares no competing interests.
1. Introduction
Today the agricultural sector around the world is under more pressure because of the increase in demand for food, climate change, and frequent droughts (Misra, Citation2014). Water is a diminishing resource and it is becoming an economically scarce resource in arid and semi-arid areas and also in regions where rainfall is abundant (Pereira, Citation1990). It is one of the main production inputs in agriculture to maintain the development of agriculture (Dinar et al., Citation1997). Currently and more in the future, irrigated agriculture will suffer from irrigation water shortage, particularly in the areas with high evaporative demand, low and irregular rainfall, and repeated drought periods (Bouwer, Citation1987). Though agriculture is the dominant sector, most of Ethiopia’s cultivated land is under rain-fed agriculture (Awulachew et al., Citation2007). Following a large variation of rainfall in spatial and temporal, there is insufficient water for most farmers to produce more than one crop per season which causes frequent crop production failures (Awulachew et al., Citation2010). Irrigated agriculture plays a crucial role in determining future food security, poverty reduction, and economic growth, thus effective management is an important issue in an irrigation system (Mozumdar, Citation2012). Realizing the importance of irrigation, Ethiopia has been allocating huge investments for irrigation infrastructure development over the last two decades (Abate, Citation1994). One of the infrastructures is the Koga large dam and irrigation project located in the Blue Nile Basin, Ethiopia.
The design capacity of Koga Irrigation Scheme was to irrigate 7004 ha command area (Birhanu et al., Citation2015). However, the actual irrigated area was 5343 ha in the 2016/17 irrigation season (76.3 % of the design or planned irrigable area). In addition, other studies showed that the maximum irrigated command area was 5000 ha in 2014 due to severe water shortage and poor water allocation problems (Abiyu & Alamirew, Citation2014). This indicates that either the released water from the reservoir was not sufficient or there are poor cropping patterns and mismanaged water to irrigate the designed area. Improved and efficient irrigation water management practices are essential for the enhancement of farm profitability and water productivity in the period of limited water supplies (Ali, Citation2010). Efficient water allocation saves water and increases the cultivated land area. In order to optimize water use and crop productivity, one has to improve water resource allocation optimally in a water limiting environment (Chartzoulakis & Bertaki, Citation2015; Faisal & Ahmad, Citation2009). Irrigation managers and decision-makers face a problem of allocating available water and land resources to multiple crops at severe water shortage. Therefore, to handle such problems, mathematical programming models are helpful in examining the allocation of scarce resources. From the existing optimization models (Dynamic Programming, Linear Programming, Non-linear Programming, Genetic Algorithm, etc), Linear programming is more popular as it is efficient in solving a large number of constraints, and effective in optimization process (Matanga & Marino, Citation1979; Singh et al., Citation2001). In irrigated agriculture where various crops are competing for a limited quantity of land and water resources; Linear Programming (LP) model is the best and simple technique for optimizing an irrigated agriculture (Aparnathi et al., Citation2014; Dawoud, Citation2014; Vedula & Kumar, Citation1996).
Cropping pattern is one of the most effective parameters in water productivity of irrigation schemes and a major area of attention to the agriculture sector for policies makers and planners (Keramatzadeh et al., Citation2011). An appropriate approach in a multi-crop and water limiting situation is to use a combination of full and deficit irrigation over different irrigation seasonal periods (Gorantiwar & Smout, Citation2003). The Chance Constraint Linear Programming (CCLP) model was successfully applied at Koga to optimize the productivity set at the initial design phase by (Birhanu et al., Citation2015) with five major crops and found that it is possible to cultivate from 5904 ha to 8051 ha of land at different inflow probability expedience. However, multiple cropping patterns are common practices at the scheme and vary from year to year (9 to 12 types of crops) due to farmers’ preferences, socioeconomic factors, government directives, and the availability of water released from the reservoir (Birhanu et al., Citation2014). This affects the supply and demand of the system, design cropping pattern, yield and farm gate price, and reservoir operation rule of the scheme.
The potential for change in the agricultural sector and the volatile nature of the market substantiates the need for further modification of the design system cropping pattern with an introduction of high-value crops for farmers to match the local and international market interests. The purpose of this paper is to determine the optimal crop pattern under deficit irrigation conditions with regard to regional limitations and water availability using linear programming.
2. Material and methods
2.1. Study area description
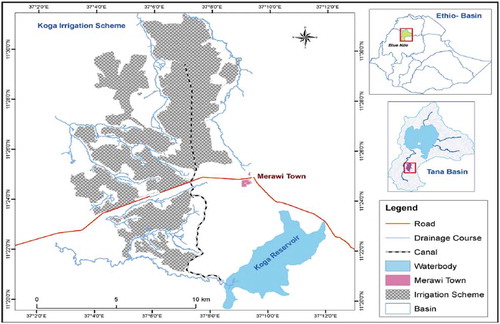
Koga irrigation project, shown in Figure , is located in the upper Blue Nile Basin under Mecha district, south of the Amhara Region, Ethiopia where agriculture is the dominant economic activity. The Koga catchment lies between 11°20ʹ to 11°32ʹ North Latitude and 37°02ʹ to 37°11ʹ East Longitude (Birhanu et al., Citation2015). Mean annual precipitation, average minimum and maximum temperature of the area are 1431 mm, 12 °c, 28 °c respectively. Koga irrigation system is comprised of 12 blocks (command area) and water distribution canals and water flows in a gravity system to the canals.
Figure 1. Location of the study area
2.2. Model formulation
In this study, deficit irrigation was optimized using a linear programming model. Reference evapotranspiration (ETo) was estimated using Doorenbos and Pruitt (Citation1977) FAO penman-Monteith equation (Eqn.1) and crop and irrigation water requirement were computed using CropWat 8.0 software model.
Where: ETo = reference evapotranspiration [mm day−1], Rn = net radiation at the crop surface [MJ m−2 day−1], G = soil heat flux density [MJ m−2 day−1], T = mean daily air temperature [°C], U2 = wind speed at 2 m height [m s−1], es = saturation vapour pressure [kPa], ea = actual vapour pressure [kPa], es-ea = saturation vapour pressure deficit [kPa], ∆ = slope vapour pressure curve [kPa °C−1], γ = psychrometric constant [kPa °C−1]
The study site (Koga irrigation scheme) has only temperature and rainfall data records. Hence temperature and rainfall data were taken from this site while other data were taken from Dangila and Bahir Dar Meteorological stations. Dangila meteorological station has data records from 1997 to 2017 years. Bahir Dar station is also a synoptic station containing all elements of climatic data from 1980 to 2017 record years. Koga scheme is located at 35 km from Bahir Dar and 38 km from Dangila and found in similar agro-ecology. Therefore, climatic data of interest (outside temperature and rainfall) were taken as an average of the two nearby stations for the computation of crop water requirements (Table ).
Table 1. Koga irrigation project climate data used
The soil of the study area is classified as a clay texture class based on the laboratory result analyzed at Adet agricultural research center. Field capacity (FC), permanent wilting point (PWP) and total available water (TAW) were also determined for computation of irrigation and crop water requirement (Table ).
Table 2. Soil characteristics of the study site
Local rainfall data was used for estimation of effective rainfall (RF) and it was generated based on 80 percent dependable rainfall, rather than average rainfall (Figure ). For this study, the USDA Soil Conservation Service method was used for the estimation of effective rainfall.
Figure 2. Koga effective rainfall, average rainfall, dependable rainfall, and ETo
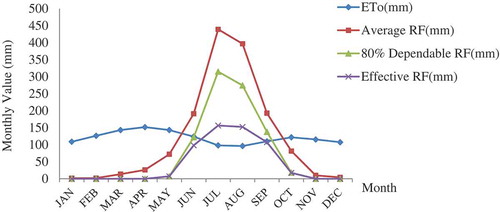
Dependable rainfall occurs from May to October for six months and the effective rainfall follows the 80 percent dependable rainfall pattern with some deviation throughout the year. The monthly reference evapotranspiration exceeds the monthly rainfall from January to May and from November to December, indicating the need for compensable irrigation water supply for crop production in the study area during these months.
Three different scenarios were developed to study optimal water productivity and all crops were allowed to experience three different levels of evapotranspiration (ET) deficiency (deficit irrigation) occurring continuously over the total length of the growing period. A relative evapotranspiration deficiency of 10%, 20%, and 30% of crop water requirement (CWR) was tested independently in the model. The yield reductions due to different levels of ET deficit were incorporated using the simple linear crop water production function by applying (Eqn.2). The study assumed that water is the only constraint variable factor in the study while other factors affecting production (climate, soil condition, crop variety, and crop management practices, etc.) remained similar. Water stress affects the yield of crops and while it does not affect seed quality and the market price of the crops (the effect was only on the mass yield of the corresponding crops).
The response of yield to the water supply is quantified through the yield response factor (ky) which relates relative yield decrease (1-Ya/Ym) to relative evapotranspiration deficit (1-ETa/ETm). It is assumed that the relationship between the relative yield (Ya/Ym) and the relative evapotranspiration (ETa/ETm) is linear and valid for water deficits up to about 50 percent or (1-ETa/ETm = 0.5) when developing the Ky values of most crops (Doorenbos & Kassam, Citation1979). According to Doorenbos and Kassam (Citation1979) crop yield response factor (Ky) on relative yield decrease and relative evapotranspiration deficit is given by the following empirical formula.
Where: Ya = actual harvested yield, Ym = maximum harvested yield, Ky = Yield response factor, ETa = actual evapotranspiration, ETm = maximum evapotranspiration
The linear programming model was developed to allocate water that maximizes total benefit and water productivity and the model constraints were total water availability and maximum area allowed for each crop. Microsoft Office Excel tool of Solver function was used for mathematical model formulation. Irrigated crops and area coverage of the years 2016/17 were collected from Koga irrigation and water management office, Merawi. Similarly, important data such as the cost of production (fertilizer cost, seed cost, labor and chemical cost), sell prices, yield, planting and harvesting dates of major crops (Table ) were obtained from Koga irrigation and water management office and direct interviews with irrigators. Unit profit was calculated based on the difference in the sale price and production cost of irrigated crops. Due to a lack of locally validated values, data of crop coefficient (Kc) for estimation of crop water requirement, the yield response factors (Ky) for each growth stage and length of the growing period were taken from (Allen et al., Citation1998) and (Doorenbos & Kassam, Citation1979) respectively (Table ).
Table 3. Average production Cost (Pc), Maximum yield (Ym), Average local price and cultivated area of Existing crops (2016/17)
Table 4. Yield response factor (Ky) and Crop coefficient factor (Kc) values For each crop
2.3. The objective function
The objective function of the study was to maximize the net benefit of the irrigation scheme. The total profit was estimated using the difference in production cost and the final selling price of all cultivated crops at farm gate prices.
Where Z is the total profit achieved from cultivating the ith crop in Ethiopian Birr (ETB), Pi is the unit sell price of the ith crop (ETB t−1), Ci is the production cost of the ith crop (ETB ha−1), Ai is the decision variable, which is the area cultivated for the ith crop, Yi is the yield of the ith crop activity (ton ha−1) and Nc is the number of cultivated crops. (1USD Dollar = 32.59 ETB).
2.4. The constraints
The above objective function was subjected to constraints of total seasonal irrigation water supply from the reservoir and crop diversification in the command area.
2.4.1. Land area constraint
The area allocated to each crop during the cropping season should not exceed the total available area for cultivation in the scheme. The global optimal solution was allowed to relaxing the constraints of the total command area up to 7500 ha.
Where Xn is crops that are cultivated during the study period and At is the total relaxing area in the irrigation project.
2.4.2. Water availability constraint
The model was developed using 48% of overall project efficiency and the total gross irrigation requirement of all cultivated crops in the command area should not exceed available water for irrigation. The average water released from the reservoir from 2011/12 to 2016/17 irrigation season was 60.46 million meters cubic (Mm3) as shown below (Table ). However, 6.65 Mm3 water environmental (compensation) water was released from the reservoir on a monthly basis (Birhanu et al., Citation2014) (Table ).
Table 5. Actual released water from the reservoir (Mm3) from 2011/12 to 2016/17
Table 6. Monthly environmental (compensation) release (Mm3)
The operation of the reservoir water was started in November and released through irrigation off-takes. Therefore, in this study, 53.81 Mm3 (considering environmental released) water was taken as the average volume of water released from the reservoir. Mathematically;
Where: Ai is the area covered by ith crop (ha), is the project efficiency (%), Wa is the total available water (m3), CWRi is the crop water requirement of the ith crop (m3 ha−1) and Peff is total effective rainfall (m3 ha−1).
2.4.3. Crop diversification constraint
Since the command area lies in a region that predominantly depends on the agricultural economy, the farmers want to ensure the production of certain high-value crops in addition to the designed cropping pattern. Therefore, the constraint of crop diversification was done using the initial design cropping pattern and the newly introduced crops during the formulation of the model. In the initial design and planning phase of the project, the crops selected for irrigation in the scheme were wheat (1260 ha), maize (3290 ha), potato (1120 ha), onion (840 ha) and pepper (490 ha). While barley (132 ha), cabbage (492 ha), tomato (111 ha) and garlic (162 ha) were the newly introduced crops in the scheme and the model was developed by taking the maximum area of these crops as 500 ha and we used this area as the maximum allowed area coverage to encourage high-value crops in the scheme. Therefore, the area allocated to each crop should be less than or equal to the maximum allowed land in the cropping pattern and mathematically expressed as;
Where Amax is Maximum allowed area of crop and Ac is the area of crops that to be optimally allocated.
2.4.4. Non-negativity constraints
All decision variables were made greater than or equal to zero (no negative area) is covered by each crop in the scheme.
Where X1 … X9 are the decision variables of the land allocated for each crop.
3. Result and discussion
The model was run based on the above constraints to get optimal water allocation and cropping pattern that gives maximum benefit and water productivity relative to the actual cropping pattern. The yield reduction due to water deficit was estimated based on Doorenbos and Kassam (Citation1979) (Eqn.2) and the unit profit was estimated accordingly for the selected crops. The results of the estimated values of yield, benefit, and crop water requirement (CWR) using three levels of deficit irrigation (10, 20, and 30 %) have been depicted (Table ).
Table 7. Estimated yield, benefit, and CWR under different level of deficit irrigation
Table shows the three scenarios of deficit irrigation investigated and the results of the irrigated areas allocated by the model for the crops designed under the optimal cropping pattern to maximize total benefit and water productivity versus the actual area allocated for the respective crops using the actual cropping pattern. The result indicated that without deficit water only 5877 ha of land was irrigated, revealed that deficit irrigation was needed to cultivate the capacity of the scheme. From the results of Tables and , using 10% deficit irrigation and optimal cropping pattern, there could be the possibility of increasing irrigated land from 5343 ha to 6553 ha, the net benefit from 229.8 to 315.6 million Birr and water productivity from 3.4 Birr m−3 to 5.9 Birr m−3. The model allocated 0 ha of land for wheat, barley, and pepper were not found profitable in the cropping pattern in the 10% deficit scenario. The remaining crops except maize can be cultivated and achieved their allowed maximum limit of land for maximum profitability of the scheme has been indicated on (Table ).
Table 8. Optimal land, water allocation and net benefit using a different level of deficit irrigation
For the scenario of 20 % deficit irrigation, similar irrigable area allocation as a scenario of 10% deficit irrigation for each crop but the possibility to irrigate the potential land (7361 ha) of the scheme. Wheat attained 121 ha and maize achieved the allowed land limit by the model was observed, while the water productivity and net benefit decreased. For the 30 % deficit irrigation scenario, it was observed that the model changed the allocated area for wheat (increase the area for wheat to 1260 ha) and (barley was found not attractive in this scenario as well). It looks that for the prevailing condition of the maximum available irrigable area of not more than 7000 ha and noticeable water shortages (existing irrigation limited to not more than 5500 ha due mainly to insufficient water availability), the 20% deficit irrigation scenario has the capacity to irrigate the initially planned size of the command area during water scarcity conditions.
The deficit water allocation of the model showed that a total of 315.8, 284.7, 256.9 million Birr net benefit and 5.9, 5.3, 4.8 Birr m−3 water productivity was achieved using 10%, 20% and 30% deficit irrigation respectively. This implies that 10% deficit irrigation scenario increases the net benefit by 37% and water productivity by 73% as compared to the existing irrigation practice. Using 20% and 30% deficit irrigation and cropping pattern, the net benefit could be increased by 23% and 11% respectively. In addition, water productivity was better as compared to actual irrigation practice. The study revealed that with deficit irrigation and optimal cropping pattern it was possible to improve water productivity and net benefit of the schemes. The land allocated to maize, potato, cabbage, tomato, onion, and garlic by the model attained 100% of their maximum allowed land while wheat, barley, and pepper were not favored in the cropping system. This indicated that wheat, barley, and pepper were not the competitive crops in the cropping pattern system due to low productivity in the scheme for the study period under consideration.
4. Conclusion
The aim of this study was to optimize the water productivity and net benefit of the Koga scheme by changing the designed cropping pattern to the optimal cropping pattern that maximizes net benefit using a linear programming model under deficit irrigation. The study showed that using deficit irrigation and optimal cropping pattern, it is possible to irrigate the potential land of the scheme. The model allocated irrigable areas to the high-value crops (maize, potato, cabbage, tomato, onion, and garlic) in the cropping system. Wheat, barley and pepper were not the competitive crops in the cropping pattern system because of low market prices in the area. Therefore, irrigators and irrigation managers should choose high-value crops and irrigation levels for selected crops that maximize net benefits. Optimization of cropping patterns and effective utilization of water is the management alternatives that improve water productivity and net benefit during a shortage of water. Generally, when there is irrigation water stress, farmers need to select high-value crops (maize, potato, cabbage, tomato, onion, and garlic) in the scheme to improve the net benefit and water productivity. The relationship between water and yield reduction due to water stress is important to decide the amount of water applied and yield production. Using deficit irrigation and optimal cropping pattern, it could be possible to irrigate the design capacity of the scheme. The actual irrigated land during the study period in the scheme showed that the cropping system and the irrigation water released from the reservoir were poorly managed. The applicability of the model can increase when many of the actual situations and other constraints of the system are incorporated.
Acknowledgements
First, we would like to thank the Ethiopian Road Authority (ERA) for the sponsoring and financial funds in this study. Then, a special thank is also given to the Adet Agricultural Research Center for making timely and quality soil sample testing.
Disclosure statement
The authors declare that there is no conflict of interest in this article
Additional information
Funding
Notes on contributors

Dires Tewabe
Dires Tewabe is an agricultural water management Researcher at Adet Agricultural Research Center, Ethiopia. He had done research activities in bed and furrow irrigation techniques, Crop water requirements, water quality, and water management related issues.
Mekete Dessie
Mekete Dessie (Ph.D) is an associate professor at Bahir Dar University, Ethiopia, in the Faculty of Civil and Water Resource Engineering. He has promoted more than 15 MSc students during their final thesis works and he has been also working as a consultant of different water resource projects. As a principal researcher, he has carried out researches in the areas of the water balance of lakes (Lake Tana), hydrological modeling, floodplain hydrology and related issues. He has published more than 10 research papers in well-recognized journals (e.g., Journal of hydrology, Hydrology and Earth System Sciences).
References
- Abate, Z. (1994). Water resources development in Ethiopia: An evaluation of present experience and future planning concepts. Ithaca press.
- Abiyu, A., & Alamirew, T. (2014). Evaluation of Stage-Wise Deficit Furrow Irrigation Application on Water Advance-Recession Time and Maize Yield Components at Koga Irrigation Scheme, Ethiopia. American Journal of Scientific and Industrial Research.
- Ali, M. (2010). Crop water requirement and irrigation scheduling. Fundamentals of irrigation and on-farm water management, 1, 399-452. New York, NY: Springer.
- Allen, R. G., Pereira, L. S., Raes, D., & Smith, M. (1998). Crop evapotranspiration-Guidelines for computing crop water requirements-FAO Irrigation and drainage paper 56. Fao, Rome, 300, D05109.
- Aparnathi, M., Bhatt, D. K., Aparnathi, M., & Bhatt, D. K. (2014). Linear programming model for optimal cropping pattern for economic benefits of Mrbc command area. International Journal, 1, 47–13.
- Awulachew, S. B., Erkossa, T., & Namara, R. E. 2010. Irrigation potential in Ethiopia. Constraints and Opportunities for Enhancing the System; International Water Management Institute: Addis Ababa, Ethiopia.
- Awulachew, S. B., Yilma, A. D., Loulseged, M., Loiskandl, W., Ayana, M., & Alamirew, T. (2007). Water resources and irrigation development in Ethiopia. International Water Management Institute (IWMI).
- Birhanu, K., Alamirew, T., Dinka, M. O., Ayalew, S., & Aklog, D. (2014). Optimizing reservoir operation policy using chance constraint nonlinear programming for Koga irrigation Dam, Ethiopia. Water Resources Management, 28(14), 4957–4970. https://doi.org/10.1007/s11269-014-0770-4
- Birhanu, K., Megerssa Dinka, T., & Semu Ayalew,. (2015). Optimizing cropping pattern using chance constraint linear programming for Koga Irrigation Dam, Ethiopia. Irrigation & Drainage Systems Engineering, 4(2), 2. https://doi.org/10.4172/2168-9768.1000134
- Bouwer, H. (1987). Effect of irrigated agriculture on groundwater. Journal of Irrigation and Drainage Engineering, 113(1), 4–15. https://doi.org/10.1061/(ASCE)0733-9437(1987)113:1(4)
- Chartzoulakis, K., & Bertaki, M. (2015). Sustainable water management in agriculture under climate change. Agriculture and Agricultural Science Procedia, 4, 88–98. https://doi.org/10.1016/j.aaspro.2015.03.011
- Dawoud, S. D. (2014). Economic optimal allocation of irrigation water in Egypt. Journal of Development and Agricultural Economics, 6, 472–480. doi:10.5897/JDAE2014.0609
- Dinar, A., Rosegrant, M. W., & Meinzen-Dick, R. (1997). Water allocation mechanisms: Principles and examples. The World Bank.
- Doorenbos, J., & Kassam, A. (1979). Yield response to water. Irrigation and Drainage Paper, 33, 257. https://scholar.google.com/scholar
- Doorenbos, J., & Pruitt, W. 1977. Crop water requirements. FAO irrigation and drainage paper 24. Land and Water Development Division, FAO, Rome, 144.
- Faisal, B., & Ahmad. (2009). Options for improving irrigation water allocation and use: A case study in hari rod river basin, Afghanistan. AIT.
- Gorantiwar, S., & Smout, I. K. (2003). Allocation of scarce water resources using deficit irrigation in rotational systems. Journal of Irrigation and Drainage Engineering, 129(3), 155–163. https://doi.org/10.1061/(ASCE)0733-9437(2003)129:3(155)
- Keramatzadeh, A., Chizari, A., & Moore, R. (2011). Economic optimal allocation of agriculture water: Mathematical programming approach. Journal of Agricultural Science and Technology, 13(4), 477-490.
- Matanga, G. B., & Marino, M. A. (1979). Irrigation planning: 1. Cropping pattern. Water Resources Research, 15(3), 672–678. https://doi.org/10.1029/WR015i003p00672
- Misra, A. K. (2014). Climate change and challenges of water and food security. International Journal of Sustainable Built Environment, 3(1), 153–165. https://doi.org/10.1016/j.ijsbe.2014.04.006
- Mozumdar, L. (2012). Agricultural productivity and food security in the developing world. Bangladesh Journal of Agricultural Economics, 35, 53–69. doi: 10.22004/ag.econ.196764
- Pereira, L. (1990). The role of irrigation in mitigating the effects of drought. In Proc., 14th ICID Congress on Irrigation and Drainage. ICID Chanakyapuri.
- Singh, D., Jaiswal, C., Reddy, K., Singh, R., & Bhandarkar, D. (2001). Optimal cropping pattern in a canal command area. Agricultural Water Management, 50(1), 1–8. https://doi.org/10.1016/S0378-3774(01)00104-4
- Vedula, S., & Kumar, D. N. (1996). An integrated model for optimal reservoir operation for irrigation of multiple crops. Water Resources Research, 32(4), 1101–1108. https://doi.org/10.1029/95WR03110