
Abstract
Durum wheat is one of the major cereal crops produced in East Shewa Zone, Oromia Regional state for the purpose of both home consumption and market. However, its productivity is low due to low availability of soil nutrients. Therefore, field experiment was carried out in 2017–2019 cropping seasons to determine economically feasible rate of blended NPSB and N fertilizes for increase the productivity of durum wheat. The treatments consisted of four levels of blended (0, 50, 100, and 150 kg NPSB ha−1) and five levels of nitrogen (0, 46, 69, 92, and 115 kg N ha−1) fertilizers. The experiment was laid out in a randomized complete block design in a factorial arrangement and replicated three times per treatment. Combined analysis of the results revealed that chlorophyll content, days to heading, days to maturity, plant height, harvest index, thousand kernels weight, and lodging index were highly significantly (p < .01) affected only by the main effect of N. However, total tillers (TT), productive tillers (PT), spike length (SL), number of kernels per spike (NKPS), aboveground biomass yield (AGBY), grain yield (GY), and straw yield (SY) were significantly (p < .05) affected by the interaction effect of blended NPSB and nitrogen fertilizers. The highest TT (421.33 plant m−2), AGBY (17,383 kg ha−1), and SY (12,349 kg ha−1) were recorded at combined application of 150 kg blended NPSB with 115 kg N ha−1 while the highest PT (375.67 plant m−2), SL (6.67 cm), NKPS (50.07), and GY (5,666 kg ha−1) were obtained at combined application of 150 kg blended NPSB with 92 kg N ha−1. The result of economic analysis showed that combined application of 100 kg NPSB and 92 kg N ha−1 gave economic benefit of 2,032.13 US$ ha−1 with acceptable marginal rate of return (97.77%). Therefore, it could be concluded that application of 100 kg blended NPSB with supplement of 92 kg N ha−1 fertilizer rates were economically profitable yield of durum wheat production in the study area.
Keywords:
PUBLIC INTEREST STATEMENT
Soil fertility is one of the biggest challenges to achieving food security and poverty reduction in Ethiopia. Farmers in Ethiopia particularly at Ada’a district, regardless of using optimum NP fertilizer rates to increase the productivity of the crop, they apply only 23 kg N ha−1 and 46 kg P2O5 h−1 to durum wheat which is not sufficient to meet the crop demand for optimum growth. Due to this, the average yield is still now very low as compared to durum wheat productivity elsewhere and the yield potential (6 tons ha−1) of the crop. This low yield is primarily allied to the depletion of soil fertility due to continuous nutrient uptake of crops and low fertilizer use.
In ordered to reducing such production constraint, there is a need to designing site and context-specific balanced fertilizer recommendations. Thus, a balanced use of mineral fertilizers likes blended (NPSB) with the supplement of urea fertilizers has increased durum wheat production and best economic return.
Competing interests
The authors declares no competing interests.
1. Introduction
Wheat is a staple food that provides around 20% of protein and calories consumed worldwide (Food and Agricultural Organization of the United Nations Statistics [FAOSTAT], Citation2015). Demand for wheat is projected to continue to grow over the coming decades, particularly, in the developing world to feed an increasing population and with wheat being preferred food, continuing to account for substantial share of human energy needs in 2050 (Wageningen, Citation2016). Ethiopia is considered to be a center of diversity for durum wheat (Triticum turgidum L. var. durum). For millennia, using locally available germplasm and their traditional knowledge, farmers have developed a broad range of genetically diverse durum wheat landraces adapted to the highly variable niche environments in the Ethiopian highlands, an area also referred to as the“ wheat belt” of the country (Diego et al., Citation2016).
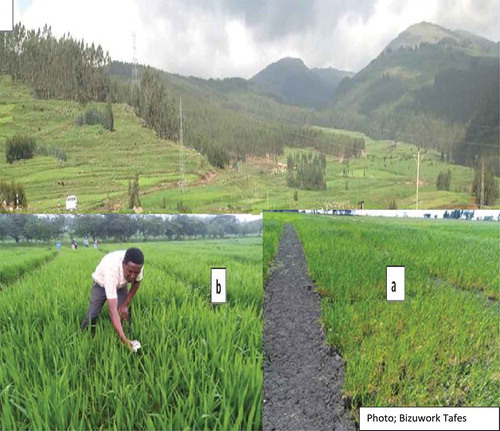
Figure. (a) Traditional cultivation of durum wheat in central highlands of Ethiopia. (b) Experimental field performance of durum wheat by application of blended (NPSB) with the supplement of urea fertilizers
Durum wheat is mainly used for the production of pasta and couscous, but also for a number of other semolina products such as frike, bourghul, and unleavened breads. Although the primary use of durum is in the manufacture of pasta products (macaroni, spaghetti, and noodles), in Ethiopia it is also used in making fermented leveled bread, called ‘injera’ and other indigenous food preparations (Tesemma, Citation1988). In East Shewa Zone, wheat is one of the major cereal crops produced next to tef and maize for the purpose of both home consumption and market. In the zone, out of the total land size of 395,977.48 hectares planted by cereals, wheat covers 72,164.91 hectares, which is 18.2% of the production area covered by all cereals in 2017/2018 cropping season (Central Statistical Agency [CSA], Citation2018). Durum wheat covers 24% of the total cultivated lands used for wheat. However, out of the total cereal grain production (952,163.7 tons), wheat accounted for 22.3% (212,212.3 tons), and the average yield of wheat in 2017/2018 cropping season was only 2.9 tons ha−1 (CSA, Citation2018). The average yield is above the national average yield but which is still very low as compared to the yield potential of wheat (6 tons ha−1).
The low yield is primarily allied to the depletion of soil fertility due to continuous nutrient uptake of crops, low fertilizer use and insufficient organic matter application (Kidane Giorgis, Citation2015). In addition, for the last three decades, Ethiopian agriculture depended solely on imported fertilizer products namely urea and di-ammonium phosphate (DAP) which are source of N and P although most Ethiopian soils lack other macro- and micro-nutrients (Ethiopian Soil Information System [EthioSIS], Citation2014). This may lead to low nutrient uptake efficiency of crops due to low availability or lack of synchrony of maximum growth of crops with adequate availability of the nutrients in the soil. Nutrient mining due to sub optimal fertilizer use in one hand and unbalanced fertilizer uses on other have favored the emergence of multi nutrient deficiency in Ethiopian soils (Haile & Boke, Citation2011). Based on the national soil data base, in addition to the macronutrients, due to long year cultivation, some of the micronutrients like zinc, boron, and copper are depleted from the soil in the major crop producing area of the country (EthioSIS, Citation2014). In addition, farmers at Ada’a district regardless of using optimum NP fertilizer rates to increase the productivity of the crop, they apply only 23 kg N ha−1 and 46 kg P2O5 h−1 to durum wheat which is not sufficient to meet the crop demand for optimum growth (Agricultural Transformation Agency [ATA], Citation2014).
Many researchers reported that the use of balanced fertilizers have a promising role in growth and development of crop plants which resulted in improved quality and quantity of the agricultural produce. High fertilizer responsive varieties express their full yield potential when trace elements are applied along with NP fertilizers (Nataraja et al., Citation2006). Chaudry et al. (Citation2007) stated that micronutrients (Zn, Fe, B) significantly increased the wheat yield over control when applied in combination with N, P, S nutrients. It has been long understood that the role of macro and micronutrients is crucial in crop nutrition and important for realizing higher yields. Soil test-based application of plant nutrient rather than the blanket recommendation of urea and DAP, especially those containing sulfur, boron, and other nutrients is recommended in averting problems caused due to nutrient deficient soil (EthioSIS, Citation2014).
Therefore, the use of balanced fertilizers containing both macro and micronutrients, which is based on the site-specific soil fertility assessment, is believed to be one of the solutions for reducing such production constraints. Although nutrient content of the fertilizer that suits the needs and the productivity of the crops, in most part of Ethiopia, particularly, Ada’a farmers have limited information on the impact of balanced fertilizer types and rates except only urea and DAP which are source of N and P. However, new blended fertilizer such as NPSB (18.9% N, 37.7% P2O5, 6.95% S, and 0.1% B) a mixture of inorganic fertilizer is currently being used by the farmers in the study area based on the soil fertility map of the area (EthioSIS, Citation2014). However, nitrogen content per 100 kg of the blended fertilizer (NPSB) is 18.9 kg which is very low rate to apply it to one hectare of land as compared to the blanket nitrogen recommendation (46 kg N ha−1).
The low nitrogen content of the blended NPSB fertilizer also makes it unsuitable to use it as the only nitrogen source as doubling or tripling the NPSB amount (to meet the N need of durum wheat), in turn this may inflate P, S, and B applied beyond durum wheat requirement. Furthermore, the use of new soil nutrients such as S and B in the area is expected to increase the nitrogen requirement of the crops, in general, and durum wheat, in particular, in the area. Thus, there is a need to test the blended NPSB fertilizer by supplementing it with nitrogenous fertilizer source such as urea for optimum productivity of durum wheat. To this end, it is worth to investigate balanced fertilizer rates and supplemental N rates to advance production and productivity of durum wheat to satisfy both small-scale producers in the study area and the demand of the processing industries. Therefore, the present study was undertaken with the following objectives: to determine optimum blended NPSB and N fertilizer rates for the productivity of durum wheat in the study area.
2. Materials and methods
2.1. Description of experimental site
The experiment was conducted at Debre Zeit Agricultural Research Center on seed multiplication field for three consecutive (2017–2019) cropping seasons under rain-fed condition. Debre Zeit Agricultural Research Center is located in East Shewa Zone of Oromia Regional State. It is found at 47 km away from South East of the capital city of Ethiopia, Addis Ababa. Its geographical location is 8°44′ N latitude and 38°58′ E longitude. The altitude is about 1,900 m above sea level, while the majority of trial fields are heavy soils (Vertisol) with few pockets of light soils (Alfisols/Mollisols) (World Reference Base [WRB], Citation2006). Total rain fall in the year 2017, 2018 and 2019 main crop growing months (June to October) were 627,374 and 611.14 mm respectievly, (Figure ).
Figure 1. Cumulative rainfall from planting to harvest maturity during the three crop seasons at Debre Zeit Agricultural Research Center.
2.2. Description of experimental material
The durum wheat variety called Utuba was used for this study. The variety was selected based on yield, disease resistance and farmer acceptance in the study area. The seed of the variety Utuba was obtained from Deber Zeit Agricultural Research Center.
2.3. Treatments and design
The treatments consisted of four levels of blended (0, 50, 100, and 150 kg NPSB ha−1) and five levels of nitrogen (0, 46, 69, 92, and 115 kg N ha−1), fertilizers. A total of 20 treatment combinations were considered. The experiment was laid out in a randomized complete block design (RCBD) in a factorial arrangement replicated three times per treatments. The total number of plots in the experiment were 60 (20 × 3), each of 3.2 m × 3 m (9.6 m2) size. The distances between the plot and block were 0.5 m and 1.0 m, respectively. Each plot consisted of 16 rows and spaced 20 cm apart. The net central unit areas of each plot consisting of eight central rows of 2.80 m long were harvested and used for yield determination. The two outer most rows were kept as border plants. For nitrogen fertilizer, urea (46% N) and for blended NPSB (18.9% N,—37.7 P2O5 %,—6.95 S %,—0.1% B) were used as fertilizer source.
2.4. Experimental field management
The experimental field was plowed two times by tractor and following breaking clods and leveling the land was done manually. Finally, the unit plots were prepared with spade for sowing. The seed of variety Utuba was collected from DZARC and sown with hand drilling on 17 July 2017, on 14 July 2018, and on 16 July 2019 cropping seasons at the rate of 150 (kg ha−1) in 20 cm rows space in previously tef [Eragrostis tef (Zucc.) Trotter] planted field. The entire blended NPSB fertilizer was applied as per the treatments at a full dose at sowing, whereas N was applied in two splits (1/3 at sowing and 2/3 at tillering about 30 days after sowing) through application of urea. All broad leaf and grass weeds were removed by hand weeding. Additionally, weeding of late-emerging weeds was done to avoid competition with the crop plants for applied N.
2.5. Data collection and measurement
2.5.1. Phenology parameters
Days to 50% heading was recorded when about 50% of the plants in a plot produced spikes. Days to physiological maturity was recorded when about 90% of the plants reached physiological maturity based on visual observation. It was indicated by senescence (turning to light yellow) of the leaves and vegetative parts as well as free threshing of grain from the glumes when pressed between the forefinger and thumb. Plant height: at maturity, 10 effective tiller plants were taken randomly from the net plot area of each plot and height was measured from the ground to the tip of tillers using ruler and the mean value were determined in cm. Chlorophyll content at flag leaf stage: the chlorophyll content was measured by SPAD chlorophyll meter Model (CCM-200). The readings of chlorophyll content at flag leaf stage of green leaves were noted from five randomly selected plants and then averaged to get the SPAD chlorophyll content.
2.5.2. Yield components and grain yield
Total tillers (TT) (both effective and non-effective) tillers were determined at maturity by counting all the tillers in 1 m length row taken from five rows (1 m wide) in each net plot area and then converted to m2. Productive tillers (effective tillers) were determined at maturity by counting all the productive (head bearing) tillers in one m length row taken from five rows (1 m wide) in each net plot area and then converted to m2. Spike length (SL): at maturity, 10 spikes from the effective tillers were taken randomly from the net plot area of each plot and measured from the bottom of the spike to the tip of the spike with excluding the awns and then, the mean value was determined in cm. Number of kernels per spike (NKPS): 10 spikes from the effective tillers were taken randomly from each plot at the time of harvesting. Then the spikes were threshed separately and counted the seed and then mean NKPS was recorded. Aboveground biomass yield (AGBY): At maturity, the whole aboveground plant parts, including leaves, stems, and seeds from the net plot area in each plot was harvested and sun dried until a constant weight and then the aboveground biomass was weighed and then expressed in kg ha−1. Thousand kernels were counted by electronic counter and weighed by the electronic balance later thousand kernels weight was expressed in gram. Harvest index (HI): it refers to the ratio of grain yield (GY) (GY at 12.5% grain moisture content to the above ground biomass (AGB) (seed + straw) and it is expressed in percentage. It was calculated according to the following formula (Nichiporovich, Citation1967).
where HI = harvest index, GY = grain yield (at 12.5% moisture base), and AGBY = total biomass yield (straw + grain)
Lodging index: the degree of lodging was assessed just before the time of harvest by visual observation based on the scales of 1–5 where, 1 (0–15°) indicates no lodging, 2 (15–30°) indicates 25% lodging, 3 (30–45) indicates 50% lodging, 4 (45–60°) indicates 75% lodging and 5 (60–90°) indicates 100% lodging (Donald, Citation2004). The scales were determined by the angle of inclination of the main stem from the vertical line to the base of the stem by visual observation. Each plot was divided based on the displacement of the aerial stem in to all scales by visual observation. Each scale was multiplied by the corresponding percentage given for each scale and average of the scales represents the lodging percentage of that plot. Data recorded on lodging percentage were subjected to square root transformation X = as described for percentage data by Gomez and Gomez (Citation1984). Where, X is the transformed mean and x, is the original mean.
GY: After harvesting, threshed grains were separated, cleaned, and weighed by electronic balance. The GY was corrected to moisture content of 12.5%, wet bases while moisture tester was employed for measuring the moisture content.
AGY (kg ha−1) at 12.5Grain yield obtained (kg ha−1) X
where AGY adjusted grain yield, MC = actual grain moisture content.
Straw yield (SY): SY per net plot was obtained out by subtracting total GY weight from the total biomass yield for respective treatments. Later, the SY ha−1 were computed and expressed in kg ha−1.
2.6. Data analysis
The data were subjected to combined analysis of variance (ANOVA) over years after confirmation of homogeneity of error variance using R-software. Means of significant treatment effects were separated using Tukey’s test (HSD) at 5% level of significance.
2.7. Partial budget analysis
The partial budget analysis was done as described by CIMMYT (International Maize and Wheat Improvement Center) (Citation1988). The economic advantages of applied blended NPSB and nitrogen fertilizers were carried out using partial budget analysis. In this experiment, the costs that vary were calculated by adding costs of fertilizer and labor for fertilizer application. However, other management and fixed costs were assumed to be equal for all and not included in the calculation. The costs of blended NPSB and nitrogen were 0.35 US$/kg and 0.27 US$/kg, respectively. Price of durum wheat grain was 0.43 US$/kg and the straw was 0.08 US$/kg. The average GY and SY were adjusted by 15%. Ten percent downwards to reflect the difference between the experimental yield and the farmers yield will expect from the same treatment and 5% was considered to plot size. The labor cost for Urea and blended NPSB application was estimated at 1.55 US$ man-day. Following the CIMMYT partial budget analysis methodology, total variable costs (TVC), gross benefits (GB), and net benefits (NB) were calculated. To identify treatments with maximum return to the farmer’s investment marginal analysis was performed on non-dominated treatments. For a treatment to be considered as a worthwhile option to farmers, the marginal rate of return (MRR) need to be at least between 50% and 100% (CIMMYT (International Maize and Wheat Improvement Center), Citation1988). However, other researchers suggested a MRR of 100% as realistic (Agegnehu & Fessehaie, Citation2006).
Marginal rate of return (MRR) (%): was calculated by dividing change in net benefit (ΔNB) by change in total variable cost (ΔTVC) as × 100
3. Results and discussion
3.1. Days to heading
Result of combined analysis variance over years the main effect of N fertilizer rates highly significantly affected days to heading. However, the main effects of blended NPSB as well as the interaction effect of the two factors were not significant (Table ). The result of the soil physico-chemical properties analysis ofthe expermental site is presented in Table .
Table 1. Selected physical and chemical properties of the experimental soils before sowing
Table 2. Main effects of blended NPSB and N fertilizers on days to heading and days to maturity of durum wheat
The delayed days to heading (61.50 days) was recorded in 115 kg N ha−1 which was statistically at par with the rate of 92 kg N ha−1 while the earliest days to heading (58.08 days) was recorded in the control (unfertilized) plot (Table ). As indicated in Table , increasing nitrogen fertilizer from nil to 92 kg N ha−1 delayed days’ to heading by 4.9%. Increasing the rate of nitrogen from nil to 115 kg N ha−1 further prolonged the days to heading by 5.5%. This might be due to the fact that N has promoted greater vegetative development for longer period of time before reproductive phase begins and hence might have caused delay in heading.
This result is consistent with the report of Muhammad et al. (Citation2016) who indicated that wheat plants grew under increased rates of nitrogen fertilizer supply delayed days to headings than those grew low rates of the nutrient. Similarly, Harfe (Citation2017) reported that as the N level increased from nil to 69 kg ha−1, the days to 50% heading was delayed from 67.58 to 70.04 days of bread wheat. Lack of increasing trend between blended NPSB and interaction effects of blended NPSB and nitrogen fertilizer rates could be attributed to the counteracting effects of phosphorus nutrient on N nutrient effects because N tends to increase vegetative growth, while phosphorus hastens the reproductive growth. This is in conformity with finding of Tigre et al. (Citation2014), who reported that under no phosphorus application, days to heading showed an increasing tendency with rising N rates on barley (Hordeum vulgare L.).
3.2. Days to physiological maturity
Days to physiological maturity was highly significantly influenced by the main effect of nitrogen fertilizer rates. However, neither the main effect of blended NPSB nor the interaction effect of blended NPSB and N application significantly influenced this parameter (Table ). Similar to number of days to heading, application of high rate of N delayed days to physiological maturity of durum wheat (Table ). Delay in maturity time of this crop was greater at highest rate of nitrogen than at nil rates. The two top N rates (115 and 92 kg ha−1) were at par among each other and they were significantly different from the other three lower rates of N treatments. About three more days were required for the 115 kg N ha−1 treatment when compared to the control which took (117.60 days) to maturity (Table ). Generally, number of days to maturity was delayed by about 3.06% by the application of 115 kg N ha−1 as compared to that of unfertilized plot. This may be attributed to the physiological effect of the fertilizer N which increases vegetative growth of crops where by it delays maturity time. The fact that N is important for synthesis of major macro-molecules in plants including proteins, enzymes, pigments, growth-promoting hormones, etc. which are important for maintaining and producing vegetative tissues and cell organelles which in turn contribute for the delay of maturity of plants.
In line with this result, Harfe (Citation2017) reported that the highest doses of N (69 kg ha−1) delayed physiological maturity of bread wheat by about four days (from 123.87 to 127.00 days) as compared to the control. Similarly, Tigre et al. (Citation2014) reported that the maturity time of barley was longer at higher rate (120 kg N ha−1) of nitrogen than the control (0 N). This result is in contrary to the finding of Dereje et al. (Citation2018) who reported that the shortest days (91) to physiological maturity of tef were obtained from the application of 69 kg N ha−1 and 30 kg P2O5 ha−1 and the longest days (97) from the control.
3.3. Plant height
Combined analysis of variance over the years revealed that the main effect of nitrogen fertilizer rates highly significantly affected the plant height. However, the main effect of blended NPSB as well as the interaction effect did not significantly influence this parameter (Table ). The tallest plant (90.42 cm) was obtained at the highest rate of N application (115 kg ha−1) and it was at par with plant height recorded in plants from nitrogen application at rates of 92 (89.42 cm) and 69 (89.06 cm) kg N ha−1. The shortest plant height (86.51 cm) was recorded in unfertilized plot (Table ). The application of nitrogen fertilizer at 115, 92, and 69 kg N ha−1 increased the plant height by 4.5%, 3.4%, and 2.9%, respectively, compared to the unfertilized plot. This increment in plant height might be due to the fact that N improves plant height by taking synthesis of macromolecules (proteins, enzymes, pigments, hormones, etc.) and rate of processes like photosynthesis on cell division and cell elongation, and finally internode length. Soil applied with increased rates of N, increase internodes length which ultimately resulted in increased plant height also N application enhanced the overall vegetative growth of bread wheat (Saeed et al., Citation2012).
In conformity with this result, Harfe (Citation2017) reported that the nitrogen fertilizer rate increased from nil to 69 kg ha−1, the plant height of bread wheat increased from 82.63 cm to 94.18 cm. Similar to this result, Shahraki et al. (Citation2017) reported that the plant height was significantly affected by nitrogen rate in which the tallest plant height (101.94 cm) was produced in response to applying 150 kg N ha−1, whereas the shortest (90 cm) was produced at control (unfertilized) treatment of durum wheat.
3.4. Chlorophyll content at flag leaf stage
Combined analysis of variance revealed that chlorophyll content increased to be significantly affected by only the main effect of nitrogen fertilizer rates. However, the main effect of blended NPSB as well as the interaction of the two factors was not significant (Table ).
The highest chlorophyll content mean SPAD values of 41.44% and 40.09% were obtained in the application of 115 and 92 kg N ha−1, respectively, while the lowest mean chlorophyll content (36.86%) was recorded in untreated plot (Table ). Increasing the rate of nitrogen fertilizer from nil to 92 kg N ha−1 increased the chlorophyll content by about 8.8%. Increasing the rate of nitrogen further from 92 to 115 kg N ha−1 increased the chlorophyll content by about 3.4% although the change was non-significant (Table ). This showed that supply of N at rate of 92 kg ha−1 is found to be adequate for enhancing this parameter. The result of the present study showed that nitrogen was more effectual on the chlorophyll content than other plant nutrients. The possible reason might be due to the fact that N is one of the constituent element of chlorophyll and a major component of all enzymes and hence it plays important role in chlorophyll formation, photosynthesis, chloroplast development, and respiration of plants and other biochemical and physiological activates (Zeidan et al., Citation2010).
Corroborating the result of this study, Brian et al. (Citation2007) and R. Ali et al. (Citation2008) reported significant increments in chlorophyll content at flag leaf stage in response to increasing the rate of nitrogen application, in which case they found that the highest numbers 38.31 and 35.4 SPAD in percentage were recorded for treatments that received 210 and 200 kg N ha−1, respectively. In contrast, increasing the rate of NPSB application from 0 to 150 kg ha−1 did not significantly affect the chlorophyll content of durum wheat plants which ranged from 37.50 to 39.30 SPAD in percentage, respectively (Table ). The non-responsiveness of the chlorophyll content to blended NPSB fertilizer might be due to the low amount of nitrogen in the blended NPSB fertilizer and very low total N in the experimental site.
3.5. Total tillers and productive tillers
The combined analysis of variance showed that both the main effects of blended NPSB and N fertilizer rates were highly significantly on the number of TT. The interaction effect of the two factors was also significant (Figure ).
The highest number of TT (421.0 plants m−2) was produced by plants treated with the highest rate of combined application of blended NPSB and nitrogen fertilizer rates (150/115 kg NPSB/N ha−1). However, statistically, it was not significantly different from the rates of, 150/92, 100/92, 100/115, 150/69, 50/69, and 50/92 kg NPSB/N ha−1 (Figure ). On the other hand, the lowest number of TT (153.0 plants m−2) was produced in unfertilized plot (Figure ). In general, combined application of 150 kg blended NPSB and 115 kg N ha−1 resulted in more than 2-fold increments in TT over control plot. The improvement in total number of tillers at highest rates of combined application of blended NPSB and N might be attributed to the synergetic roles of the four nutrients played in enhancing growth and development of the crop.
Phosphorus found in NPSB responsible for improved root development at early growth stage and which in turn promotes N uptake and N assimilation by growth points triggering tillers which subsequently resulted to overall plant growth and increase in TT of durum wheat. In addition, nitrogen promotes activities essential for carbohydrate utilization and its most important function in plant promotion of rapid growth through increasing total number of tillers (Saeed et al., Citation2012). In agreement with this result, Abayu (Citation2012) reported that application of blended fertilizer (69 kg N ha−1 + 46 kg P2O5 + 22 kg S ha−1 + 0.3 kg Zn ha−1) brought significant increase in TT (15 tillers per plant) of tef as compared to 5 tillers per plant of unfertilized plot.
The productive tiller (PT) was highly significantly influenced by the main effect of N and significantly by blended NPSB fertilizer rates. The interaction effect of the two fertilizers also significantly influenced this parameter (Figure ). The highest number of PT (375.7 plants m−2) was produced when the crop was fertilized by combined application of 150 kg NPSB and 92 kg N ha−1 but statistically at par with the rates of 100/92 and 150/69 kg NPSB/N ha−1. The lowest number of PT (123.3 plant m−2) was noted from control (unfertilized) plot, which was significantly different from the other rates (Figure ). Generally, the PT of durum wheat was enhanced by application of 150 kg blended NPSB with the supplement of nitrogen fertilizer up to 92 kg ha−1 but, with increasing the supply of nitrogen fertilizer beyond the rate of 92 kg N ha−1 at blended rate of 150 kg NPSB ha−1, tended to decrease the number of PT. This might be due to high number of TT which were produced in the highest (150/115 kg NPSB/N ha−1) rates of combined application of blended and nitrogen fertilizations resulting in sever competitions among the tillers causes decreasing the survival percentage of PT. Generally, treatment causing maximum TT number does not necessarily result into maximum PT number as the tiller number increased beyond certain level there is a tendency that more and more of the added tillers to be sterile.
The increased PT m−2 at 150/92 kg blended NPSB/N ha−1 fertilizers rates might be due to maximum survival percentage of tillers due to optimum supplied and availability of balanced nutrients under blended NPSB and N fertilizer condition. Botella et al. (Citation1993) reported stimulation of tillers with optimal application of N and they attributed this to the positive effect of N on cytokine synthesis which is an important hormone for cell division and shoot growth. In addition, phosphorus encourages the growth of lateral roots and fibrous rootlets that facilitate nutrient uptake (Barker & Pilbeam, Citation2007), and sulfur facilitates the uptake of other nutrients by the crop (Samuel. et al., Citation1993).
In agreement with this result, Abayu (Citation2012) reported that application of blended fertilizer brought significant difference in this parameter in tef. Similarly, Leghari et al. (Citation2016) reported that the maximum PT number (418.0 m−2) was recorded at NPK-120-60-60 kg ha−1 + B 2% of wheat crop. In contrast with the current result, Lemma (Citation2015) reported that the effect of different blended fertilizer treatments did not show significant influence on TT per plant and PT per meter square of durum wheat. This might be due to constant amount of nitrogen (76 and/or 77 kg N ha−1) in the treatment and the presence of sufficient amount (5.70 mg/kg) of available boron in the experimental site. But soil of the current study was nitrogen, sulfur and boron are deficient and substantial differences of nitrogen levels applied (0–143.35 kg ha−1) might have positive effects on PT.
Figure 2. Interaction effect of blended NPSB and N fertilizers on total tillers of durum wheat combined in 2017–2019. c–e = cde, a–d = abcd, etc.
Figure 3. Interaction effect of blended NPSB and N fertilizers on productive tillers of durum wheat combined in 2017–2019. a–d = abcd; b–d = bcd, etc.
3.6. Spike length
The main effects of blended NPSB and N fertilizer rates were significant and highly significantly, respectively, in influencing the SL of the durum wheat. The two factors also interacted to significantly influence this parameter (Figure ). The shortest SL (4.69 cm) was exhibited in control (unfertilized) treatment, whereas longest mean SL (6.67 cm) was recorded at combined application of 150/92 kg blended NPSB/N ha−1 and this was statically at par with the rates of 100/92 kg blended NPSB/N ha−1 fertilizers (Figure ). In general, combined application of blended NPSB with nitrogen fertilizers (150/92 kg ha−1) exceeded the SL by about 39.23% than that of the control (untreated) plot. The current result indicated that, SL of durum wheat increased markedly with each increase of combined application of blended NPSB and N fertilizers rates even though the results were not consistent. However, at 150 kg NPSB rate, increasing the supply of nitrogen fertilizer beyond the rate of 92 kg ha−1, tended to decrease SL. The decreasing SL with increasing supply of nitrogen fertilizer might be due to excessive application of N fertilizer causing high tissue N concentration which might have toxic effect on wheat growth resulting in stunted growth and reduced SL (Smith & Hamel, Citation1999).
The SL of durum wheat was enhanced by combined application of blended NPSB and nitrogen fertilizer at 150/92 kg NPSB/N ha−1 rates (at rate one level below the highest ones) which could be due to synergetic effect of the four nutrients and associated with the balanced nutrients availability in the rhizosphere and their potential impact on improved uptake and assimilation by the plant, resulting in increased SL (Blevins & Lukaszewski, Citation1998). The fact that nitrogen is essential for increased cell division and elongation is attributed for the nutrient’s effect in resulting improvement of vegetative growth. Sulfur is also reported to enhance the assimilation of N in crop plants (Abdin, Citation2000). Similar results were reported by Tilahun Chibsa et al. (Citation2017) in which the highest SL (5.28 cm) for durum wheat was obtained at combined application of 92/46 kg N/P2O5 ha−1. M. A. Ali et al. (Citation2013) also reported that adequate supply of boron increased SL of wheat by 29.4% as compared to the control. The result of the current study indicated that balanced and adequate soil nutrient management is one important practice for increasing durum wheat yield component which is an important yield component of durum wheat.
Figure 4. Interaction effect of blended NPSB and N fertilizers on spike length of durum wheat combined in 2017–2019. f–i = fghi; e–h = efgh, etc.
3.7. Number of kernels per spike
One of the basic yield components of wheat is the NKPS which is affected by various factors including balanced nutrition. The analysis of variance revealed that the main effect of blended NPSB was significant and the main effect of N as well as their interaction effects was highly significant in influencing the NKPS (Figure ). The highest (50.07) and the lowest (34.73) NKPS were recorded at combined application of 150/92 kg blended NPSB/N ha−1 fertilizer rates and unfertilized plot, respectively (Figure ). However, optimum kernels number per spike was observed in plots treated with combined application of 50 kg NPSB and 69 kg N ha−1. Thus, this parameter appeared to be less enhanced by these fertilizers beyond the rates of 50/69 kg NPSB/N ha−1. But adequate application of NPSB and N fertilizers supply enables the crop to make rapid growth and to intercept more solar radiation and thus to produce more NKPS. Nitrogen is essential in development of seed. The fact that phosphorus and boron are responsible for the translocation of food materials in plants therefore it play vital role in grain setting as well as in producing higher number of grains in wheat (Nadim et al., Citation2011).
Figure 5. Interaction effect of blended NPSB and N fertilizers on number of kernels per spike of durum wheat combined in 2017–2019. c–f = cdef; a–d = abcd, etc.
3.8. Aboveground biomass yield
The combined analysis of variance over years revealed that both the main effects of blended NPSB, N and the interaction effect of the two factors were highly significantly and significantly, respectively, on the aboveground dry biomass yield (Figure ). The highest total aboveground dry biomass yield (17,383 kg ha−1) was recorded from plants supplied with blended fertilizer of 150 kg NPSB ha−1 combined with 115 kg N ha−1, which was statistically at par to 100/115, 150/92, and 100/92 kg blended NPSB/N ha−1 fertilizer rates with the mean aboveground dry biomass yield of 16,049, 15,753, and 15,714 kg ha−1, respectively (Figure ). The lowest total aboveground dry biomass yield (7,025 kg ha−1) was obtained from the control (unfertilized) plot (Figure ). The total aboveground dry biomass yields obtained at these combined rates of fertilizers exceeded the lowest aboveground dry biomass yield produced by 147.4%, 128.5%, 124.2%, and 123.7%, respectively. At each blended NPSB fertilizer rate, AGBY considerably increased with the increasing supply of N fertilizer from 46 to 115 kg N ha−1. Similarly, at each N fertilizer rate except at nil N rates along 50 and 150 NPSB kg ha−1, AGBY consistently increased across blended NPSB fertilizer. The increase in biomass yield with increasing rates of blended NPSB combined with N might be due to better crop growth rate, LAI and accumulation of photo-assimilate due to maximum days to maturity by the crop, which ultimately produced more biomass yield.
Adequate supply of nitrogen leads to high photosynthetic activity, vigorous vegetative growth and dark green color and finally improves the utilization of carbohydrates. Sulfur is also reported to enhance the photosynthetic assimilation of N in crop plants (Abdin, Citation2000). While adequate supply of phosphorus increases tiller emergence especially secondary tillers and their survival, it helps in increasing the biomass yield through proper regulation of carbohydrates translocation (Prasad, Citation2017). Ample supply of boron facilitates photosynthetic activities and leaf expansion that leads into improved plant growth (Tahir et al., Citation2009). Consistent with this result, Sisay (Citation2016) reported that aboveground dry biomass yield of tef was significantly influenced by the blended fertilizers (64 kg N + 68 kg P2O5 + 14.6 kg S + 4.46 kg Zn +1.34 kg B ha−1).
Figure 6. Interaction effect of blended NPSB and N fertilizers on aboveground biomass yield (kg ha−1) of durum wheat combined in 2017–2019. g–i = ghi; e–g = efg, etc.
3.9. Thousand kernels weight
The main effect of N was significantly influenced thousand kernels weight of durum wheat. However, the main effect of blended NPSB and the two-factor interactions did not significantly influence thousand kernels weight of durum wheat (Table ). The highest thousand kernels weight (38.33 g) was recorded at application of 69 kg N followed by 92 and 46 kg N ha−1. On the other hand, the lowest thousand kernels weight (34.31 g) was observed at application of the highest rate of nitrogen (115 kg N ha−1) followed by the control (0 kg N ha−1) with the thousand kernels weight of 34.67 g, which is below the standard thousand kernels weight (35–40 g) for pasta industry (Table ). Increasing the supply of nitrogen fertilizer from nil to 69 kg N ha−1, increased thousand kernels weight. However, further increase in the application N fertilizer beyond 69 kg N ha−1, tended to decrease thousand kernels weight. In agreement with this result, Haileselassie et al. (Citation2014) reported that increasing nitrogen rate from 92 kg N ha−1 to 138 kg N ha−1 decreased thousand kernels weight of bread wheat by about 3.7%. Leta et al. (Citation2013) also reported that the thousand kernels weight of durum wheat decreased with increasing nitrogen levels. This might be due to the highest rate of nitrogen fertilization leads to higher vegetative growth but decline grain weight due to low translocation of carbohydrates to the reproductive organ. Noureldin et al. (Citation2013) concluded that the increase of nitrogen rate increase GY, biomass accumulation and decreased thousand kernels weight.
Table 3. Main effects of blended NPSB and N fertilizers on harvest index, thousand kernels weight and lodging index of durum wheat
Thousand kernels weight obtained from the 69 kg N ha−1 fertilized plot exceed thousand kernels weight obtained from the highest rate (115 kg N ha−1) by about 11.65%. This might be due to the improvement of seed quality and size due to optimum rates of nitrogen. In line with this result, Abebe and Manchore (Citation2016) reported that nitrogen applied at 69 kg ha−1 gave the highest thousand kernels weight (57.00 g) than the unfertilized plot (46.79 g) for bread wheat. Similarly, Tilahun Chibsa et al. (Citation2017) reported highest thousand kernels weight (59.99 g) at the highest nitrogen rate (92 kg ha−1) for durum wheat.
Lack of variation among treatment in response to application of blended NPSB as well as the interaction of the blended NPSB and N fertilizers on the thousand kernels weight might be due to the contribution of macro and micro nutrient like N, P, S, and B contributed to production of more NKPS hence decreases kernel size might have reduced thousand kernels weight. Thousand kernels weight is negative correlated with kernel size, as large kernels will weigh more than small kernels (Akinci et al., Citation2008).
3.10. Harvest index
HI, the ratio of grain to total biological yield, is a measure of the degree to which a crop partitions photosynthetic products into grains (Fageria, Citation2009). The main effect of N rates highly significantly influenced the HI. However, the main effect of blended NPSB and the interaction effect of blended NPSB and N factors the HI were not significant (Table ). The highest HI (47%) was obtained at the application of 46 kg N ha−1 whereas the lowest HI (32%) was produced from the application of 115 kg N ha−1 (Table ). The positive effect of nitrogen fertilizers at lower rate on HI might be attributed to the positive effect on biomass partitioning to the GY. However, increasing the supply of nitrogen fertilizer beyond the rate of 46 kg N ha−1, tended to decrease mean HI (Table ). The reduction in HI at higher rate of nitrogen might be attributed to greater vegetative biomass yield production compared to grains yield, i.e. proportionally higher vegetative biomass yield than GY at higher N rates. In line with this result, Woyema et al. (Citation2012) reported highest HI of wheat from treatment with the lowest rate of nitrogen application. It is also in agreement with the results of Marschner (Citation1995) where excess nutrient application resulted in a reduction of HI in cereal crops.
3.11. Lodging index
The main effect of the N fertilizer was highly significant on the lodging index of durum wheat. While the blended NPSB main and the two fertilizers interaction effects were non-significant (Table ). The highest lodging index (15.5%) was recorded in the treatment which received 115 kg N ha−1, whereas the lowest lodging index (0%) was noted in the control (no N received) plot (Table ). Increasing the application of N fertilizer from nil to 46 kg N ha−1 remained at par each other, did not increased the lodging index but increasing the rate of nitrogen further from 46 to 115 kg N ha−1, significantly increased lodging index. The increase in crop lodging with increased nitrogen fertilizer rate might be due to the profound effect of excessive supply of nitrogen in increasing vegetative growth thereby leading to weak stem of the plant. Heavy nitrogen application reported to reduce strength of stem base and anchorage system, stem diameter and stem wall width (Hobbs, Citation1998). As it was ascribed in plant height, nitrogen significantly increased plant height. The increase in plant height because of high N rate might expose the plants to lodging. This is in conformity with finding of Tigre et al. (Citation2014) who reported the highest lodging index (3.8%) from the plots which received the maximum nitrogen rates (120 kg N ha−1).
Lack of variation among treatments in response to application of blended NPSB as well as the interaction of the blended NPSB and N fertilizers might due to contribution of macro and micro nutrients like phosphorus, sulfur and boron on the strong morphological stand of durum wheat which reduces the percentage of lodging. Thus, application of phosphatic fertilizer may have hastened root development and prompted deeper penetration which helped in preventing lodging and was also useful in the utilization of sub-surface moisture. Likewise, boron which is necessary for cell-to-wall adhesion and the organization of the architectural integrity of the cell offered resistance to lodging (Bassil et al., Citation2004).
3.12. Grain yield
Combined analysis of variance overt three years showed that the mean GY of durum wheat was significantly influenced by the main effect blended NPSB and N fertilizer rates. The interaction effect of the two factors had also significantly influenced the GY (Figure ). The highest mean GY (5,666 kg ha−1) was obtained in response to the combined application of 150 kg blended NPSB and 92 kg N ha−1, whereas the lowest mean GY (1,960 kg ha−1) was obtained from the unfertilized plot (Figure ). However, the mean GY of durum wheat produced with combined application of the higher blended NPSB across nitrogen fertilizers rates (100/92, 100/115, and 150/115 kg blended NPSB/N ha−1) were statistically remained at par with the GY obtained from combined application of 150/92 kg NPSB/N ha−1 fertilizers (Figure ).
In general, combined application of 150 kg blended NPSB with 92 kg N ha−1 gave more than 2-fold enhancements in GY over the control plot. This yield advantage was achieved, due to the positive effect of blended NPSB and nitrogen fertilizers that had increased PT, number kernels per spike, SL, and biomass yield that cumulatively increased the GY. However, the result of the current study indicated that, the yield advantages obtained from levels of NPSB and N beyond 100 kg NPSB and 92 kg N ha−1 applications were non-significant. This showed that, supplies of blended NPSB and N at rates of 100/92 kg ha−1 are found to be adequate to produce maximum GY of durum wheat.
The results agree with the findings of Hiwot (Citation2012) which showed that application of blended fertilizer, and urea significantly increased tef GY in both Regosols and Vertisols. Similarly, Alemu (Citation2017) reported the highest GY of bread wheat (7.65 tons ha−1) from 200/92 kg ha−1 NPS/N rate and this result was statistically at par with 100/92 kg ha−1 NPS/N which gave GY of 7.58 tons ha−1.
Figure 7. Interaction effect of blended NPSB and N fertilizers on grain yield of durum wheat combined in 2017–2019. c–e = cde; b–d = bcd, etc.
3.13. Straw yield
The data reflected that the SY of durum wheat was significantly influenced by the main effects of blended NPSB and highly significantly by N fertilizers. Similarly, the interaction of blended NPSB and N was significant on the SY (Figure ). The highest SY (12,349 kg ha−1) was obtained at the application of 150/115 kg blended NPSB/N ha−1 fertilizer rates which was statistically in parity with the rates of 100/115, 150/92, and 100/92 kg blended NPSB/N ha−1. The lowest SY (4,033 kg ha−1) was noted at the application of 50/46 kg blended NPSB/N ha−1 fertilizer rates (Figure ). In general, SY obtained from the highest rates (150/115 kg blended NPSB/N ha−1) of fertilized plot exceeded the SY from the lowest rate (50/46 kg blended NPSB/N ha−1) treated plot by about 2-fold (Figure ). The significant increase in SY in response to the combined application of the highest rate as compared to the lowest rate of blended NPSB and N may be attributed to the synergetic roles of the four nutrients played in enhancing growth and development of the crop. SY is directly related with growth parameters like total number of plants, tillers per unit area and final plant height. Saeed et al. (Citation2012) also reported maximum SY (8,458 kg ha−1) at application of 140 kg N ha−1 75 kg P2O5 and 25 kg S ha−1 at different growth stages. Kebkab et al. (Citation2017) also reported increment of SY of durum wheat with increase in application of a mineral fertilizer.
Figure 8. Interaction effect of blended NPSB and N fertilizers on straw yield of durum wheat combined in 2017–2019. f–h = fgh; b–e = bcde, etc.
3.14. Partial budget analysis
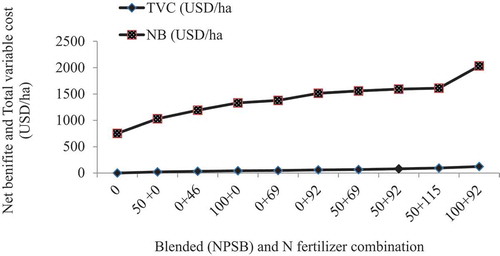
Durum wheat production under fertilizer management involved different costs, which affected the total production cost that varied within each treatment (Figure ). According to the dominance analysis on mean value 50/46, 150/0, 100/46, 0/115, 100/69, 150/46, 150/69, 100/115, 150/92, and 150/115 kg blended NPSB/N ha−1 were dominated by other treatments, hence, eliminated from further economic analysis. It is quite evident from the data presented in Figure , that the highest mean net benefit (2,032.13 US$ ha−1) with acceptable MRR (97.77%) was obtained at application of 100/92 kg blended NPSB/N ha−1 fertilizers. In contrast the lowest mean net benefit (752.33 US$ ha−1) was obtained from the control (unfertilized) plot (Figure ). Generally, this result implies that for 1.00 US$ investments in the blended and N fertilizers in durum wheat production, the producer can get extra 0.97 US$ by the application of fertilizer unto rates less than or equal to 100/92 kg blended NPSB/N ha−1 fertilizers. Therefore, on economic grounds, application of 100 kg NPSB ha−1 with supplement of 92 kg N ha−1 would be economical best rewarding for production of durum wheat in the study area.
Figure 9. Partial budget analysis.
4. Conclusion
The result of the current study indicated that balanced and adequate soil nutrient management is one important practice for increasing durum wheat yield component and yield. Combined analysis of the results revealed that chlorophyll content, days to heading, days to maturity, plant height, HI, thousand kernels weight and lodging index, were significantly affected only by the main effect of N. The NPSB and N interaction effect showed that significantly affected the highest TT, aboveground biomass, SY, were recorded at combined application of 150 blended NPSB with 115 kg N ha−1. The highest PT, SL, NKPS, and GY were obtained at combined application of 150 blended NPSB with 92 kg N. The result of economic analysis showed that combined application of 100 kg NPSB and 92 kg N ha−1 gave economic benefit. Therefore, it could be concluded that application of 100 kg blended NPSB ha−1 with supplement of 92 kg N ha−1 fertilizer rates are the fertilizer combinations and rates producing economically profitable GY of durum wheat. Thus, this rate of fertilizer would be recommended for the study area.
Additional information
Funding
Notes on contributors
Bizuwork Tafes Desta
Bizuwork Tafes Desta is an agronomy and crop physiology researcher in Ethiopia Institute of Agricultural Research at Debre Zeit Agricultural Research Center. Mine area of research interest is climate resilient agriculture such as integrated crop management practices, crop simulation model and system analysis using DSSAT and stress physiology.
References
- Abayu, B. (2012). Agronomic and economic effects of blended fertilizers under planting method on yield and yield components of tef [M.Sc. Thesis]. Mekelle University.
- Abdin, M. Z. (2000). Effect of sulfur application on lipid, RNA and fatty acid content in developing seeds of rapeseed (Brassica campestris L.). Plant Science, 150(1), 71–20. https://doi.org/10.1016/S0168-9452(99)00167-3
- Abebe, B., & Manchore, M. (2016). Effect of the rate of N fertilizer application on growth and yield of wheat (Triticum aestivum L.) at chencha, southern Ethiopia. International Journal of Plant, Animal and Environmental Science, 6(11), 2224–3186. doi:10.21276/ljpaes.
- Agegnehu, G., & Fessehaie, R. (2006). Response of faba bean to phosphate feryilizer and weed control on nitisols of Ethiopian Highlands. International Journal of Agronomy, 2, 281–290. http://doi./10.4081/ija.2006.281
- Akinci, C., Mehmet, Y., & Bahar, B. (2008). The effects of seed size on emergence and yield of durum wheat. Journal of Food, Agriculture and Environment, 6(2), 234–237. doi:10.13080/z-a.2014.101.005
- Alemu, S. (2017). Effect of NPS and N fertilizers rates on yield, yield components and grain protein contents of bread wheat at Borea District [MSc.Thesis]. Haramaya Universtity.
- Ali, M. A., Tariq, N. H., Ahmed, N., Abid, M. A., & Rahim, A. (2013). Response of wheat (Triticum aestivum L.) to soil applied Boron and Zinc fertilizers under irrigated conditions. Pakistan Journal Agricultura, 29(2), 114–125.
- Ali, R., Khan, M. J., & Khattak, R. A. (2008). Response of rice to different sources of Sulfur (S) at various levels and its residual effect on wheat in rice-wheat cropping system. Soil Environment, 27(1), 131–137.
- ATA (Agricultural Transformation Agency). (2014). ATA Woreda Master, provide as an Excel spreadsheet by ATA Last Update May 27, 2013. www.ata.gov.et
- Barker, A. V., & Pilbeam, D. J. (2007). Handbook of plant nutrition. Taylor and Francis.
- Bassil, E., Hu, H. N., & Brown, P. H. (2004). Use of phenylboronic acids to investigate boron function in plants. Possible role of boron in transvacuolar cytoplasmic strands and cell-to-wall adhesion. Plant Physiology, 136(2), 3383–3395. https://doi.org/10.1104/pp.104.040527
- Blevins, D. G., & Lukaszewski, K. M. (1998). Boron in plant structure and function. Annual reveiw. Plant physiololgy. Plant Molecular Biology, 49, 481–500. http://doi.org/101146/annurev.arplant.49.1481.
- Botella, M. A., Cerda, A. C., & Lips, S. H. (1993). Dry matter production, yield and allocation of carbon-14 assimilate by wheat as affected by nitrogen source and salinity. Agronomy Journal, 35(5), 1044–1049. https://doi.org/10.2134/agronj1993.00021962008500050016x
- Brian, N. O., Mohamed, M., & Joel, K. R. (2007). Seeding rate and nitrogen management effects on spring wheat yield and yield components. American Journal of Agronomy, 99(6), 1615–1621. https://doi.org/10.2134/agronj2007.0002
- Chaudry, E. H., Timmer, V., Javed, A. S., & Siddique, M. T. (2007). Wheat response to micronutrients in rain fed areas of Punjab. Soil and Environmental, 26(1), 97–101.
- CIMMYT (International Maize and Wheat Improvement Center). (1988). From agronomic data to farmer recommendations: An economics training manual (Completely revised ed.). Solely CIMMYT.
- CSA (Central Statistical Agency). (2018). Agricultural sample survey 2016/2017 agricultural sample survey. Agricultural sample survey, report on area and production of major crops.
- Dereje, G., Alemu, D., Adisu, T., & Anbessa, B. (2018). Response of yield and yield components of Tef [Eragrostis tef (Zucc.) Trotter] to optimum rates of nitrogen and phosphorus fertilizer rate application in Assosa Zone, Benishangul Gumuz Region. Ethiopian Journal Agricultural. Science, 28(1), 81–94.
- Diego, N., Mayanja, S., Mwanga, J., & Donovan, J. (2016). Approaches and tools for inclusive value chain development: Lessons from Uganda for improved impact. Enterprise Developmentand Microfinance, 28(4), 323–334. http://dx.doi.org./10.3362/1755-1986.00036.
- Donald, L. S. (2004). Understanding and reducing lodging in cereals. Advances in Agronomy, 84, 217–271. doi. 10.1016/S0065-213(04)84005-7.
- EthioSIS (Ethiopian Soil Information System). (2014). Soil analysis report agriculture transformation agency [Unpublished]. Ministry of Agriculture and Agriculture Transformation Agemcy.
- Fageria, N. K. (2009). The use of nutrients in crop plants. CRC Press.
- FAOSTAT (Food and Agricultural Organization of the United Nations Statistics). (2015). Food balance sheets.
- Giorgis, K. (2015). Dryland agriculture production systems in Ethiopia. National Publishers.
- Gomez, K. A., & Gomez, A. A. (1984). Statistical procedure for agricultural research with emphasis on rice (2nd ed.). Internationla Rice Research Inistitute.
- Gorfu, A., Taa, A., Tanner, D. G., & Mwangi, W. (1991). On farm research to derive fertilizer recommendations for small- scale bread wheat production: Methodological issues and technical results [Research Report No. 14]. IAR.
- Haile, W., & Boke, S. (2011). Response of Irish potato (Solanum tuberosum) to the application of potassium at acidic soils of chencha, Southern Ethiopia. International Journal of Agricultural Biology, 13, 595–598.
- Haileselassie, B., Habte, D., Haileselassie, M., & Gebremeskel, G. (2014). Effects of mineral nitrogen and phosphorus fertilizers on yield and nutrient utilization of bread wheat (Tritcum aestivum L.) on the sandy soils of Hawzen District, Northern Ethiopia. Agriculture, Forestry and Fisheries, 3(3), 189–198. doi: 10.11648/j.aff.204030.18.
- Harfe, M. (2017). Response of bread wheat (Triticum aestivum L.) varieties to N and P fertilizer rates in Ofla district, Southern Tigray, Ethiopia. African Journal of Agricultural, 12(19), 1646–1660. https://doi.org/10.5897/AJAR2015.10545
- Hiwot, L. (2012). Evaluating the effect of low seeding rate, planting method and blended fertilizer application on Eragrostis tef (Kuncho variety) yield, yield component and nutrient uptake by grain grown on Regosols and Vertisols [MSc Thesis]. Mekelle University.
- Hobbs, P. R. (1998). Wheat research needs beyond 2000 AD. Proceedings of the International Group Meeting on “Wheat Research Needs Beyond 2000 AD” Held at Directorate of Wheat Research, Karnal, India, 12–14 August.
- Kebkab, E., Dechassa, N., & Negassa, W. (2017). Effect of compost and phosphorus application on growth, yield and P-Uptake of durum wheat (Triticum Durum Desf.) on vertisol, Central Highland of Ethiopia. International Journal of Agriculture Innovations and Research, 5(4), 1469–1473.
- Leghari, G. M., Ansari, M. A., Mirjat, M. A., Laghari, U. A., & Leghari, S. J. (2016). Effect of NPK and boron on growth and yield of wheat variety TJ-83 at Tandojam soil. Advances in Environmental Biology, 10(10), 209–216. doi: 10.24247/ijasrderc201741.
- Lemma, E. (2015). Effect of blended fertilizers on yield and yield traits of durum wheat (Triticum turgidum L. Var. Durum) varieties in Ada district, Central Ethiopia [MSc. Thesis]. Hramaya University.
- Leta, G., Belay, G., & Worku, W. (2013). Nitrogen fertilization effects on grain quality of durum wheat (Triticum turgidum L.Var.Durum) varieties in Central Ethiopia. Journal of Agricultural Sciences, 1(1), 1–7.
- Marschner, H. (1995). Mineral nutrition of higher plants (2nd ed.). Academic press.
- Muhammad, Z., Ahmad, G., Iqbal, B., Khan, R. M., Bari, A., & Shah, S. (2016). Effect of fertilizer dose on the performance of spring cereals. Pure and Applied Biology, 5(3), 458–463. https://doi.org/10.19045/bspab.2016.50059
- Nadim, M. A., Awan, I. U., Baloch, M. S., Khan, E. A., Naveed, K., Khan, M. A., Zubair, M., & Hussain, N. (2011). Effect of micronutrients on the growth and yield of wheat. Pakistan Journal of Botany, 48(3), 191–196.
- Nataraja, T. H., Halepyati, A. S., Pujari, B. T., & Desai, B. K. (2006). Influence of phosphorus levels and micronutrients on physiological parameters of wheat (Triticum durum Dcsf.). Karnataka Journal Agricultural Science, 19(3), 685–687.
- Nichiporovich, A. A. (1967). Aims of research on photosynthesis of plants as factor of production. In Photosynthesis of productive system. Transl edition. Israel frog .Sci. Transl Jerusalem (pp. 3–36).
- Noureldin, N. A., Saudy, H. S., Ashmawy, F., & Saed, H. M. (2013). Grain yield response index of bread wheat cultivars as influenced by nitrogen levels. Annals of Agricultural Science, 58, 147–152. https://doi.org/10.1016/j.aoas.2013.07.012
- Prasad, S. 2017. Effect of sowing time and nutrient management on growth and yield of heat tolerant varieties of wheat [PhD. Thesis]. College of Agriculture, Jawaharlal Nehru Krishi Vishwa Vidyalaya.
- Saeed, B., Gul, H., Zaman, K. A., & Parveen, L. (2012). Growth factors and straw yield of wheat cultivars in relation with nitrogen and sulfur fertilization. Asian Research Publishing Network (ARPN). Journal of Agricultural and Biological Science, 7(1), 1103–1109.
- Samuel., T., Nelson, W. L., Beaton, J. D., & Havlin, J. L. (1993). Soil fertility and fertilizers (5th ed). MacMilln Company.
- Shahraki, H., Mobasser, H. R., & Ganjali, H. R. (2017). Effect of nitrogen fertilizer and mycorrhizal fungi on yield and yield component of wheat. International Journal of Agriculture and Biosciences, 6, 21–24.
- Sisay, A. (2016). Response of tef [Eragrostis tef (Zucc.) Trotter] to different blended fertilizer rates on Vertisols in Jama District, Northeastern Ethiopia [MSc. Thesis]. Haramaya, University Haramaya.
- Smith, D. L., & Hamel, C. (1999). Crop yield: Physiological processes. Spring Verlag.
- Tahir, M., Tanveer, A., Shah, T., HFiaz, N., & Wasaya, A. (2009). Yield response of wheat (Triticum aestivum L.) to boron application at different growth stages. Pakistan Journal Life Social Science, 7(1), 39–42.
- Tesemma, T. (1988). Durum wheat breeding in Ethiopia. In J. V. Mand & D. G. Tanner (Eds.), Fifth regional wheat work shop for Eastern, Central and Southern Africa and Indian Ocean (pp. 18–22). CIMMYT.
- Tigre, W., Worku, W., & Haile, W. (2014). Effects of nitrogen and phosphorus fertilizer levels on growth and development of barley (Hordeum vulgare L.) at Bore District, Southern Oromia, Ethiopia. American Journal of Life Sciences, 2(5), 260–266. https://doi.org/10.11648/j.ajls.20140205.12
- Tilahun Chibsa, B., Gebrekidan, H., Kibebew Kibret, T., & Tolessa Debele, D. (2017). Effect of rate and time of nitrogen fertilizer application on durum wheat (Triticum turgidum Var L. Durum) grown on Vertisols of Bale highlands, southeastern Ethiopia. American Journal of Research Communication, 5(1), 39–56.
- Wageningen, F. S. C. (2016). Wageningen University Food Security center study.Wheat competitive grant. Final report to be published by end 2016. Wagening Center for Development Innovation, Wagening Unversity.
- Woyema, A., Bultosa, G., & Taa, A. (2012). Effect of different nitrogen fertilizer rates on yield and yield related traits for seven durum wheat (Triticum turgidum L. var durum) cultivars grown at Sinana, South Eastern Ethiopia. African Journal of Food, Agriculture, nutrition and Development, 12(3), 6079-6094.
- WRB (World Reference Base). (2006). A framework for international classification, correlation and communication, world soil resource report 103 (pp. 68). Rome: FOOD AND AGRICULTURE ORGANIZATION OF THE UNITED NATIONS.
- Zeidan, M. S., Mana, F., & Hamouda, H. A. (2010). Effect of foliar fertilization of Fe, Mn and Zn on wheat yield and quality in low sandy soils fertility. World Journal Agricultural Science, 6, 696–699.