
 ?Mathematical formulae have been encoded as MathML and are displayed in this HTML version using MathJax in order to improve their display. Uncheck the box to turn MathJax off. This feature requires Javascript. Click on a formula to zoom.
Abstract
Durum wheat (2 n = 28, AABB, Triticum turgidum L. ssp. durum) is the most commonly cultivated form of allotetraploid wheat and is grown on 8% of the world’s wheat area. The trial was conducted at Dabat station of Gondar Agricultural Research Center, northern Ethiopia, with the objective of assessing the nature, extent, and patterns of genotypic and phenotypic variation in durum wheat accessions for yield, yield-related and quality traits. Sixty-four durum wheat landraces were evaluated using an 8 × 8 simple lattice design. Analysis of variance revealed the presence of highly significant (P < 0.01) variations among Accessions for all traits. The observed wide range of differences among genotypes for these main traits may be due to genetic differences of genotypes and selection can be effective for different breeding programs. High values for both heritability (85.5%) and genetic advance as percent mean (19.96) for plant height indicates better possibility and easiness for improvement of the trait through selection. Genotypic and phenotypic coefficients of variation ranged from 3.08 (days to maturity) to 12.67 (thousand seed weight) and 4.94 (days to maturity) to 18.93 (grain yield t/ha), respectively. Highly significant and positive phenotypic and genotypic correlations were observed between grain yield and biological yield (rp = 0.67, rg = 0.59), thousand seed weight (rp = 0.37, rg = 0.43) and harvest index (rp = 0.58, rg = 0.46) respectively. The highest positive and significant genotypic direct effects on grain yield were exerted by days to maturity, biological yield and harvest index, phenotypic direct effects on grain yield were via days to heading, grain-filling period, biological yield, and plant height. The highest intracluster distance was observed in cluster XI (45.27) and the lowest in cluster IV (5.66). The highest inter-cluster distance was between cluster V and VIII (996.7) followed by cluster I and XI (690.71). The first five principal components, whose eigenvalues greater than one, accounted for 81.58% of the total variation. The variability and diversity of traits, which were exhibited among the genotypes, can serve in planning selection and crossing programs for durum wheat improvement and the selection and hybridization of genotypes based on the traits with a high positive correlation coefficient and direct effects on grain yield can be recommended for further yield improvement of durum wheat.
Public Interest Statement
Durum wheat is an important staple food and providing an important source of energy. It supplies a range of vitamins, minerals, and other nutritional compounds that are essential in the human diet. It is also, an economically important crop because of its unique characteristics and an end-use product like semolina for pasta making. In Ethiopia, durum wheat is among the most important Triticum species with higher morphological variability among landraces. Knowledge of the extent and pattern of genetic diversity within and among populations is very crucial to identify useful breeding materials and design appropriate collection and conservation strategies. The presence of adequate genetic diversity and divergence among populations for some traits indicates the effectiveness of selection to improve the traits. Crosses between genetically diverse parents are likely to produce higher Heterosis, desirable genetic recombination, and segregation in progenies.
Competing Interests
The authors declare no competing interests.
1. Introduction
Durum wheat (2 n = 28, AABB, Triticum turgidum L. ssp. durum) is the most commonly cultivated form of allotetraploid wheat and is grown on 8% of the world’s wheat area (FAOStat, Citation2016). It originated in the Mediterranean region and is used to make pasta and semolina products (Ren et al., Citation2013). Approximately 75% of durum wheat is still grown in the Mediterranean basin in irrigated and rainfed environments, which contributes to 50% of the worldwide production (Kabbaj et al., Citation2017; Li et al., Citation2013).
Durum wheat landraces were specifically adapted to their region of origin, representing a diversity of agro-ecological zones, and are considered to be the most important sources of biodiversity within the species (Nazco et al., Citation2012). Landraces were largely cultivated until the first decades of the twentieth century, being progressively abandoned from the early 1970 s and replaced with improved, genetically uniform semi-dwarf cultivars as a consequence of the Green Revolution (Soriano et al., Citation2018). However, scientists believe that local landraces represent an important group of genetic resources for the improvement of commercially valuable traits (Lopes et al., Citation2015).
Ethiopia is the center of diversity for durum wheat (Wolde et al., Citation2016). It is one of the major cereal crops grown at an altitude ranging from 1500 to 3200 meters above sea level (m.a.s.). It is grown over a wide range of environments, which are different in soil fertility, the incidence of weeds, disease, pests, and waterlogged conditions (Teklu, & Hammer, Citation2009). Durum wheat research in Ethiopia started back in 1949 at the Paradiso Experimental Station near Asmara (Tesemma & Mohammed, Citation1982). Among several local durum landrace collections tested for productivity and stem and leaf rust resistance, four selections (A10, H23, P20, and R18) were developed and released to farmers in Eritrea in 1952 (Amadou et al., Citation2019).
According to the Central Statistics Agency (CSA, Citation2018), the average yield of durum wheat in Ethiopia is estimated to be 27.4 q/ha. Ethiopian farmers usually grow tetraploid wheat as a mixture of different morph types (Abebe et al., Citation2008). Variations of Ethiopian wheat landraces for morphological and cytological markers have been studied (Wolde et al., Citation2016). However, currently, this broad genetic diversity is being threatened in different ways (Bogale et al., Citation2011).
Reduction in genetic variability makes the crops increasingly vulnerable to diseases and adverse climatic changes (Aremu, Citation2012). The introduction of exotic wheat replacing the durum wheat landraces resulted in the loss of genetically diverse, locally well-adapted landraces (Royo et al., Citation2009). The research finding shows that the narrowing of the gene pool in durum wheat leads to an increased risk of vulnerability to diseases and pests (Frankel et al., Citation1995). For effective selection in durum wheat, breeders should increase their efforts to know the genetic variability and heritability of important agronomic traits (Abinasa et al., Citation2011).
Genetic potential of different genotypes available to plant breeders can be exploited only if a systematic evaluation for various traits is undertaken. Possible segregations in morphological traits are essential for genetic improvement programs and genetic diversity of durum wheat genotypes could be evaluated using morphological variation (De Vita et al., Citation2010). Description of the morphological traits has been used for genetic diversity analyses and cultivar development (Gohar et al., Citation2015).
Genetic variability among durum wheat genotypes can be estimated based on qualitative and quantitative traits. The choice of parents is of paramount importance in the breeding program. For effective selection, information on nature and magnitude of variation in the population, an association of character with yield and among themselves, and the extent of environmental influence on the expression of these characters are necessary (Yagdi, Citation2009).
However, in recent times, the research work has been focused mainly on genetic improvement of introduced wheat than indigenous durum wheat accessions. These make gradual reducing the variability of Ethiopian durum wheat landraces and farmers use available local varieties that are low yielding and susceptible to diseases due to a shortage of improved verities.
Genetic divergence arises either as a result of geographic separation or genetic barriers to crossability (Singh, Citation2002). Knowledge of the extent and pattern of genetic diversity within and between populations (accessions) is very important for the identification of useful materials for plant breeding purposes and to better understand the crop to design appropriate collection and conservation strategies. It is believed that crosses between genetically diverse parents are likely to produce higher heterosis, desirable genetic recombination, and segregation in progenies (Singh, Citation2002; Asmamaw et al., Citation2019).
Besides, knowledge of the naturally occurring diversity in a population of durum wheat landraces helps to identify diverse groups of genotypes that can be useful for the breeding program. Therefore, the present investigation was conducted with the objectives to assess the nature, extent, and patterns of genotypic and phenotypic variation in durum wheat landraces for agro-morphological and quality traits.
2. Materials and methods
2.1. Description of the study area
The experiment was conducted during the 2017/2018 cropping season at Dabat Agricultural Research Station under Gondar Agriculture Research Center (GARC). The experimental site is located at 248 km distant from Bahir Dar (the capital city of Amhara Regional State) and 809.09 km from Addis Ababa to the Northern part of the country, and 75.8 km from Gondar town. Dabat Research Station is located at “12°59′03″N latitude and “37°45′54″E longitude, with an altitude of 2607 m.a.s.l. The mean annual temperature ranges between 4.6°C and 24.5°C. Dabat has a unimodal rainfall. In addition, the mean annual rainfall for the area ranges from 1250 to 1565 mm. The rainy months extend from June to the end of September, and dominant soil in the area is Vertisol (Demelash et al., Citation2013).
3. Experimental materials
A total of 64 durum wheat landraces were used for the present experiment. These genotypes were obtained from the Ethiopian Biodiversity Institute, Addis Ababa, Ethiopia. All the genotypes were local landraces from the major durum wheat-growing regions of the country. These regions are almost all agro-ecologies/climatic zones, which means from extreme lowland 500 m.a.s.l to extreme highland l3800 m.a.s.l altitude.
4. Experimental design and procedure
The trial was laid down using an 8 × 8 simple lattice design. Each genotype was planted in a plot size of 1 m2 (2.5 m x 0.4 m). The distance between replications, blocks, and plots was 2 m, 1 m, and 0.3 m, respectively. The seeding rate was 150 kg/ha and the recommended fertilizer rate, 100 kg DAP, and 50 kg Urea were used. All DAP fertilizer was applied at planting while nitrogen fertilizer was applied in split (½ at planting, ¼ at tillering, and ¼ at head initiation) (MOARD, Citation2012). Weeding and other agronomic management practices were done as per the recommendation for durum wheat.
5. Data collection
5.1. Days to heading (days)
The number of days was recorded from the date of emergency to the stage when the spikes of 50% of the plants are fully visible (exerted). Grain-filling period (days): The grain-filling period in days was computed by subtracting the number of days to heading from the number of days to maturity. Days to physiological maturity (days): It was calculated as the number of days from emergence to 95% maturity that is the number of days to maturity minus the number of days to emergence.
5.2. Plant height (cm)
The average height of 10 plants was randomly taken from each plot at physiological maturity and measured from the ground to the tip of the panicle excluding the awns. Biological yields (t/ha): It was recorded by weighing the total above-ground yield harvested from the two rows of each experimental plot at the time of harvest.
5.3. Thousand kernels weight (gm)
The weight of one thousand randomly taken kernels from each experimental plot. Grain yield (t/ha): The grain yield per plot was measured in gram using sensitive balance after moisture of the seed is adjusted to 12.5%. The total dry weight of grains harvested from the two rows was taken as grain yield per plot and expressed as a ton per hectare for analysis. Harvest index (HI): Calculated on a plot basis, as the ratio of dried grain weight adjusted to 12.5% moisture content to the dried total above-ground biomass weight (Donald, Citation1968).
5.4. Kernels per spike
The number of kernels per spike was counted from 10 randomly taken plants and the average was worked out. Spikelet per spike: Number of spikelets per spike was counted from 10 representative spikes per plant and average was worked out. Spike length (cm): The average spike lengths of 10 plants on the main Culm from the base of the spike to the top of the last spikelet excluding awns. Protein content (percentage): was determined using Mininfra SmarT Grain Analyzer (Mininfra SmarT Grain Analyzer Operating Manual, Citation2013). Two hundred and fifty-gram sample of each genotype within replication and per plot was used for the laboratory to analyze.
6. Statistical analysis
The SAS GLM procedure (SAS, Citation2008) was employed for the analysis of variance (ANOVA). Fisher’s protected least significant difference (LSD) test at 1% or 5% level of significance was used for mean comparisons, whenever the Analysis of Variance result showed the difference. The phenotypic variance (, genotypic variances
, Phenotypic coefficient of variation (PCV), and genotypic coefficient of variation (GCV) were calculated.
Where; = Genotypic variance,
= Genotypic mean square and,
=Environmental variance
=
+
where = genotypic variance
= Environmental variance
= Phenotypic variance
Phenotypic coefficient of variation, PCV =
Genotypic coefficient of variation, GCV =
where X = grand mean
Heritability (H2) in a broad sense, Genetic Advance, and Genetic Advance as a percent of mean were calculated as H2 =
=
+
Where: = genotypic variance,
= phenotypic variance and
= environmental variance
GA = k x x H2b, and
GA (as % of the mean) = x100
where k = selection differential
=phenotypic standard deviation
H2 = heritability (Broad sense)
X = Grand mean
6.1. Estimation of phenotypic and genotypic correlations
Phenotypic and genotypic correlations between yield, yield-related and quality trait were estimated using the method hereunder
where rpxy = phenotypic correlation coefficient between character x and y
= phenotypic covariance between character x and y
Phenotypic variance for character x
= phenotypic variance for character y
Where, rgxy = genotypic correlation coefficient between character x and y
= genotypic covariance between character x and y
= genotypic variance for character x
= genotypic variance for character y
6.2. Path coefficient analysis
Path coefficient analysis was conducted using the phenotypic as well as genotypic correlation coefficients to determine the direct and indirect effects of yield components on grain yield and quality traits based on the following relationship.
rij = Pij + ƩrikPkj where
rij = Mutual association between the independent character (i) and dependent character, grain yield (j) as measured by the correlation coefficients.
Pij = Components of direct effects of the independent character (i) as measured by the path coefficients and Ʃrikpkj = summation of components of indirect of a given independent character (i) on a given dependent character (j) via all other independent characters (k). The contribution of the remaining unknown factor is measured as the residual factor (PR), which is calculated as Pr =) the magnitude of PR indicates how best the causal factors account for the variability of the dependent factor (Singh & Chaudhary, Citation1999).
7. Genetic divergence analysis
The SAS Software program computed genetic divergence analysis based on multivariate analysis using Mahalanobis’ D2 statistic (Mahalanobis, Citation1936).
Squared distances (D2) for each pair of genotype combinations computed using the following formula and analysis by JMP software.
D2ij = (Xi–Xj) S-1 (Xi—Xj)
where D2 ij = the square distance between any two genotypes i and j,
Xi and Xj = the vectors for the values for genotype ith and jth genotypes, and
S-1 = the inverse of the pooled variance-covariance matrix.
7.1. Estimation of intra- and inter-cluster square distance
Average Intra and inter-cluster D2 values were estimated using the formula ED2i/n; where ED2i is the sum of the distance between all possible combinations (n) of the genotypes included in a cluster. The significance of the squared distances for each cluster was tested against the tabulated χ2 values at p degree of freedom at a 5% probability level. Where p = number of characters used for clustering genotypes.
8. Principal component analysis
Principal component analysis (PCA) was used to find out the characters, which accounted more for the total variation. The data were standardized to mean zero and variance of one before computing principal component analysis. Principal components based on the correlation matrix were calculated using SAS computer software.
9. Results and discussions
The analysis of variance showed that there was a highly significant (p ≤0.01) difference for all traits. The significant difference among genotypes for the traits indicates that the presence of genetic variation among the genotypes which in turn suggests that selection of lines can be effective in improving both yield and quality traits. Similarly, Kumar et al. (Citation2009) and Asif et al. (Citation2004) reported that there is a considerable genetic variability existing for quantitative and qualitative traits in durum wheat. The variation observed for grain yield ranged from 7.07 to 2.92 t/ha with a mean of 4.99 t/ha.
10. Estimation of variance components
A higher magnitude of differences between phenotypic and genotypic variances was observed among the traits. The highest value of phenotypic variance was computed for biomass yield t/ha (82.43) while the lowest was for harvest index (0.01). Genotypic variances were in the ranges between (24.79) for biomass yield t/ha and (0.001) for harvest index. Generally, the values calculated for a phenotypic variance were higher than the corresponding genotypic variance for all traits. The environmental variance was also observed higher for traits such as days to maturity, plant height, and kernel per spike, biomass yield per plot, and grain yield. This indicates that there was a greater influence of environmental factors on the phenotypic expression of these traits.
Moderate (10–20) values were recorded for both genotypic coefficients of variation (GCV) and phenotypic coefficients of variation (PCV) in plant height, grain yield, harvest index, and thousand seed weight. Low values (<10) of both genotypic coefficients of variation and phenotypic coefficients of variation were obtained for traits such as days to heading, grain-filling period, and days to maturity. This indicates that the environment would have considerable influence on the phenotypic expression of these traits and practically difficult for their improvement. Early generation selection for such traits based on phenotypic evaluation of single plants and single environments might rarely be effective. Bhushan et al. (Citation2013) reported similar findings for days to heading and days to maturity and (Kumar et al., Citation2014) for days to heading.
11. Heritability and genetic advance
Low to the high magnitude of broad-sense heritability and the genetic advance was observed for different traits (Table ). Heritability in broad sense ranged from 28.64 for grain yield to 85.16% for plant height and genetic advance as percent of mean ranged from 4.14 (DM) to 22.56 (TSW). In the present study, both heritability and genetic advance as percent of mean values were high only for a thousand seed weight. This suggests that thousand seed weight is responsive for selection. Single plant selection is much effective for a trait that is highly heritable. Heritability estimates would be reliable if accompanied by a high estimate of genetic advance as percent of mean Singh and Choudhry (Citation1985). A similar result was reported by Kumar et al. (Citation2013).
Table 1. Landraces used in the study
Table 2. Mean square values of analysis of variance for yield, yield related and quality traits for 64 durum wheat genotypes
Table 3. Estimation of variance components of 12 traits for 64 durum wheat genotypes
12. Estimation of phenotypic and genotypic correlation
Phenotypic and genotypic correlation coefficients between grain yield and yield components are presented in Table . Grain yield (t/ha) had shown a highly significant and positive phenotypic and genotypic correlation with thousands of seed weight (0.37, 0.43), biomass yield t/ha (0.67, 55), and harvest index (0.58, 0.59) respectively. This result is in line with, Khan et al. (Citation2013) Grain yield had significantly positive correlations with, thousand grain weight and harvest index, and Dogan (Citation2009) positive and significant correlations were determined between thousand grain weight—an important trait—and grain yield. Grain yield t/ha was positively correlated with spike length at the phenotypic level, but it had a non-significant correlation at the genotypic level with this trait. Similarly, Bilgin et al. (Citation2011) and Ali et al. (Citation2008) reported the positive phenotypic and genotypic correlation between grain yield and spike length in durum wheat. Most of the traits that are showed highly positive genotypically and phenotypically association with grain yield, because these traits are the most yield-contributing traits and indicating a direct effect on grain yield.
Table 4. Genotypic above diagonal and phenotypic below diagonal correlation coefficients of 12 yield, yield-related and quality traits in durum wheat genotypes
13. Path coefficient analysis
13.1. Phenotypic direct and indirect effects of various traits on grain yield
The relationship between yield, yield-contributing characters, and quality trait through phenotypic path coefficients showed that days to heading, plant height, biological yield, harvest index, and protein content exerts positive direct effects on grain yield with the range of 0.02 for protein content to 0.82 for days to heading (Table ). High values of direct effects suggest that the true relationship and direct selection for these traits may also increase and give better response for improvement of grain yield and can be major selection criteria in durum wheat breeding programs. Ali (Citation2012) also reported a higher positive direct effect of harvest index on grain yield followed by the positive direct effect of the biomass yield, resulting from the high positive correlation between them.
Table 5. Phenotypic path coefficient of direct (main diagonal) and indirect effects of six durum wheat genotype traits
On the other hand, the negative and unfavorable direct effect on grain yield was exhibited through only a thousand seed weight −0.02. The negative direct effects on grain yield would indicate that the selection for these traits would not be rewarding for yield improvement. Days to heading put higher negative indirect effects on grain yield via harvest index and thousand seed weight and positive indirect effects via plant height, biological yield, and protein content. Genetic improvement in grain yield can be accelerated if yield-contributing traits are used as selection criteria. For this purpose, it is necessary not only to identify indirect linkage to gain yield potential but also to improve the understanding of the genetic bases controlling this trait for easy handling (García et al., Citation2011).
Plant height exerted positive indirect effects on grain yield through days to heading, biological yield, and thousand seed weight. Plant height is one of the plant growth attributes which determines the final grain yield in durum wheat. A negative indirect effect of plant height on grain yield was observed through harvest index and protein content, however, they cannot be generalized as traits for indirect selection for higher grain yield improvement.
Indirect and positive effects on grain yield through biomass per plot were exhibited via days to heading, plant height, and thousand seed weight. Similar findings also reported Kumar et al. (Citation2013), while negative indirect effects on grain yield via harvest index and protein content. The result of the path coefficient analysis revealed that thousand kernels weight exerts positive indirect effects on grain yield through days to heading only and negative indirect effects on grain yield via harvest index.
13.2. Genotypic direct and indirect effects of various traits on grain yield
Genotypic path coefficient induces that plant height, biological yield, and harvest index exert positive genotypic direct effects on grain yield. The genotypic direct effects of these traits ranged between 0.01 for plant height and 0.88 for harvest index (Table ). The direct positive effects of these traits on grain yield indicate direct selection based on these traits can be effective via yield and its components for more efficiency during selection.
Table 6. Genotypic path coefficient of direct (main diagonal) and indirect effects of seven durum wheat genotype traits
Genotypic negative direct effects of traits on grain yield were in the range between −2.00 for grain-filling period and −2.63 for days to heading (Table ). Days to heading and grain-filling period contributed negative direct effects for grain yield. The direct negative effects of these traits seemed to be emphasized because; the effects of these traits were towards declining grain yield. Information on these traits would be very useful in clarifying the effects of yield components and the related traits on grain yield, which were not accurately reflected in simple correlation analysis, thus provides helpful information for durum wheat breeders. Abinasa et al. (Citation2011) reported the negative genotypic direct effects.
The indirect effects of days to heading on grain yield via grain-filling period, harvest index, and thousand seed weight were positive. However, the negative indirect effects of days to heading on grain yield were exerted through plant height, biological yield, and protein content. Positive and indirect effects of grain-filling period on grain yield were exhibited via days to heading and protein content. Unfavorable and negative indirect effects of grain-filling period on grain yield were through plant height, biological yield, harvest index, and thousand kernels weight. The genotypic positive indirect effects of the phonological traits on grain yield would provide a better means of increasing grain yield and clarify their true relationship Khan et al. (Citation2013).
Biomass yield per plot exhibited a positive and significant indirect effect on grain yield via days to heading, grain-filling period, plant height. Positive values indirect effects through biological yield on grain yield came from positive association of this trait to grain yield and suggested that the importance of the indirect selection of biological yield for increasing grain yield Fellahi et al. (Citation2013). Positive and significant indirect effects of harvest index on grain yield were exhibited through the grain-filling period and thousand kernels weights. The positive indirect effects of these traits on grain yield can be considered as causes of such high correlation and signify the importance of harvest index for indirect selection for grain yield improvement. However, negative indirect effects, of harvest index were exhibited via days to heading, plant height biological yield, and protein content.
13.3. Cluster analysis of durum wheat genotypes
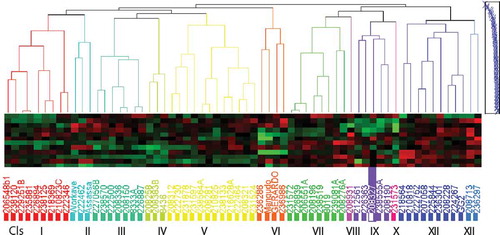
Based on cluster analysis, the 64 durum wheat genotypes were grouped into 12 genetically distinct clusters, 10 of them are real clusters (I, II, III, IV, V, VI, VII, IX, XI, and XII) and the remaining two are singletons (VIII and X) (Table ). Cluster-V consisted of a maximum of 12 genotypes. This followed by cluster-I and cluster-XI with nine genotypes each. Cluster-VIII and cluster-X had the least number of genotypes one each. This indicates that crossing between superior genotypes of the above divers cluster pairs might provide desirable recombinants for developing high yielding durum wheat varieties. Similar works were reported by Verma et al. (Citation2013) who grouped 108 genotypes of wheat into 11 clusters, Mostafa et al. (Citation2011) who grouped 38 genotypes of wheat into seven clusters, Tsegaye Dawit et al. (Citation2012) who grouped 21 exotic and two standard check varieties of durum wheat into six clusters.
Table 7. Distribution of 64 durum wheat genotypes into 12 clusters based on D2 analysis
13.4. Average intra and inter-cluster distance (D2)
Intra and inter-cluster D2 values among the 12 clusters are presented in (Table ). The magnitude of intracluster distances indicates the extent of genetic diversity among genotypes of the same cluster. The intracluster distance varied from 5.66 to 45.27 with the maximum distance in cluster XI and the minimum in cluster IV suggests the close relationship of individual genotypes within a cluster.
Table 8. Average intra (main diagonal) and inter-cluster (off-diagonal) D2 values of 12 clusters in 64 durum genotypes
The range of inter-cluster distance of genotypes ranged from 23.62 to 996.7. The maximum inter-cluster distance was between cluster V and VIII (996.7) followed by cluster I and XI (690.71). This indicates crossing among these clusters provides high and potential heterotic groups. The minimum inter-cluster distance observed between cluster IV and V (23.62) was genetic proximity between clusters. Thus, the crossing of genotypes from these two clusters may not produce high heterotic values in the FI’s and broad spectrum of variability in segregating (F2) populations.
Parents for hybridization could be selected on the bases of large inter-cluster distance for isolating useful recombinants in the segregating generation (Diers et al., Citation1996). Increasing parental distance implies a greater number of constraining alleles at desired loci, and then to the extent that these loci recombine in the F2 and F3 generations following a cross of distantly related parents, the greater will be the opportunities for successful selection for any character (Arega et al., Citation2007).
Thus, lines from different clusters should be chosen for crossing in durum wheat breeding programs. Generally, these genotypes of durum wheat in this study exhibited highly divergent variability among them. Similar results were reported by Singh and Upadhyay (Citation2013) maximum inter-cluster distance exhibited a high degree of genetic diversity and thus may be utilized under inter varietal hybridization program.
According to Rahim et al. (Citation2010) who pointed out those hybrids of genotypes with maximum distance resulted in high yield; the cross between these genotypes can be used in breeding programs to achieve maximum heterotic value/effect. The average inter-cluster distances were high than the average intra-cluster distances (Table ), which indicates the presence of wide genetic diversity among the genotypes of different clusters than those of the same cluster.
Figure 1. Dendrogram of 64 durum wheat landraces used in the study.
13.5. Cluster mean analysis
The mean values of the traits for each cluster are presented in Table . Cluster XII had relatively higher grain yield, longest days to heading, highest plant height, a large number of spikelets per spike, highest spike length, highest biological yield, and highest thousand kernel weight, which has medium grain-filling period, medium days to maturity, medium thousand seed weight, and an acceptable range of grain protein content. Cluster VIII had the longest grain-filling period and days to maturity, the large number of spikelets per spike followed by cluster XII, long spike length, highest biological yield and highest grain protein content, and which had medium values for other characters.
Table 9. Mean values of the character in the clustering of genotypes
Cluster X was characterized by having the lowest grain-filling period, lowest, kernel per spike, the lowest grain yield, lowest harvest index, and lowest thousand kernel weight but had the highest protein content. Early maturing genotypes were observed in cluster III, whereas genotypes having highest kernel per spike and spikelet per spike in cluster II and VII, genotypes with high grain yield and harvest index were grouped in cluster II, genotypes having with low spike length and low biological yield, but high harvest index was observed in cluster VI.
13.6. Principal component analysis
In the present investigation, only the first five principal components with Eigenvalues greater than one were used and cumulatively they explained 81.58% variability (Table ). The first PC1 explained 25.26%, PC2 showed 21.42%, PC3 had 15.21%, PC4 and PC5 exhibit 10.99%, & 8.7%, respectively. Leilah and Al-Khateeb (Citation2005) reported that the first two principal components PC1 and PC2 account for the maximum variability in the data with respect to succeeding components.
Table 10. Eigenvalues and Eigenvectors of the five principal components (PCs) for 12 characters of durum wheat genotypes
The character contributing the maximum to the divergence should be given greater emphasis for deciding the type of cluster for purpose of further selection and the choice of parents in hybridization (Jagadev et al., Citation1991). Differentiation of the accession into different clusters provides the cumulative effect of a number of characters rather than the contribution of specific few characters.
The first principal component (PC1) was mostly influenced by days to heading, days to maturity, plant height, and kernel per spike and spikelet per spike. The most effective characters in the second principal component (PC2) were grain yield t/ha, thousand seed weight, harvest index, grain-filling period, and protein content. The third principal component (PC3) exhibited a high contribution to the total variation with kernel per spike, days to maturity, biological yield, and spikelet per spike. The fourth principal component (PC4) mostly affected by grain-filling period, spikelet per spike, thousand seed weight, and protein content. The last and the fifth principal component analysis (PC5) showed great variations on protein content, grain-filling period, and days to heading.
The present study showed that durum wheat landraces had significant variations for the character understudy and it suggests that many opportunities exist for genetic improvement through selection and conservation of accessions for future utilization. Similar works have been reported grouping wheat based on principal component analysis (Saif et al., Citation2013; Ashraf et al., Citation2012; Dutamo et al., Citation2015).
14. Conclusions and recommendations
The present study showed that the presence of considerable genetic variation among durum wheat landraces for all trits tested which gives an opportunity to plant breeders for selection and improvement of these trits. Highly heritable and easily measurable traits could be used for rapid screening for large volumes of planting materials for the trait of interest.
Genotypic correlation coefficient analysis indicated that important agronomic traits are positively correlated with grain yield. This indicated that a common or physiological basis among these traits and improvement of these traits easily would be possible. The biomass yield and harvest index showed a significant positive correlation with grain yield. This is considered as, suitable selection criteria for the development of high yielding durum wheat varieties.
Clustering was made to categorize quantitative traits into components for the sake of understanding the share components that contribute to major variations in the study. The highest inter-cluster distance was exhibited between cluster V and VIII (996.70) followed by cluster I and XI (690.71), indicates wider genetic among the landraces found in these clusters.
Whereas the shortest squared distance was observed between cluster IV and V (23.62), the cross between the landraces selected from cluster V with cluster VIII is expected to produce better genetic recombination and segregation in their progenies. Therefore, these durum wheat landraces need to be crossed and selected to develop high yielding varieties.
The principal component analysis revealed that principal components PC1, PC2, PC3, PC4, and PC5 accounted for 81.59% of the total variations. This result further confirmed the presence of ample genetic diversity for use in the durum wheat improvement program.
Hence, the selection and hybridization of genotypes based on the traits with a high positive correlation coefficient and direct effects on grain yield can be recommended for further yield improvement of durum wheat at respective locations.
Cover Image
Source: Author.
Additional information
Funding
Notes on contributors
Yohannes Azene Alemu
Yohannes Azene Alemu is a Plant Breeding and Genetics researcher in Gondar Agricultural Research Center under Amhara Regional Agricultural Research Institute. His area of interest is climate-smart agriculture especially in cereal crops on releasing of new improved crop varieties which are high yielders, disease resistance, and wide adaptable using conventional and molecular breeding approaches like, marker-assisted selection, QTL mapping, stress breeding, targeted crossing, transgenic breeding, and tissue culture.
References
- Abebe, W., Bultos, G., & Lemmesa, F. (2008). Physiological properties of six Ethiopian durum wheat (Triticumturgidum L.) varieties grown at Debre Zeit suitable for pasta making. Journal of Food Sciences and Technology, 45(3), 237–21. https://www.researchgate.net/publication/264852047
- Abinasa, M., Ayana, A., & Bultosa, G. (2011). Genetic variability, heritability and trait associations in durum wheat (Triticum turgidum L. var. durum) genotypes. African Journal of Agricultural Research, 6(17), 3972–3979. https://doi.org/10.5897/AJAR10.880
- Ali, I. H. (2012). Heritability, variability, genetic correlation and path analysis for quantitative traits in durum and bread wheat under dry farming conditions. Mesopotamia Journal of Agriculture, 40(4), 27–39. https://doi.org/10.33899/magrj.2012.59640
- Ali, Y., Atta, B. M., Akhter, J., Monneveux, P., & Lateef, Z. (2008). Genetic variability, association and diversity studies in wheat (Triticum aestivum L.) germplasm. Pakistan Journal of Botany, 40(5), 2087–2097.
- Amadou, T. S., Tiberio, C., Legesse, W., Seid-Ahmed, K., Rodomiro, O., Maarten, V. G., & Filippo, M. (2019). Durum wheat (Triticum durum desf.): Origin, cultivation and potential expansion in sub-Saharan Africa. Journal of Agronomy, 9(5), 263. https://doi.org/10.3390/agronomy9050263
- Arega, G., Mohammed, H., & Singh, H. (2007). Selection criterion for improved grain yields in Ethiopian durum wheat genotypes. African Crop Science Journal, 15(1), 25–31.
- Aremu, C. O. (2012). Exploring statistical tools in measuring genetic diversity for crop improvement. Genetic diversity in plants, 340-348.
- Ashraf, A., Abd, E. I., Mohsen, S. R., Abo, H., & Taha, M. H. (2012). Genotypic and phenotypic interrelationships among yield and yield components in Egyptian bread wheat genotypes. Journal of Plant Breeding and Crop Science, 4(1), 9–16. https://doi.org/10.5897/JPBCS11.084
- Asif, M., Mujahid, M. Y., Kisana, N. S., Mustafa, S. Z., & Ahmad, I. (2004). Heritability, genetic variability and path coefficient of some traits in spring wheat. Sarhad Journal of Agriculture, 20(1), 87–91.
- Asmamaw, M., Keneni, G., & Tesfaye, K. (2019). Genetic diversity of ethiopian durum wheat (triticum durum desf.) Landrace collections as reveled by SSR markers. Advances in Crop Science and Technology, 7(1), 413. https://doi.org/10.4172/2329-8863.1000413
- Bhushan, B., Bharti, S., Ojha, A., Pandey, M., Gourav, S. S., Tyagi, B. S., & Singh, G. (2013). Genetic variability, correlation coefficient and path analysis of some quantitative traits in bread wheat. Journal of Wheat Research, 5(1), 21–26.
- Bilgin, O., Korkut, K. Z., Baser, I., Daglioglu, O., Ozturk, I., Kahraman, T., & Balkan, A. (2011). Genetic Variation and Inter-relationship of Some Morpho-physiological taits in 57 Durum Wheat (Triticum durum (L.) Desf.). Pakistan Journal of Biotechnology, 43(1),253-260.
- Bogale, A., Tesfaye, K., & Geleto, T. (2011). Morphological and physiological attributes associated to drought tolerance of Ethiopian durum wheat genotypes under water deficit condition. Journal of Biodiversity and Environmental Sciences, 1(2), 22–36.
- CSA. (2018). Report on Farm Management Practices (Private Peasant Holdings, Meher Season), Volume XII, Addis Ababa, Ethiopia.
- Dawit, T., Tadesse, D., Yigzaw, D., & Getnet, S. (2012). Analysis of genetic diversity in some durum wheat (Triticum durum. Desf) genotypes grown in Ethiopia. African Journal of Biotechnology, 11(40), 9606–9611. https://doi.org/10.5897/AJB11.4310
- De Vita, P., Mastrangelo, A. M., Matteu, L., Mazzucotelli, E., Virzi, N., Palumbo, M., Storto, L., Rizza, F., & Cattivelli, L. (2010). Genetic improvement effects on yield stability in durum wheat genotypes grown in Italy. Field Crops Research, 119(1), 68–77. https://doi.org/10.1016/j.fcr.2010.06.016
- Demelash, N., Lakew, M., Tesfaye, S., Ayalew, B., Adane, M., & Worku, T. 2013. Breed wheat evaluation and application NP fertilizer at Dabat district north gonder. ‘’Pre”of the 7th & 8th annual regional ‘’conf”on completed research activities soil and water management research, 25-31, January 2013. Pp: 1–2.
- Diers, B. W., McVetty, P. B. E., & Osborn, T. C. (1996). Relationship between heterosis and genetic distance based on restriction fragment length polymorphism markers in oilseed rape (Brassica napus L.). Crop Science, 36(1), 79–83. https://doi.org/10.2135/cropsci1996.0011183X003600010014x
- Dogan, R. (2009). The correlation and path coefficient analysis for yield and some yield components of durum wheat (Triticum turgidum var. durum L.) in west Anatolia conditions. Pakistan Journal of Botany, 41(3), 1081 1089.
- Donald, C. M. (1968). The breeding of crop ideotypes. Euphytica, 17(3), 385–403. https://doi.org/10.1007/BF00056241
- Dutamo, D., Alamerew, S., Eticha,and, F., & Assefa, E. (2015). Genetic variability in bread wheat (Triticum aestivum L.) germplasm for yield and yield component Traits. Journal of Biology, Agriculture and Healthcare, 5(17), 140–147.
- FAOStat. (2016). Food and agricultural organization of the United Nations, statistics division. Production/Crops/World.
- Fellahi, Z., Hannachi, A., Bouzerzour, H., & Boutekrabt, A. (2013). Correlation between traits and path analysis coefficient for grain yield and other quantitative traits in bread wheat under semi-arid conditions. Journal of Agriculture and Sustainability, 3(1), 16–26.
- Frankel, O. H., Brown, A. H., & Burdon, J. J. (1995). The conservation of plant biodiversity. Cambridge University Press.
- García, G. A., Serrago, R. A., Appendino, M. L., Lombardo, L. A., Vanzetti, L. S., Helguera, M., & Miralles, D. J. (2011). Variability of duration of pre-anthesis phases as a strategy for increasing wheat grain yield. Field Crops Research, 124(3), 408–416. https://doi.org/10.1016/j.fcr.2011.07.006
- Gohar, A., Naser, S., Rahmatollah, K., & Fariborz, S. (2015). Phenotypic divergence for morphological and yield-related traits among some genotypes of durum wheat under drought stress and non-stress conditions. Journal of Agricultural Science, 60(2), 119–133. https://doi.org/10.2298/JAS1502119
- Jagadev, P. N., Samal, K. M., & Lenka, D. (1991). Genetic divergence in rape mustard. The Indian Journal of Genetics and Plant Breeding, 51(4), 465–467.
- Kabbaj, H., Sall, A. T., Al-Abdallat, A., Geleta, M., Amri, A., Filali-Maltouf, A., Belkadi, B., Ortiz, R., & Bassi, F. M. (2017). Genetic diversity within a global panel of durum wheat (Triticum durum) landraces and modern germplasm reveals the history of alleles exchange. Frontiers in Plant Science, 8, 1277. https://doi.org/10.3389/fpls.2017.01277
- Khan, M. A., Mohammad, F., Malik, T., Khan, A., & Abbas, S. J. (2013). Genetic divergence in f4: 6wheat lines for yield and its contributing traits. Journal of Plant Breeding and Genetics, 1(3), 169–175. http://www.escijournals.net/JPBG
- Kumar, B., Ruchi, G. M. L., & Upadhyay, A. (2009). Genetic variability, diversity and association of quantitative traits with grain yield in bread wheat (Triticum aestivum L.). Asian Journal of Agricultural Sciences, 1(1), 4–6.
- Kumar, B., Singh, C. M., & Jaiswal, K. K. (2013). Genetic variability, association and diversity studies in bread wheat (Triticum aestivum L.). The Bioscan, 8(1), 143–147.
- Kumar, N., Markar, S., & Kumar, V. (2014). Studies on heritability and genetic advance estimates in timely sown bread wheat (Triticum aestivum L.). Bioscience Discovery, 5(1), 64–69.
- Leilah, A. A., & Al-Khateeb, S. A. (2005). Statistical analysis of wheat yield under drought conditions. Journal of Arid Environments, 61(3), 483–496. https://doi.org/10.1016/j.jaridenv.2004.10.011
- Li, Y.-F., Wu, Y., Hernandez-Espinosa, N., & Peña, R. J. (2013). Heat and drought stress on durum wheat: Responses of genotypes, yield, and quality parameters. Journal of Cereal Science, 57(3), 398–404. https://doi.org/10.1016/j.jcs.2013.01.005
- Lopes, M. S., El-Basyoni, I., Baenziger, S., Singh, S., Royo, C., Ozbek, K., Aktas, H., Ozer, E., Ozdemir, F., Manickavelu, A., Ban, T., & Vikram, P. (2015). Exploiting genetic diversity from landraces in wheat breeding for adaptation to climate change. Journal of Experimental Botany, 66(12), 3477–3486. https://doi.org/10.1093/jxb/erv122
- Mahalanobis, P. C. (1936). On the generalized distance in statistics. Proceedings of the Indian National Science Academy, 2, 49–55.
- Mininfra, S. T. 2013. Grain analyzer operating manual, Version 1.3. infracontKft www.infracont.hu.
- MOARD (Ministry of Agriculture and Rural development). (2012). Crop variety register. Issue No. 12.
- Mostafa, K., Mohammad, H. F., & Mohammad, M. (2011). Genetic diversity of wheat (Triticum aestivum L.) genotypes based on cluster and principal component analyses for breeding strategies. Australian Journal of Crop Science, 5(1), 17–24.
- Nazco, R., Villegas, D., Ammar, K., Peña, R. J., Moragues, M., & Royo, C. (2012). Can Mediterranean durum wheat landraces contribute to improved grain quality attributes in modern cultivars? Euphytica, 185(1), 1–17. https://doi.org/10.1007/s10681-011-0588-6
- Rahim, M. A., Mia, A. A., Mahmud, F., Zeba, N., & Afrin, K. S. (2010). Genetic variability, character association and genetic divergence in mung bean (‘Vigna radiata’L.). Plant Omics, 3(1), 1–6.
- Ren, J., Sun, D., Chen, L., You, F. M., Wang, J., Peng, Y., Nevo, E., Sun, D., Luo, M.-C., & Peng, J. (2013). Genetic diversity revealed by single nucleotide polymorphism markers in a worldwide germplasm collection of durum wheat. International Journal of Molecular Sciences, 14(4), 7061–7088. https://doi.org/10.3390/ijms14047061
- Royo, C., Elias, E. M., & Manthey, F. A. (2009). Durum wheat breeding. In M. J. Carena (Ed.), Cereals (pp. 199–226). Springer.
- Saif, U. A., Nasir, M. M., Anber, H., Ammara, S., Muhammad, Z., & Zaheer, A. (2013). Multivariate analysis of genetic divergence in wheat (Triticum aestivum) germplasm. Pakistan Journal of Botany, 45(5), 1643–1648.
- SAS. (2008). Statistical analysis system. Version 9.2.
- Singh, B., & Upadhyay, P. K. (2013). Genetic variability, correlation and path analysis in wheat (Triticum aestivum L.). Indian Research Journal of Genetics and Biotechnology, 5(3), 197–202.
- Singh, B. D. (2002). Plant breeding: Principles and methods. Kalyani.
- Singh, R. K., & Chaudhary, B. D. (1999). Biometrical methods in quantitative genetics analysis Kalyani publishers.
- Singh, R. K., & Choudhury, B. D. (1985). The biometrical method in quantitative genetic analysis. pp. 54-57. Ludhiana, New Delhi: Kalyani Publishers.
- Soriano, J. M., Villegas, D., Sorrells, M. E., & Royo, C. (2018). Durum wheat landraces from east and west regions of the Mediterranean basin are genetically distinct for yield components and phenology. Frontiers in Plant Science, 9, 80. https://doi.org/10.3389/fpls.2018.00080
- Teklu, Y., & Hammer, K. (2009). Diversity of Ethiopian tetraploid wheat germplasm: breeding opportunities for improving grain yield potential and quality traits. Plant Genetic Resources, 7(1),1-8. https://doi.org/10.1017/S1479262108994223
- Tesemma, T., & Mohammed, J. (1982). Review of wheat breeding in Ethiopia. Ethiopian Journal of Agricultural Sciences, 1, 11–24.
- Verma, P. N., Singh, B. N., & Yadav, R. K. (2013). Genetic variability and divergence analysis of yield and its contributing traits under sodic soil condition in wheat (T. aestivum L.). International Journal of AgriculturalSciences, 3(2), 395–399.
- Wolde, T., Eticha, F., Alamerew, S., Assefa, E., & Dutamo., D. (2016). Genetic variability, heritability and genetic advance for yield and yield related traits in Durum wheat (Triticum durum L.) accessions. Sky Journal of Agricultural Research, 5(3), 042–047.
- Yagdi, K. L. (2009). Path coefficient analysis of some yield components in durum wheat (Triticum durum. Desf.). Pakistan Journal of Botany, 41(2), 745–751.