
 ?Mathematical formulae have been encoded as MathML and are displayed in this HTML version using MathJax in order to improve their display. Uncheck the box to turn MathJax off. This feature requires Javascript. Click on a formula to zoom.
Abstract
Banana is produced by the highest number of farmers in Bench Maji and Sheka zones of the Southern region of Ethiopia. Even though the zones have high banana production potential, several constraints hamper the development of the banana sector along with the value chain. Therefore, this study was intended to analyze banana value chain in these zones of Ethiopia. Data from 180 banana producers were collected and analyzed by using descriptive statistics, marketing margin and econometric Heckman two-stage model. The result showed there is a weak relationship between banana value chain actors. The marketing margin result showed that collectors from the traders’ side received the highest profit share in the banana value chain. The econometric regression result showed that extension contact, type of varieties utilized, the area allocated for banana production, distance to the nearest market, total income and education level are significantly determining factors of banana market participation. In addition, lack of an organized market, low demand during the production season, expensiveness of improved varieties and disease were top identified problems by banana producers. Thus, the concerned stakeholders and government need to give attention to increasing improved banana varieties access and improving the technical knowledge of banana producers on using best practices by arranging cross visits and field trips to areas with best banana production practice. In addition, the promotion of value addition practices and the establishment of banana cooperatives to overcome the marketing problem are also suggested.
PUBLIC INTEREST STATEMENT
Among the fruits, banana production is currently used as alternative means of livelihood for households in Bench Maji and Sheka zones. Nevertheless, the banana producers are not decision-makers concerning selling price. As a result, traders share the highest margin of the final banana consumer price. This may be due to weak market actors’ relationship, disease problem and low demand in peak production season and low culture of value ripping of the banana. Increased integration of all actors could be essential to overcome factors influencing the banana value chain through dissemination of improved banana varieties and agronomic practices, promotion of value addition practicing and establishments of banana cooperatives.
Competing Interests
The authors declares no competing interests.
1. Introduction
Fruit production in Ethiopia plays a significant role in the local economy as a means of earning livelihoods for nearly five million farmers, creating jobs and generating foreign exchange revenues (FAO (Food and Agriculture Organization), Citation2012). This agricultural subsector is one of the priority strategic sectors recognized by the Government of Ethiopian (GOE) for its potential for private sector investments and exports (Mafa et al., Citation2015). Consequently, the GOE’s Second Growth and Transformation Plan (covering 2015–2020) provided a greater emphasis aimed at increasing production of fruit crops nearly by 50% from the existing. Production is thus projected to reach approximately one million metric tons by the end of 2020 (NPC (National Planning Commission), Citation2016).
Presently, avocado, mango, orange, banana and papaya are the major types of fruits that are grown in the country (Teklay et al., Citation2016). Though the country has available land and water resources that offer high potential fruit production, the production of such fruits is very fragmented and uncoordinated (Sena, Citation2019; Zenebe et al., Citation2015). Of the fruits, banana covers about 56.79% of the total fruit area in Ethiopia; in terms of production volume, on average about half million ton of banana was produced per year in Ethiopia (CSA (The Federal Democratic Republic of Ethiopia Central Statistical Agency), Citation2018). Based on the level of banana production, Southern Nations, Nationalities and Peoples Region (SNNPR) ranks first followed by Oromiya, Amhara and Benishangul-Gumuz in Ethiopia (CSA (The Federal Democratic Republic of Ethiopia Central Statistical Agency), Citation2018). Due to its diverse and suitable agro-ecology for banana growing, Gamo, Kembata Tembaro, Benchi Maji and Sheka zones are the major banana production areas in SNNPR ((Daniel, Citation1999; Natnael, Citation2016; Tekle et al., Citation2014; Zinabu et al., Citation2019).
Banana is produced by the highest number of farmers in Bench-Maji and Sheka zones next to the Gamo (former Gamo Gofa) zone in SNNPR (CSA (The Federal Democratic Republic of Ethiopia Central Statistical Agency), Citation2017). Yet the zones have huge potential for banana production, banana production these zones is mainly for domestic production and under very traditional systems as a garden crop (Benyam & Abatneh, Citation2019). In addition to existing traditional production, harvesting and postharvest techniques do not attract the local market, resulting in the lowest share of producing farmers from the final selling price of banana (Getahun et al., Citation2017a). Due to the significant role of traders and transporters in linking the markets in the production areas to the terminal market, the marketing activities of producers is limited to wait for the purchaser at the production site (Dawit & Asmare, Citation2008). Moreover, the current marketing system of banana in the Bench Maji and Sheka zones are not strong enough to compete with national level banana marketing to benefit the banana producers in the zones (Benyam & Abatneh, Citation2019). Hence, smallholder banana producers in these zones lose out of higher product prices due to poor organization linkage, unequitable access to markets and lack of safeguard mechanisms to shelter them from market shocks.
On the other hand, different studies appealed that Ethiopia has ample potential for banana production (Alemu, Citation2017; Amen & Desalegn, Citation2018; Benyam & Abatneh, Citation2019; Berhe et al., Citation2010; Natnael, Citation2016; Teklay et al., Citation2016; Zenebe et al., Citation2015). Still, this potential has not been adequately tapped yet due to different production and market related problems. For example, studies by Getachew et al. (Citation2018a), Zenebe et al. (Citation2015), Natnael (Citation2016), and Zinabu et al. (Citation2019) indicated that shortage of improved varieties, pests and diseases, producers dependence on local varieties for many years, poor agronomic practices, poor postharvest management, poor market information system; and little research support to increase yields are among major constraints hampering banana value chain in Ethiopia. However, none of the above studies were captured the Bench Maji and Sheka zones based on value chain approach even if the production of banana is below the expected potentials in the zones (CSA (The Federal Democratic Republic of Ethiopia Central Statistical Agency), Citation2017). To reduce the influence of local collectors, traders and transporters on the price setting process by establishment of marketing centers and cooperatives based on value chain study is crucial.
To do these, value chain analysis based on Porter’s (Citation1985) theory was one of the suggested solutions to popularize the idea of the value chain as the combination of generic activities operating within a firm, activities that work together to provide value to customers. Value chain analysis can be done at a product level, measuring input-output flows based on a defined functional unit of a commodity without being site specific, or at a spatial level, describing input-output flows within a defined economy (Faße et al., Citation2009; Gabriel et al., Citation2019; Kano et al., Citation2020). According to Trienekens (Citation2011), the main aim of a value chain is to produce value-added products for a market, by transforming resources and by use of infrastructures within the opportunities and constraints of its institutional environment. To develop the value chain of the commodity, the constraints related to market access (local, regional and national) and market orientation (Giuliani et al., Citation2005), available resources and physical infrastructures (Porter, Citation1985: factor conditions) and institutions (regulative, cognitive and normative; Scott, Citation1995) should be identified. Thus, understanding the flow of banana through a value chain is important to identify opportunities and constraints (Ouma & Jagwe, Citation2010).
Likewise, the banana value chain in Ethiopia, which links producers to market, is hampered by a variety of constraints; primarily sever coordination challenges (FAO (Food and Agriculture Organization), Citation2012; Piet et al., Citation2012; Alex et al., Citation2015; Zinabu et al., Citation2019). Currently, the Ethiopian government has given attention to the horticultural sector to increase production (Getahun et al., Citation2017a). In addition to increment to production, improvement in market access play an important role in improving the incomes of smallholder farmers in the developing countries (Felton, Citation1959). Most of the banana that is traded southwestern zones (Benchi Maji and Sheka) of the country are recently joined the national banana market with untapped production potential (CSA (The Federal Democratic Republic of Ethiopia Central Statistical Agency), Citation2017). However, due to marketing problem the traders are the net beneficiaries from banana marketing in the study area, (Getahun et al., Citation2017a).
Most of the recent studies from southwestern Ethiopia claim that the farmers in that zones have no way or access for postharvest handling rather than selling their banana at a low market price due to limited access to credit, transportation problems and lack banana cooperatives (Benyam & Abatneh, Citation2019). Moreover, banana yields are continuously not increasing as expected due to their traditional way of banana production and poor agronomic practice. However, in Bench Maji and Sheka zones, currently, we could not find any documented information on the value chain actors with their role and map, what exactly marketing system looks like marketing channels, market performance and market participation to encourage and enrich the efforts. Thus, there is a need for a comprehensive study about banana value chain in Bench Maji and Sheka zones of southwestern Ethiopia. More specifically, the study identifies the actors and their roles across the banana value chain. It examines the performance of the market through marketing margin analysis. Moreover, it attempts to analyze the determinants of banana market participation decision and intensity of participation at farm level in the zones.
2. Theoretical and Empirical framework
2.1. Theoretical approach
The value chain stage starts at the input supply and passes through production up to the final stage. Besides, to all these major actors involved and their linkages at each stage, other service providers, which have an indirect role and the linkage between these actors create the governance, structure (Henry et al., Citation2014). In addition, market participation is one of the key concepts in value chain analysis and has been defined differently by various researchers. It is regarded as participation in any market related activity that encourages the sale of produce, as the individual farming household’s economic transactions with others in cash or kind or commercialization (Adeoti et al., Citation2014; Otekunrin et al., Citation2019). It is also viewed as the integration of subsistence or semisubsistence farmers into the inputs and output markets of agricultural products, to boost their income level resulting in poverty reduction (Ouma et al., Citation2010).
Market participation is one of the components of value chain analysis which is affected by numerous factors. According to Komarek (Citation2010), Geoffrey et al. (Citation2013), Efa et al. (Citation2016), and Bakundukize et al. (Citation2018), the factors such as socioeconomic factors (education level, gender, household size and household income); institutional factors (credit availability, cooperative and extension service); production factors (year of experience, farm size, quantity produced and improved varieties) and market factors (market information and market distance are the main determinants of market participation. These factors could have positive or negative effects on degree of market participation of farmers, which could either improve or cause a decline in the welfare of the farmers. The finding of the studies done by Ouma et al. (Citation2010) and Bakundukize et al. (Citation2018) indicate that access to institutional factors leads to crop market participation. The another study done by Gebremedhin and Jaleta (Citation2010) shows that livestock ownership and high income reduces crop market participation, since livestock offer alternative sources of cash income and hence the relationship is negative. The study by Efa et al. (Citation2016) claims that if households possess larger number of production factors, they can have sufficient input for crop production and it has positive contribution to market participation decision. The expectation of this is that access to those socio-economic, institutional, production and market related factors have positive effect on market participation expect distance from the market.
Smallholder farming households make decisions on where to sell or not at the market is based on maximizing utility (U) by choosing how much of each product to consume and produce (Adeoti et al., Citation2014). The theoretical framework of Key et al. (Citation2000) and Ouma et al. (Citation2010) investigated determinants of smallholder’s participation in the banana market both in Rwanda and Burundi of by extending Goetz (Citation1992). The methodology is based on a two-step procedure by Heckman (Citation1979). Findings showed that market participation is influenced negatively by transaction costs associated with transportation and market information costs. The price seemed to provide a significant incentive to supply banana in these areas. This study adopted the extended Key et al. (Citation2000), Ouma et al. (Citation2010) and Camara (Citation2017) general framework of utility or profit maximization.
However, the adopted frameworks more focus on transactions cost by ignoring another factors that mostly determine the market participation of the producers. Alternatively, this study includes several socioeconomic characteristics like age, sex, household size, land size, experience in banana production and income as determinants of market participation. In addition, market participation is also influenced by the extension contact frequency, availability of improved banana varieties and distance to the nearest market. Those who have more experience, land size, income, extensions contact and have large household size may opt to produce more and sell more in the market. Those who used improved banana varieties may produce large volume of banana and forced to participate more. While, those who are far away from nearest banana marketing area may participate less in banana market due lack of market information and huge transaction costs.
Under this framework, the key assumption is the decision of the farm household is based on the principle of utility maximization decision on whether or not to participate in the commodity market. The economic agents (banana producing farmers) whose participation decisions were measured by perceived utility or net benefit from any option. Although utility was not directly observed, the actions of economic agents were observed through the choices they made.
Suppose that and
represent a household’s utility for two choices, which are, correspondingly, denoted by
and
. The linear random utility model could then be specified as in Equationequation 1
(1)
(1) :
Where: and
are perceived utilities of banana market participation and nonbanana market participation choices j and k, respectively,
the vector of explanatory variables that influence the perceived desirability of each choice,
and
utility shifters, and
and
are error terms assumed to be independently and identically distributed (Greene, Citation2012).
In the case of banana market participation, if a household decides to use option j, the probability that a household will choose to participate j instead of k could then be defined as:
Where: P is a probability function; A random disturbance term;
=
a vector of unknown parameters that can be interpreted as a net influence of the vector of independent variables influencing participation, and
distribution function of
evaluated at
The exact distribution of F depends on the distribution of the random disturbance term,
.
2.2. Empirical approach
In the empirical literature review, different models are often used to estimate market participation (two-stage decision processes) by different authors. For stance, Alene et al. (Citation2008) used Heckman selection model to identify determinants of smallholders’ participation in market for maize output in Kenya due to constraints associated with access to inputs of production that results in sample selection bias. The authors concluded that high cost of transportation or access to market information lead to limited participation in maize market.
Study of Martey et al. (Citation2012) applied a Tobit model to analyzed market participation and sales among maize and cassava farmers in Ghana due to the large number of zeros in sales data and its result showed that market access and extension services are key determinants of sales. Burke et al. (Citation2015) employed the traditional Double hurdle model to analysis dairy market participation in Kenya. Based on a two-stage procedure, the authors found that how institutional services enhancing market participation of producers of a specific commodity and may encourage nonproducers to become producers and then sellers. Pandey et al. (Citation2013) conducted the study on economic study on market participation of chickpea in Rewa district of Madhya Pradesh using multiple linear regression model. The study came up with the finding that yield per hectare, size of family, production of chickpea, size of holding and income from other sources are significantly determinants of market participation.
A study by Getahun et al. (Citation2017a) used Heckman two stage to identify determinants of market participation of banana by smallholder farmers in Bench Maji zone, Ethiopia. The result of the model shows that sex, farming experience, access to credit, adequacy of extension services and off farm income are significant positive factors affecting market participation. Also study by Bakundukize et al. (Citation2018) employed Heckman two stage selection model to estimate the factors influencing the banana market participation in Muhanga district in South Province of Rwanda. The results revealed that access to transport facilities, distance to nearest town, distance to nearest training center, farming experience, banana trader collection, yield, market centers and farm gate/home, better price and closeness in distance were the key factors that determined intensity of banana market participation.
Multiple linear regression, Tobit, Double-hurdle and Heckman two stages were widely used models to analyze determinants of market participation in literature. However, the model to be used depends on the nature of the response variable (Wooldridge, Citation2010). To choose the fittest model, the survey dataset was thoroughly checked. From the dataset it was observed that some farm households were not participating in the banana market as the result multiple linear regression was not used since OLS estimates are not consistent and efficient parameters (Byron et al., Citation2012).
Heckman two-stage, Tobit and Double hurdle models were the alternatives used in literature to analyze market participation (Ricker-Gilbert et al., Citation2011; Achandi & Mujawamariya, Citation2016; Getahun et al., Citation2017b; Camara, Citation2017; Jean & Antoine, Citation2017). The Tobit modeling approach presumes that the participation and sales volume decisions are made simultaneously (Tobin, Citation1958) and hence factors that affect the participation decision and the sales volume decision are the same. The limitation of this model is that it assumes that the same set of parameters and variables determine both the probability and level of market participation (Geoffrey et al., Citation2013). While, Double hurdle model considers zeros as observed data since they can reflect rational decisions of smallholders to stay out of the markets owing to multiple factors preventing access to market such as insufficient expected net gain from selling (Cragg, Citation1971). Alternatively, the Heckman (Citation1979) selection model is based on the assumption that zeros come from unobserved data due to nonrandom sample from the survey, nonresponse in survey or sample attrition. The main difference between these models is due to the treatment of zeros in data on sale of banana to the market.
In addition, in this study some households may not prefer to participate in banana market due to the perception of community towards banana selling. This biased perception of considering sell of banana for relatively poor farm households results the sample selection bias. To take advantage of the merits of two-stage analysis and to address the zero value in dependent variable, simultaneously, the Heckman two-stage sample section model was recommended (Bakundukize et al., Citation2018; Xu et al., Citation2017). Though the models (Tobit & Double hurdle) are two stage models, they do not capture sample selection bias (Wooldridge, Citation2010). To overcome sample selection bias, the Heckman selection model (two-step) was used for this study.
3. Methodology of the Study
3.1. Area description
The present study was carried out in Bench Maji and Sheka zones of Southwestern Ethiopia. The Benchi Maji zone is located 561 km from Addis Ababa the capital city Ethiopia in a southwest direction with the altitude range between 700 and 2500 (Kassa et al., Citation2020). The mean annual rainfall and temperature vary between 400 and 2000 mm and 15–27°C respectively (Getachew et al., Citation2018b). As well Sheka zone is located in southwestern Addis Ababa at 694 km, the altitude of ranges 1200–3000 (Kassa et al., Citation2020). The annual average temperature of Sheka ranges 15.1–27.5°C with a 1201–1800 mm annual mean rainfall (Getachew et al., Citation2018b).
3.2. Sampling technique and sample size determination
This study followed a multistage sampling procedure to select the sample banana producers since it allows researchers to make clusters and sub-clusters until the researcher reaches the desired size or type of group. First, three districts namely Semen Bench, Debub Bench and Yeki were selected purposefully based on their banana production volume and interest of Agricultural Growth Program (AGP-II) due to intervention districts of the program. Secondly, from the selected districts, the sampled kebeles (the lowest administrative unit under Ethiopian condition) namely Utsikin and Tissue kebeles from Semen Bench; Kite and Fanika kebeles from Debubi Bench and Adis allem and Adis birahan from Yeki were selected purposefully based on their banana production volume. Thirdly, households in the selected kebeles were grouped into two groups (banana producers and non-producers) and listed by applying stratified sampling. Finally, 180 sampled banana producers were selected using a systematic simple random sampling technique proportionate to size sampling methodology following Yamane (Citation1967), since the population size(banana producers) is known.
=
= 176 ~ 180 (4)
Where: where n is the sample size; e is the level of precision (e =7.5%) and N is total number of banana producers in the sampled districts (N =20,978)
In addition, from the available banana traders in Mizan Aman and Tepi markets (the largest banana markets in the study area), 38 traders (11 bulkers, 7 transporters, 15 retailers and 5 processors) were selected randomly using the manual lottery method.
3.3. Data collection procedure
This study used a cross-sectional research design, employing both quantitative and qualitative research methods (mixed methods) as championed by McCormick and Schmitz (Citation2001) in collecting data from the banana value chain actors. To increase the reliability and precision of data, a triangulation method (semistructured questionnaires, focus group discussions, key informant interviews and literature review) was adopted as endorsed by Creswell (Citation2009) and Ariho et al. (Citation2015).
The primary data were collected through individual farmers’ survey, observation, focus group discussion and key informant interview from the chain actors by using a semi-structured questionnaires and checklists. The adopted semistructure questionnaire was used for farmers’ and traders survey while checklist was used for focus group discussion (FGD) and key informant interview (KII) in the chain. To collect the intended data, the enumerators who are working in the districts rural kebeles as development agents and technical assistants from Bonga agricultural research center were used. Before data collection the enumerators were trained on the clarity of each questions and techniques of data collection. Before formal survey, the questionnaire was pretested on 18 households to evaluate the appropriateness of the design, clarity, relevance and interpretation of the questions, and time taken for an interview. Based on the collected feedback from pretest, the appropriate modifications were made on the questionnaire before conducting the survey. By using the trained enumerators, data from 180 randomly selected banana producers were collected by face-to-face interview.
In addition, six FGD were conducted with a group of eight farmers from each kebele by using the checklist. The selection of farmers for group discussion was done with the assistance of development agents at kebele level. The qualitative data on current production and marketing situation and possibilities for banana chain development in two zones were collected through KII from the selected districts. Finally, the collected data were entered and cleaned in Statistical Package for Social Sciences (SPSS) before analyzing it.
3.4. Methods of data analysis
The collected data were analyzed using descriptive and econometric methods. The descriptive methods for instance, mean and percentage, value chain map, marketing margin were used. For econometric analysis, Heckman two-stage regression was used to analyze the factors that affecting banana producers’ market participation decision and intensity.
3.4.1. Marketing margin
Marketing margin is an important tool for analyzing marketing system performance. Costs and profit margins that makeup marketing margins can be indicators of both efficiency and inefficiency in marketing systems (Wisdom et al., Citation2014). The cost and price information obtained from the survey was used to evaluate the gross marketing margin. According to Kotler and Armstrong (Citation2003), the marketing margin can be analyzed using the price difference of the actors in the marketing channels. Total gross marketing margin (TGMM) is the final price paid by the end consumer, minus the producers’ price, divided by the consumers’ price and expressed as a percentage. TGMM is useful to calculate the producer’s gross margin (GMMp) and it is given by the formula shown below:
In order to gauge the level of equity in the distribution of benefits accrued along the chain, producer’s gross margin (GMMP), which is the portion of the price paid by the end buyer that goes to the producer is
3.4.2. Empirical model specification
Following our theoretical and empirical framework, Heckman two-stage model is suited to analyze market participation of smallholders. As indicated by Heckman (Citation1979), in the first stage of the model, the participation equation determines factors affecting household’s market participation decision; and it is also used to construct a selectivity term called “Inverse Mill’s Ratio.” The second stage involves factors affecting the intensity of market participation equation, including the Mills ratio and estimated by using ordinary least square (OLS). Heckman selection model (two-step) model is formulated as follows:
The binary probit model: It is used to identify factors that influence the household’s decision to participate in banana market. The model is built on a latent variable with the following formulation:
or
Where: = is latent variable representing decision whether to participate or not in banana market,
Xi = is an explanatory variable hypothesized to affect market participation decisions
= is a parameter to be estimated that measures the effects of explanatory variables
= is a normally distributed disturbance with mean (0) and constant variance and captures all unmeasured variables
Y = is a dependent variable that takes 1 if farmers participate in banana market, 0 otherwise.
The probit model is used to develop an index (Z) of factors affecting household’s decision to participate in banana market. From Z, LAMBDA, this is related to the conditional probability that a household would participate (given a set of independent variables), is determined.
Where: λi is the inverse Mill’s ratio, ϕ and Φ are the density and distribution functions for the standard normal variable, is a vector of regression parameters for variable X, and
is the standard deviation of the error term.
Then, the parameters that determine the intensity of participation can consistently be estimated by OLS over n observations reporting values for Yi by including an estimate of the inverse Mills ratio, denoting λI as an additional regressor. The model for observed level is given by:
λI+
(9)
Whereis the volume of banana sold,
is explanatory variables determining the volume of banana sold
λi is the inverse Mill’s ratio
is a parameter that shows the impact of participation on volume and
is the error term.
3.4.3. Hypothesis and description of the variables
In the case of identifying factors affecting banana market participation at farm household level in Bench Maji and Sheka zones, the main task was exploring which factors potentially influence and how these factors are related to the dependent variable. Farmers’ market participation is also determined by predictor variables, which are socioeconomic, institutional, market and production related in nature (Gebremedhin & Jaleta, Citation2010). Eleven explanatory variables were hypothesized to identify their effects on the banana market participation. The explanatory variables such as the sex, age and education level of household head, extension contact frequency, experience in banana production, households size, total income, utilization of improved banana variety, area allocated for banana production were hypothesized to affect the market participation positively based on previous studies (Amen & Desalegn, Citation2018; Gani & Adeoti, Citation2011; Getahun et al., Citation2017b; Ouma et al., Citation2010; Terfa et al., Citation2012; Tessema et al., Citation2017).
On the other hand, distance from nearest market was assumed to influence market participation adversely (Ademe et al., Citation2017; Getahun et al., Citation2017b; Osmani & Hossain, Citation2015). Theses authors have concurred that marketing costs directly expressed in terms of distance from the market limits or and even completely hinders smallholder market participation and concluded that households residing in places far from markets are less likely to participate in markets probably because of higher transaction costs. Thus this study hypothesis distance to the nearest market had a negative effect on banana market participation. The discussed explanatory variables with their expected hypothesis were summarized accordingly in Table .
Table 1. Summary of hypothesized variable for Heckman two-stage model
4. Result and Discussions
4.1. Descriptive result
Out of the total land owned, about 11% was covered by banana with an average area of 0.25 hectares (Table ). While, the average productivity of banana was 7.64 ton per hectare which was below the nation average (8.3 ton per hectare). The average price at their farm gate was 85.5 and 135.5 Ethiopia Birr (ETB) per bunch for unripe and ripen banana, respectively. Among all respondents, majority of banana producers (58.33%) accepts the buyers’ price. While the 22.22% and 17.78% of the farmers set price by negotiation and demand and supply, respectively (Table ). This indicates that large number of producers were price takers in the study area.
Table 2. Banana production and price-related variables
4.2. Banana value chain actors and their map
According to Faße et al. (Citation2009), the first step of a value chain analysis is the so-called mapping. The objective is to give an illustrative representation of the identified chain actors and their functions, the related finance and information flows. To do so, identifying the actors traced product flows within the chain starting from input supply should be done.
4.2.1. Banana value chain actors
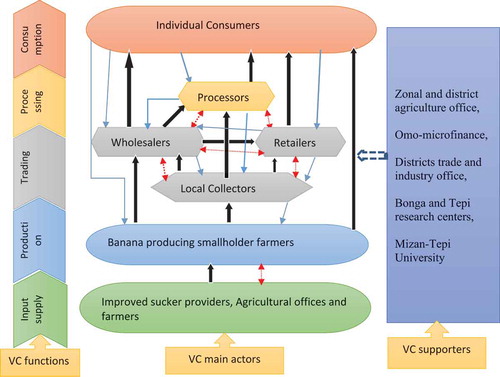
The major banana value chain actors identified in the study area were input suppliers, producers, collectors, wholesalers, processors, retailers, consumers and also other value chain supporters.
4.2.1.1. Input suppliers
Among the inputs only banana suckers were supplied one in the study area. The main improved banana sucker suppliers in the study area are districts office of agriculture and Tepi agricultural research center. While the local one was exchanged from farmer to farmer.
4.2.1.2. Banana producers
Are the main actors in the value chain who produces banana on its farmland. They were primary link actors who cultivate and supply banana to the market. Their main sources of seedling (sucker) are from older plantations or neighbors and districts agricultural offices. Producers sell their produce at the farm gate or village and district markets right after harvest due to perishability nature of the product.
4.2.1.3. Local collectors
These are actors who collect banana from producers at the farm gate and in village markets to resell it to retailers, processors and wholesalers in districts and zonal markets. They have an important role in moving banana to urban markets. To purchase banana, they used their financial sources and cash from wholesalers before selling in contract form.
4.2.1.4. Retailers
Are actors located in district and zonal markets, where they buy and deliver banana to consumers. They are known for their limited capacity of procuring with low financial capability. They purchase banana from wholesalers, local collectors and producers themselves.
4.2.1.5. Wholesalers
They are major value chain participants of the marketing system who purchase banana in bulky with better financial and information capability. They purchased banana either directly from a farmer or local collectors and resell the products to urban retailers, other wholesalers within and outside the zones. They mainly have an established relationship with collectors which ease their functionality. They bought and sell a large amount of banana to the Jimma and Adis Abeba markets. They have the role of carrying and packing banana in green banana leaves and or in vehicles to move bananas to their preferred market.
4.2.1.6. Banana processors
Are the actors that undertake the transformation of fresh bananas to juice to boost their market accessibility. These actors operate on a small scale due to consumer unawareness and traditional habit of direct ripen banana consumption habits. Finally, consumers they are final agents along the value chain. They are individual family units that bought the banana for their consumption.
4.2.1.7. Value chain supporters
Are those actors who provide services to main value chain actors. The services like extension services, training, credit service, market information and research services determine the state of success of the banana value chain. The identified value chain supporters in the study area are zonal and district agriculture office, Omo-microfinance, districts trade and industry office, research centers such as Bonga and Tepi, and Mizan-Tepi University. They play a central role in the provision of supportive services and creating an enabling environment for main banana value chain actors. Nevertheless, the value chain supporters are weakly linked to main actors thereby constraining the whole value chain operation. For instance, lack of information on improved varieties and agronomic practices, lack of credit services, presence of unlicensed traders, and poor market integration are the major constraint that discourages the main actors in the area.
4.2.2. Banana value chain map
Mapping of value chain actors and their functions helps us to understand how different businesses interconnect to form one system (Lundy et al., Citation2014). It is considered to show the relationships and integrations of the processes and activities performed along the value chain. A visual map of the value chain has the capacity to reveal stakeholders involved in the chain, boundaries of the system, interrelationships and functional roles, a flow of goods, payments, and information along the chain (Gebre et al., Citation2020). Accordingly, the above discussed the banana value chain actors (main actors and supporters) are the major components of these banana value chain map as illustrated in Figure .
Figure 1. Banana VC map in the study area.
4.3. Banana marketing channels
The main banana marketing channels in the study area have been identified to be four, and banana follows. The four main routes from the point of its production to its consumption. Banana producers are the first actors who are accountable for banana production. They harvest bunch of banana and mostly sell to the consumers, wholesalers and collectors. Sometimes, there are also farm gate banana collectors who buy banana from the farm in contract form. These farm gate collectors who collect banana at the farm gate or road side in some kebeles which are far from main road along the Mizan and Tepi.
The survey result indicates that from 21,795 ton estimated volume of banana produced by sampled households in 2017/18, about 11,887 ton of banana were supplied to market. The channel comparison was made based on the volume of banana that passed through each channel as follows:
Channel I: Producers Consumers = 1652 ton =13.9%
Channel II: Producers Retailers
Consumers = 3488 ton (29.3%)
Channel III: ProducersCollectors
Retailers
Consumers =2271 ton (19.10%)
Channel IV: ProducersCollectors
Wholesaler
Retailers
Consumers = 4476 ton (37.65%)
Accordingly, from the total amount of banana supplied to the market (11,887 ton) the largest volume of banana passed through channel IV that is about 4476 ton of banana in a year 2017/18, which was about 38% of the total volume. Therefore, channels IV and II together accounts for about 67% of the total banana flow, and this indicates that the flow of banana market in the study area is concentrated on these channels. It can also be said that channels II and IV are the most advantageous banana market channels for the producers; both channels make producers gain a collective bargaining power and also help them get a fair market price. This result is in agreement with Getahun et al. (Citation2017a) which has indicated that the channels from producers to consumers through collectors and retailers were the main route for banana marketing.
4.4. Banana market performance
Marketing margin analysis for each value chain actor was used to determine the market performance of the banana. From the result, the banana producers’ gross profit was highest in the channel I while they take the lowest gross profit when they sell to collectors in channel III that accounts for 75 ETB/bunch. This implies producers are more profitable if they sold directly to retailers and consumers. Collectors from traders shared the highest profit 17 birr/bunch when they did purchase from producers in channel III and they sold directly to consumers. As indicated in Table , the total gross marketing margin (TGMM) is highest in channel III and IV, which was 32.67% and lowest in channel II that was 24%. This difference might support the theory that as the number of marketing agents increases the producers share decreases. For instance, without considering channel I where producer directly sold banana to consumers, the maximum producer’s share (GMMp) is highest in channel II that was 76% of the total consumers’ price. The reason being, the more the number of middlemen in the banana market, the more profit they retain for their services whether they add value to the item or not.
Table 3. Banana profit margin of value chain actors along different channels (Birr/Bunch)
The survey result also shows that the lowest gross marketing margin was taken by the wholesaler in channel IV that was 8%. While the highest gross marketing margin from traders was taken by collectors, which accounts for 20.83% of the consumers’ price in channel III (Table ). This implies the share of market intermediaries in the consumer’s price was large and there was a need to reduce market intermediaries to minimize the marketing margins. To improve the marketing efficiency, the growers should sell their produce directly to the wholesaler or retailer wherever feasible (Umagowri & Chandrasekaran, Citation2012).
4.5. Determinants of banana market participation
The results presented in Table show that the Heckman selection model was correctly predicted the observations with a significant Wald chi2 of 72.44. This indicates that the coefficients of the independent variables are jointly different from zero at the 1% probability level. Also, the Inverse Mills Ratio (Lambda) or selectivity bias correction factor has significantly affected the level of banana market participation at less than a 5% significance level. This discloses the fact that there is sample selection bias; which implies the existence of some unobserved factors responsible for banana growers’ likelihood to participate in the market and thereby the level of market participation. The rho is positive; this indicates that unobserved factors are positively correlated with one another. Sigma =71.084 represents the adjusted standard error for the level of market participation equation regression, and the correlation coefficient between the unobserved factors that determine the decision into market participation and unobservable that determine the participation level is given by rho =0.974.
Table 4. Estimates of Heckman two-step model
Accordingly, 6 out of the 10 independent variables were found to determine probabilities and intensity of banana market participation significantly (Table ). The educational level of household head was associated positively with level of banana market participation at less than a 5% significance level. On average, if a banana producer improves education by one grade, the amount of banana supplied to the market increases by 0.55 ton keeping other factors constant. This suggests that education improves the level of production by analyzing the benefit of marketable surplus. This finding concurs with the finding of Barrett (Citation2008), Christopher et al. (Citation2014), and Efa et al. (Citation2016) revealed that the farmer’s educational level had a positive and significant impact on the level of market participation.
An access to extension service was significantly associated with households’ market participation for the banana and level of participation at 10 and 1% level of significance. The extension service delivered in the area contributed positively to enhancing the productivity of banana by the promotion of good agronomic practices of producers. Consistent with our findings, Christopher et al. (Citation2014) pointed out that the number of extension visits from government workers had a positive and significant effect on the decision to participate in the market. This finding also concurs with Benyam and Abatneh (Citation2019) who found that the coefficient of extension services has a positive relation with the extent of market participation banana producers. Umagowri and Chandrasekaran (Citation2012) also confirm in their study in India, farmers must have the latest market knowledge through frequent extension for better sales decision.
There was a significant and negative association between total income from fruit production and the households’ market participation decision at less than 1% significance level. The higher income generated by the other sector was found as an important motivational factor for households to less participate in the market that most of them focus on cash crops. In addition, the banana potential to generate income throughout the year was also compared and they are shifting in other annual cash crops by allocating more land. This finding concurs with the finding of Osmani and Hossain (Citation2015) who reported that farmers’ decision to participate in banana market is negatively related to the amount of total income.
Distance from the market was found to have negative associations with market participation. It affects market participation probability and level of participation at less than 5 and 10% significance level, respectively. This implies that the farther from marketing center, the lesser will be the household’s tendency to participate in the market. More likely reason may be the heavyweight per unit volume of the products. As a result, the households may be discouraged to participate in the market due to the high transportation cost resulted from heavyweight per unit volume of the products (Getahun et al., Citation2017b).
Improved banana variety utilization affects both market participation and level of market participation positively and significantly. Even if most of the farmers in the study area do not utilization of improved banana variety, there is emerging demand by observing those who started utilization (they commonly say Arba Minch) the market participation probability high for them. The regression result shows that the market participation probability and the amount of market supply increased by 48% and 0.9 ton for those who utilize the improved banana variety as compared to those who do not utilize them, respectively. Study by Amen and Desalegn (Citation2018) confirms that the type of varieties used affects banana market participation
The area allocated for banana production, which is considered as an identity variable included in the selection equation as an exclusionary variable to satisfy the Heckman selection assumption was significantly associated with households’ market participation at less than 5% significance level. The relationship indicates as the area covered by banana increases, banana to be harvested increases resulting in more banana yield, which in turn leads to an increased probability of deciding to participate in the market of the product by the households. The marginal effect also indicated that a one hectare increase under banana cultivation would increase the probability of banana market participation decisions by 11.5%. The more land allotted to banana growing, more quantity would be supplied to the market. Consistent with our finding, Tessema et al. (Citation2017) found expanding the area under ensat increased the market participation of the ensat products.
4.6. Constraints and opportunities
From individual interviews, adopting improved banana varieties was identified as one of the potential marketable fruit in the study area. Even though the study area is agro-ecologically suitable for the production of banana, the following constraints were identified and prioritized (Table ). Accordingly, lack of an organized market to sell the product, disease problem, low demand in peak season which decreases price, high cost of improved banana suckers, low supply of improved banana varieties are the most important constraints identified. A study by Getachew et al. (Citation2018a) confirms that increased pressure of diseases and insect pests, low level of investment due to marketing problems, poor agronomic practices and inadequate availability of improved technologies are the constraints that decreased the overall yield and quality banana in the Gamo Gofa zone of Ethiopia.
Table 5. Constraints identified and rank
Though there are a lot of constraints along the value chain there are also some opportunities along the banana value chain in the study area. These opportunities are increasing demand for banana/fruits, government commitment to support for the horticultural sector, presence suitable agro-ecology to produce fruits, availability of land for banana production, and road development) that connects with the central part of the country and Upgrading the identified opportunities have high potential for improving the efficiency of the banana value chain (Alex et al., Citation2015).
5. Conclusion
The volume of banana production shows an increasing trend in Benchi Maji and Sheka zones in terms of land allocation as compared to other zones in the region. However, disease and lack of accessing the improved banana suckers are constraints affecting banana productivity in addition to poor agronomic practices. Agronomic practice like poor management of soil, weed, planting habit and absence of irrigation practice were the major factors negatively affecting the productivity of banana. Therefore, agricultural departments should strengthening the training and advice on the agronomic practice like land preparation, planting, weed control, sucker removal, fruit management and postharvest handling practice to improve banana production and productivity. In addition, the departments should focus on building the capacity of development agents on banana disease management to provide proper advice and awareness for farmers regarding banana disease. While, research organizations (Bonga and Tepi centers, and Mizan-Tepi University) should introduce and demonstrate improved and disease resistance banana varieties to increase the banana biodiversity of the area.
Banana markets were not efficient to benefit banana producers in Bench Maji and Sheka zones. As a result, banana producers lose about 32% of the final consumer price. Lack of market information, traders autocracy in pricing of the product, lack of awareness of farmers in establish banana cooperatives, lack of a common banana marketing center in the zones, and limited alternative markets are the major constraints of banana marketing in the study area. Thus, there need to decrease the marketing channels that makes banana market less informal but also increase demand for banana which is necessary for farmer market access.
Market participation of banana producers was positively and significantly determined by extension contact, type of varieties utilized, the area allocated for banana production and education level of household. Therefore, agricultural development programs should support banana producers with technical training by increasing access to improved banana varieties. In addition, to exchange best banana production experience arranging field days, cross visits of model farmers and field trip to areas with best banana production practice is suggested. While distance to the nearest market (level and decision) and total income (participation decision) impact negatively. Therefore, community access roads should be given priority in future investment transport infrastructure investment programs and repair current roads that increases the market access and decreased transport costs.
Overall, upgrading the identified opportunities that have high potential for improving the efficiency of the value chain is vital. Thus, the efforts should be taken to improve linkages among input dealers and value chain actors by respective stakeholders. Also, it is suggested technical support of producers to improve value chain development as a means for improving the efficiency of trade systems through arranging field days, cross visits of model farmers and field trip to areas with the best banana production practices. Finally, the introduction of value chain upgrading options like ripening and establishment of banana cooperatives from the experienced Arba Minch area is suggested.
Acknowledgements
The authors would like to thank the sampled farmers, experts of selected district agricultural office for their cooperation in providing necessary information. The financial support of Southern Agricultural Research Institute through AGP-II is gratefully acknowledged. Finally, we would like to thank the reviewers for their constructive comments that improve the paper.
Additional information
Funding
Notes on contributors
Kassa Tarekegn
Kassa Tarekegn was former research staff of Bonga Agricultural Research Center within Southern Agricultural Research Institute for about six years up to 30 October 2019. He conducted different researches on value chain analysis of crop and livestock products, production system analysis, productivity and efficiency analysis of crop, adoption and impact evaluation of different interventions and valuation resources. Currently, he is a Socio-economics researcher at Arba Minch Agricultural Research Center of the same institute starting from November 2019.
References
- Achandi, E., & Mujawamariya, G. (2016). Market participation by smallholder rice farmers in Tanzania: A double hurdle analysis. Studies in Agricultural Economics, 118(2), 112–20. https://doi.org/10.7896/j.1528
- Ademe, A., Legesse, B., Haji, J., & Goshu, D. (2017). Smallholder farmers’ crop Commercialization in the highlands of eastern Ethiopia. Review of Agricultural and Applied Economics, 20(2), 30–37. https://doi.org/10.15414/raae.2017.20.02.30-37
- Adeoti, A., Oluwatayo, B. I., & Soliu, O. R. (2014). Determinants of market participation among maize producers in Oyo State, Nigeria. Nigerian Journal of Economics, 4(7), 1115-1127.
- Alemu, M. (2017). Banana as a cash crop and its food security and socioeconomic contribution: The case of Southern Ethiopia, Arba Minch. Journal of Environmental Protection, 8(3), 319–329. https://doi.org/10.4236/jep.2017.83024
- Alene, A., Manyong, V., Omanyac, G., Mignouna, H., Bokanga, M., & Odhiambod, G. (2008). Smallholder market participation under transactions costs: Maize supply & fertilizer demand in Kenya. Food Policy, 33(4), 318–328. https://doi.org/10.1016/j.foodpol.2007.12.001
- Alex, I., Jeremia, M., George, T., & Anna, S. (2015). Opportunities for upgrading the banana value chain in Uganda. Journal Continuing Education and Extension, 6(1), 826–843.
- Amen, D., & Desalegn, D. (2018). Analysis of socio-economic factors affecting banana production: Evidences from lowlands of uba debretsehay Woreda, Gamo Gofa Zone, SNNPRS. Journal of Economics and Sustainable Development, 9(9), 1–7.
- Ariho, A., Makindara, J., Tumwesigye, G., & Sikira, A. (2015). Assessment of innovative market access options for banana value chain in Uganda. Journal of Development and Agricultural Economics, 7(10), 323–331. https://doi.org/10.5897/JDAE2015.0644
- Bakundukize, P., Patrick, M., Fredah, W., Ntaganira, E., & Aimable, N. (2018). Factors that influence banana supplied to the market in Muhanga District, Rwanda. International Journal of Scientific & Engineering Research, 9(7), 954–960.
- Barrett, C. B. (2008). Smallholder market participation: Concepts and evidence from Eastern and Southern Africa. Journal of Food Policy, 33(4), 299–317. https://doi.org/10.1016/j.foodpol.2007.10.005
- Benyam, T., & Abatneh, T. (2019). Value chain analysis of banana in Mizan Aman Town of Benchi Maji Zone, Southwest Ethiopia. International Journal of Horticulture, Agriculture and Food Science, 3(1), 12–19. doi: 10.22161/ijhaf.3.1.2
- Berhe, K., Puskur, R., Teka, W., Hoekstra, D., & Tegegne, A. (2010). Innovation in banana value chain development in Metema District, Northwestern Ethiopia: Improving Productivity and Market Success (IPMS) project experiences. Acta Horticulturae, 879(879), 129–140. https://doi.org/10.17660/ActaHortic.2010.879.11
- Burke, W., Myers, R., & Jayne, T. (2015). A triple-hurdle model of production and market participation in Kenya’s dairy market. American Journal of Agricultural Economics, 97(4), 1227–1246. https://doi.org/10.1093/ajae/aav009
- Byron, R., Donovan, C., Bernsten, R., & Maredia, M. (2012). Market participation and sale of potatoes by smallholder farmers in the central highlands of Angola: A double hurdle model: Triennial Conference of International Association of Agricultural Economists, Foz do Iguaçu, Brazil, August 18–24, 2012.
- Camara, A. (2017). Market participation of smallholders and the role of the upstream segment: Evidence from Guinea. International Food Policy Research Institute. https://mpra.ub.uni-muenchen.de/78903/
- Christopher, S., Johnny, M., Enid, K., Apolo, K., & Harriet, K. (2014). Smallholder farmers’ decision and level of participation in the potato market in Uganda. Modern Economy, 5(8), 895–906. https://doi.org/10.4236/me.2014.58082
- Cragg, J. G. (1971). Some statistical models for limited dependent variables with application to the demand for durable goods. Econometrica, 39(5), 829–844. https://doi.org/10.2307/1909582
- Creswell, J. (2009). Research design: Qualitative, quantitative, and mixed methods approaches. SAGE Publications.
- CSA (The Federal Democratic Republic of Ethiopia Central Statistical Agency). (2017). Agricultural sample survey 2016/2017; volume i, report on area and production of major crops, statistical bulletin 584. CSA. www.csa.gov.et › atlas › category › 131-eth-agss-2017
- CSA (The Federal Democratic Republic of Ethiopia Central Statistical Agency). (2018). Agricultural sample survey 2017/2018; volume I, report on area and production of major crops, statistical bulletin 586. CSA. www.csa.gov.et › atlas › category › 131-eth-agss-2018
- Daniel, S. (1999). Banana in the southern region of Ethiopia (SRE). In C. Picq, E. Fouré, & E. A. Frison (Eds.), Bananas and food security, 10–14 November 1998 (pp. 119–128). INIBAP.
- Dawit, A., & Asmare, D. (2008). Banana markets in Ethiopia (Research Report 76). Ethiopian Institute of Agricultural Research. http://www.eiar.gov.et/report76.2008/
- Efa, G., Degye, G., Tinsae, D., & Tadesse, K. (2016). Determinants of market participation and marketed surplus of teff producers in Bacho and Dawo districts of Oromia State, Ethiopia. Journal Agricultural. Economics and Development, 5(2), 20–32.
- FAO (Food and Agriculture Organization). (2012). Overview of world banana production and trade. The World Banana Economy, 198–-2012. FAO. http:www.fao. org/economic/est/est-commodities/bananas.
- Faße, A., Grote, U., & Winter, E. (2009). Value chain analysis methodologies in the context of environment and trade research, Diskussionsbeitrag, No. 429, Leibniz Universität, Hannover. http://hdl.handle.net/10419/37104
- Felton, A. P. (1959). Making the marketing concept work. Harvard Business Review, 37, 55–65.
- Gabriel, B., Bent, P., & Lawrence, W. (2019). The global value chain and internalization theory. Journal of International Business Studies, 50(8), 1414-1423. https://doi.org/10.1057/s41267-019-00218-8
- Gani, B., & Adeoti, A. (2011). Analysis of market participation and rural poverty among farmers in Northern part of Taraba State, Nigeria. Journal of Economics, 2(1), 23–36. https://doi.org/10.1080/09765239.2011.11884934
- Gebre, G., Rik, E., Kijne, A., & Yildiz, F. (2020). Analysis of banana value chain in Ethiopia: Approaches to sustainable value chain development. Cogent Food & Agriculture, 6(1), 1–31. https://doi.org/10.1080/23311932.2020.1742516
- Gebremedhin, B., & Jaleta, M. (2010). Commercialization of smallholders: Is market participation enough? [Paper presentation]. Paper presented at the Joint 3rd African Association of Agricultural Economists and 48th Agricultural Economists Association of South Africa Conference, Cape Town, South Africa.
- Geoffrey, S., Hillary, B., Lawrence, K., & Mary, M. (2013). Determinants of market participation among small-scale pineapple farmers in Kericho County, Kenya. Journal of Economics & Sustainable Development, 4(19), 59–66.
- Getachew, G., Habtamu, T., & Asela, K. (2018a). Spatial distribution and association of banana (Musa spp.) Fusarium wilt (Fusarium oxysporum f.sp. cubense) epidemics with biophysical factors in southwestern Ethiopia. Archives of Phytopathology and Plant Protection, 51(11–12), 575–601. https://doi.org/10.1080/03235408.2018.1502067
- Getachew, M., Mitiku, W., & Gtahun, K. (2018b). Assessment of weed flora composition in Arable Fields of Bench Maji, Keffa and Sheka Zones, South West Ethiopia. Agricultural Research & Techechology Journal, 14(1), 1–8. https://doi.org/10.19080/ARTOAJ.2018.14.555906
- Getahun, K., Eskinder, Y., & Desalegn, A. (2017a). Market chain analysis of high value fruits in Bench Maji Zone, Southwest Ethiopia. International Journal of Marketing Studies, 9(3), 124–135. https://doi.org/10.5539/ijms.v9n3p124
- Getahun, K., Eskinder, Y., & Desalegn, A. (2017b). Determinants of smallholder market participation among banana growers in Bench Maji Zone, Southwest Ethiopia. International Journal of Agricultural Policy and Research, 5(11), 169–177. https://doi.org/10.15739/IJAPR.17.020
- Giuliani, E., Pietrobelli, C., & Rabellotti, R. (2005). Upgrading in global value chains: Lessons from Latin American clusters. World Development, 33(4), 549–574. https://doi.org/10.1016/j.worlddev.2005.01.002
- Goetz, S. J. (1992). A selectivity model of household food marketing behavior in Sub-Saharan Africa. American Journal of Agricultural Economics, 74(2), 444–452. https://doi.org/10.2307/1242498
- Greene, W. (2012). Econometric analysis (7th ed.). Prentice Hall.
- Heckman, J. (1979). Sample selection bias as a specification error. Econometrica, 47(1), 153–161. https://doi.org/10.2307/1912352
- Henry, J., Bennie, G., & Gerhard, R. (2014). Conceptual framework for value chain analysis for poverty alleviation among smallholder farmers. Agrekon: Agricultural Economics Research, Policy and Practice in Southern Africa, 53(1), 1–25. https://doi.org/10.1080/03031853.2014.887903
- Jean, P. K., & Antoine, K. (2017). Analysis of factors influencing market participation of smallholder bean farmers in Nyanza District of Southern Province, Rwanda. Journal of Agricultural Science, 9(11), 99–111. https://doi.org/10.5539/jas.v9n11p99
- Kano, L., Tsang, E. W., & Yeung, H. W. (2020). Global value chains: A review of the multi-disciplinary literature. Journal of International Business Studies, 51(4), 577–622. https://doi.org/10.1057/s41267-020-00304-2
- Kassa, T., Akililu, A., Yishak, S., & Tesfaye, G. (2020). Dairy value chain analysis in Bench Sheko and Sheka Zones, South Western Ethiopia. Trends in Applied Sciences Research, 15(1), 21–28. doi: 10.3923/tasr.2020
- Key, N., Sadoulet, E., & Janvry, A. (2000). Transactions costs and agricultural household supply response. American Journal of Agricultural Economics, 82(2), 245–259. https://doi.org/10.1111/0002-9092.00022
- Komarek, A. (2010). The determinants of banana market commercialization in Western Uganda. African Journal of Agricultural Research, 5(9), 775–784.
- Kotler, P., & Armstrong, G. (2003). Principle of marketing. In Hall of India Pvt. Ltd. New Delhi (10th ed., pp. 5–12).
- Lundy, M., Amrein, A., Hurtado, J., Becx, G., Zamierowski, N., Rodríguez, F., & Mosquera, E. (2014). Link methodology: A participatory guide to business models that link smallholders to markets (Second ed.). Centro International de Agricultural Tropical (CIAT). http://ciat-library.ciat.cgiar.org/articulos/ciat/Methodology.pdf
- Mafa, C., Bezabih, E., & Demese, C. (2015). Ethiopia’s agriculture sector policy and investment framework (2010–2020) external mid-term review. Secretariat of the Government of Ethiopia/Development Partners Sector Working Group on Rural Development and Food Security (RED&FS). www.agri-learning-ethiopia.org/uploads/2015
- Martey, E., Al-Hassan, R., & Kuwornu, J. (2012). Commercialization of smallholder agriculture in Ghana: A tobit regression analysis. African Journal of Agricultural Research, 7(14), 2131–2141.
- McCormick, D., & Schmitz, H. (2001). Manual for value chain research on home workers in the garment industry. Institute of Development Studies, University of Sussex, UK. http://www.ids.ac.uk/ids/global/pdfs/WiegoManualendNov01.pdf
- Natnael, M. (2016). Statistical analysis of factor affecting banana production in Gamo Gofa zone, Southern Ethiopia. Engineering and Applied Sciences, 1(1), 5–12. doi: 10.11648/j.eas.20160101.12
- NPC (National Planning Commission). (2016). Federal democratic Republic of Ethiopia National Planning Commission: Growth and Transformation Plan II (GTP II) (2015/16-2019/20), volume I: Main text. https://www.worldcat.org/title/gtp-ii-201516-201920/oclc/1003293847
- Osmani, A., & Hossain, E. (2015). Market participation decision of smallholder farmers and its determinants in Bangladesh. Economics of Agriculture, 3(1), 12–19. doi: 10.22004/ag.econ.200519
- Otekunrin, O. A., Momoh, S., & Ayinde, I. A. (2019). Smallholder farmers’ market participation: Concepts and methodological approaches from Sub-Saharan Africa. Current Agriculture Research Journal, 7(2), 139–157. https://doi.org/10.12944/CARJ.7.2.02
- Ouma, E., & Jagwe, J. (2010). Banana value chains in Central Africa: Constraints and opportunitiese [Paper presentation]. Paper presented at the Joint 3rd African Association of Agricultural Economists (AAAE) and 48th Agricultural Economists Association of South Africa Conference, Cape Town, South Africa, September 19–23, 2010.
- Ouma, E., Jagwe, J., Obare, G., & Abele, S. (2010). Determinants of smallholder farmers‘ participation in banana markets in Central Africa: The role of transaction costs. Agricultural Economics, 41(2), 111–122. https://doi.org/10.1111/j.1574-0862.2009.00429.x
- Pandey, K., Tiwari, D., & Upadhyay, S. (2013). An economic study on marketed surplus of chickpea in Rewa district of Madhya Pradesh, India. International Journal of Plant, Animal and Environmental Science, 3(3), 223–241.
- Piet, V., Marc, S., Juergen, G., Timoteos, H., Rem, N., & Heinz, G. (2012). Pro-poor value chain development: private sector-led innovative practices in Ethiopia. Netherlands Development Organization.
- Porter, M. (1985). Competitive advantage. The Free Press.
- Ricker-Gilbert, J., Jayne, T., & Chirwa, E. (2011). Subsidies and crowding out: A double-hurdle model of fertilizer demand in Malawi. American Journal of Agricultural Economics, 93(1), 26–42. https://doi.org/10.1093/ajae/aaq122
- Scott, W. R. (1995). Institutions and organizations. Sage.
- Sena, A. (2019). Review of manufacture prospective and restraints of banana value chain in Ethiopia. International Journal of Innovative Research in Engineering & Multidisciplinary Physical Sciences, 7(2), 1–11.
- Teklay, T., Yeman, K., Selamawit, G., & Gebremedhin, W. (2016). Value chain analysis of banana in ‘Tekeze’ River Basin, North Ethiopia. Journal of Biology, Agriculture and Healthcare, 6(21), 34–40.
- Tekle, Y., Wondewosen, S., Zemach, S., Tibebu, S., Abraham, S., & Woineshet, S. (2014). Adaptability study of banana varieties at Jinka, Southern Ethiopia. American Journal of Agriculture & Forestry, 2(6), 250–255. https://doi.org/10.11648/j.ajaf.20140206.13
- Terfa, Z., Haile, A., Baker, D., & Kassie, G. (2012). Sheep market participation of rural households in Western Ethiopia. African Journal of Agricultural Research, 7(10), 1504–1511. doi: 10.5897/AJAR11.747
- Tessema, E., Bosena, T., & Lemma, Z. (2017). Determinants of market participation of enset (ensete ventricosum) farmers: The case of Doyogena District, SNNPR, Ethiopia. Journal of Economics and Sustainable Development, 8(15), 85–94.
- Tobin, J. (1958). Estimation of relationships for limited dependent variables. Econometrica, 26(1), 24–36. https://doi.org/10.2307/1907382
- Trienekens, J. H. (2011). Agricultural value chains in developing countries A Framework For Analysis. International Food and Agribusiness Management Review, 14(2), 51–82.
- Umagowri, M., & Chandrasekaran, M. (2012). An economic analysis of value chain of banana in Western Tamil Nadu, India. The IUP Journal of Supply Chain Management, 8(3), 66–80.
- Wisdom, M., Joseph, D., & Bonnet, K. (2014). Structure, conduct, and performance of teff markets in Northern and Central Malawi: Case of Mzimba and Kasungu districts. International Journal of Business and Social Science, 5(6), 130–139.
- Wooldridge, J. M. (2010). Econometric analysis of cross section and panel data (2nd ed.). MIT Press.
- Xu, X., Wong, S., Zhu, F., Pei, X., Huang, H., & Liu, Y. (2017). A heckman selection model for the safety analysis of signalized intersections. PloS One, 12(7), 1–16. https://doi.org/10.1371/ journal.pone.0181544
- Yamane, T. (1967). Statistics: An introductory analysis (2nd ed.). Harper and Row.
- Zenebe, W., Ali, M., Derbew, B., Zekarias, S., & Adam, B. (2015). Assessment of banana production and marketing in Ethiopia. International Journal of Sciences: Basic and Applied Research, 24(3), 283–307.
- Zinabu, A., Bikila, T., Temsgen, O., & Diriba, A. (2019). Review on the production and marketing of banana in Ethiopia. World Journal of Agriculture & Soil Science, 2(1), 1–9.