
Abstract
Twelve Ethiopian caraway genotypes were evaluated in eight environments in Ethiopia during 2014 and 2015 under rain fed condition. The field experiment was laid out using randomized complete block design with three replications. The objective of this experiment was to select high yielding and stable Ethiopian caraway genotypes with nonparametric methods. Combined analysis of variance was performed and 10 rank-based nonparametric stability parameters were measured. A pooled analysis variance for seed yield indicated that there were highly significant (P < 0.001) differences for main effects of genotype, environment, and their interaction. Genotype Gondar 027–2001 gave maximum number of umbel per plant. However genotype Gondar 010–2002 was recorded lowest number of umbel per plant. Adet 12–2000 gave highest plant height (64.7 cm) while Gondar 026–2000 gave lowest plant height (56.7 cm). A wide range variation was observed in days to flowering varied 87.7–91.8, days to maturity varied 157.16–159.8, plant height 56.7–64.7. The results of principal component analysis revealed that the stability statistics and yield were classified into three groups and related to two contrasting concept of stability. In this study, TOP and rank-sum were found to be useful measures for simultaneously selecting high yield and stable cultivars. These measures selected Gondar 027–2001 and Gondar 023–2000 that gave 2254.7 kg ha−1 and 2186.1 kg ha−1 seed yield, respectively, as stable and the National Variety Release Committee has released these genotypes as the first Ethiopian caraway varieties for production in 2017. Whereas, Adet 12–2000 and Gondar 018–2000 were the low yielding genotypes in some or all of the environments. Thus, Gondar 027–2001 and Gondar 023–2000 would be recommended for further demonstration and prescaling up in Amhara region and other similar agro ecologies.
PUBLIC INTEREST STATEMENTS
The production and use of spice crops in Ethiopia has a long history. They are used in the preparation of daily dishes, and as traditional medicines. The popular indigenous spices of Ethiopia include: black cumin (Nigella sativa L.), coriander (Coriandrum sativum L.), sweet basil (Ocimumum bassilicum L.), garden cress (Lepidium sativum L.), and Ethiopian cardamom (Aframomum corrorima (Braun) Jansen), wild pepper (Piper capense L.) and Ethiopian caraway (Trachyspermum ammi (L.) Sprague ex Turrill) is one of the seed spices. Ethiopia has wide agro ecology, which is favorable for Ethiopian caraway production. Ethiopian caraway is often grown together with garlic and hot paper. The evaluation of Ethiopian caraway genotypes in Ethiopia has been infant and on a small scale. Only some variety development efforts have been reported from Gondar Agricultural Research Center in the country. The productivity of Ethiopian caraway is low as compare to other crops due to lack of improved varieties.
1. Introduction
Ethiopian caraway (Trachyspermum ammi L. Sprague ex Turrill) is an annual medicinal plant belonging to Apiaceae family. It is cultivated in India, Iran, Pakistan, Egypt, and Ethiopia (Abate et al., Citation2003; Tomar & Malik, Citation2014). It is erect and branched cross-pollinated plant. Ethiopian caraway, also named as Bishop’s weed (English) and Ajowan (Hindi), has white flowers and small gray brownish seeds (Tomar & Malik, Citation2014). Its seeds are widely used for medicinal and food flavoring purposes (Dwivedi et al., Citation2012). The seed revealed to have stimulant, carminative, diuretic, antimicrobial, nematicidal, antihypertensive, antitussive, broncho dilatory, antioxidant, and hypolipidemic effects (Bairwa et al., Citation2012; Zarshenas et al., Citation2014).
In Ethiopia, 39,441 tons seed spices were harvested from 34,236 ha of land (FAOSTAT, Citation2018). Several improved technologies including improved varieties and suitable agronomic practices had been generated and distributed to different agro ecologies to enhance productivity of lowland and highland spices in Ethiopia (Girma et al., Citation2016). Despite its economic importance, Ethiopian caraway received less attention to improve its production and productivity and remained underutilized spice crop in Ethiopia. Research work that has been carried out so far is limited to collection and maintenance of germplasms and no significant effort applied on genetic improvement and agronomic practices. As to my knowledge, until the present, no improved Ethiopian caraway variety has been released in the country.
Most crop improvement programs aim at selecting of genotypes for maximum yield. In parallel with improving the yield, a new improved variety should have consistent yield performance across a range of environments, which is considered as stable or widely adaptable. Genotypes are commonly evaluated on multienvironments to select high yielder and stable cultivars across diverse environments. In evaluating genotypes in multienvironment trials, the effects of genotype and genotype by environment interaction are the most relevant (Yan & Kang, Citation2003). Moreover, significant interaction of genotype by environment creates trouble in selecting superior cultivars in stability and yield performance (Kang, Citation1990; Magari & Kang, Citation1993). In this case, yield stability analyses become pertinent (Hussein et al., Citation2000). There are many parametric and nonparametric statistical methods to determine yield stability. The parametric stability methods are preferred under certain statistical assumptions, like normal distribution of errors. However, if these assumptions are violated, parametric stability methods may not perform well (Huehn, Citation1990), but nonparametric methods can be quite reliable (Truberg & Huehn, Citation2000). Nonparametric stability methods provide useful alternative to parametric methods, since the nonparametric measures do not require statistical assumptions such as the distribution of observed values (Huehn, Citation1990).
Non parametric procedures proposed by Huehn (Citation1979), Nassar and Huehn (Citation1987), Kang (Citation1988), Fox et al. (Citation1990), and Thennarasu (Citation1995) classify genotypes as stable if they rank similarly across environments based on mean yield. Huehn (Citation1979) and Nassar and Huehn (Citation1987) proposed four nonparametric stability statistics; (1) Si(1) is the mean of the absolute rank differences of a genotype over the n environments; (2) Si(2) is the variance among the ranks over the n environments; (3) Si(3) and Si(6)are the sum of the absolute deviations and sum of squares of rank for each genotype relative to the mean of ranks, respectively. A genotype with lowest value of these statistics is considered to be the most stable. Using ranks of adjusted yield means of genotypes in each environment, Thennarasu (Citation1995) proposed NPi(1), NPi(2), NPi(3), and NPi(4) nonparametric statistics and defined stable genotypes as those whose position in relation to the others remained unaltered in the set of environments assessed. A genotype with lowest value of these statistics is considered most stable. Fox et al. (Citation1990) measure the frequency of each that ranked in the top, middle, and bottom third (TOP) of all tested genotypes across environments. A genotype frequently appeared in the top third for yield rank is considered as the most stable. Kang (Citation1988) nonparametric stability parameter applies both yield rank and Shukla’s Stability variance (Shukla, Citation1972). The genotypes that score lowest rank-sum are the most preferred ones. Studying the relationship among nonparametric stability parameters using rank correlations is pertinent to identify the appropriate stability parameters (Mohammadi et al., Citation2009) and to relate stability parameters with statistic and dynamic concepts of stability (Becker & Leon, Citation1988). The objectives of this study were to select Ethiopian caraway genotypes that have both high seed yield and stable performance across different environments for mid attitude of North Gondar and study the relationships between different nonparametric stability statistics.
2. Materials and methods
2.1. Planting materials and test environments
The Ethiopian caraway landraces were originally collected from different Ethiopian caraway growing areas of Amhara region and then morphologically characterized. Then 12 accessions were selected from previous preliminary yield trials that had been conducted in consecutive years. Since there was no registered variety, standard check was not used. Twelve Ethiopian caraway accessions were tested in 8 environments (year and location combinations) during 2014 and 2015 in Ethiopia under rain fed condition. The testing environments and genotypes are described in Tables and , respectively.
Table 1. Description of locations used for evaluation of 12 Ethiopian caraway genotypes in Ethiopia
Table 2. Combined analysis of variance (ANOVA) of Ethiopian caraway on seed yield
Table 3. Mean yield components for the combined analysis across eight environments
Table 4. Combined mean seed yield of 12 Ethiopian caraway genotypes studied in 8 environments
2.2. Experimental layout and field management
In all environments, the field experiments were laid out using randomized complete block design with three replications. Each genotype was planted on a plot size of 1.8 m long with five rows of 30 cm apart. Thinning was done to have 15 cm space between plants. Nitrogen was applied at rate of 45 kg ha−1at planting and P2O5 was applied at rate of 30 kg ha−1, half at planting and half before flowering. At Kulumsa, supplementary furrow irrigation was provided at flowering stage for two times on 10 days interval. Seed yield data collected from central three rows were converted into kg ha−1.
2.3. Statistical analysis
Data were collected on plant and plot basis. Seed yield data were subjected to combined analysis of variance (ANOVA) using GLM procedure of SAS statistical package (SAS Institute, Citation2002). Variance homogeneity was tested using Barttlet test and the variance across eight environments varied significantly. Hence, 10 nonparametric stability statistics, Si(1), Si(2), Si(3), and Si(6) (Huehn, Citation1979; Huehn & Nassar, 1987), NPi(1), NPi(2), NPi(3), and NPi(4) (Thennarasu, Citation1995), rank-sum (RS) (Kang, Citation1988), TOP (Fox et al., Citation1990) were computed using R statistical package called “phenability” (Branco, Citation2015). Spearman rank correlation coefficients among nonparametric stability parameters and with mean yield were produced using SAS statistical package (SAS Institute, Citation2002; Steel & Torrie, Citation1980). To further study the association among stability parameters and with yield, principal component analysis (PCA) was performed using rank correlation matrix in Genstat (GenStat, Citation2015).
3. Results and discussion
3.1. Combined analysis of variance
A combined ANOVA (Table ) for seed yield of 12 Ethiopian caraway genotypes studied across eight environments indicated that there were significant (P < 0.001) differences for the effect of genotype (G), environment (E), and G × E interaction. Out of total variation, environment contributed maximum variance (79.3%), indicating its largest effect on seed yield than the effect of genotype (1.11%) and G × E interaction (9.24%). In multienvironment trials, variance of environment is known to be largest (80%) while G × E interaction and genotype are usually small (Yan & Kang, Citation2003). The largest environmental variance might be resulted from the agro-ecological variation among test locations (Table ). However, the most relevant for genotype evaluation are the genotypic and G × E interaction effects and environment effect is usually ignored (Yan & Kang, Citation2003). In this study, the G × E effect exceeded the genotype effect eight times, showing significant G × E interaction effect suggesting the possible presence of different mega environments with different top-yielding genotypes and the genotypes performed variably across environments (Yan & Kang, Citation2003). Magari and Kang (Citation1993) and Kang (Citation1990) demonstrated that significant interaction of genotype by environment creates trouble in selecting stable cultivars. Hence, selecting superior genotypes depending on stability and yield performance would be appropriate.
3.2. Seed yield performance
The average seed yield of Ethiopian caraway genotypes across environments ranged from 1762.9 kg ha−1 for genotype Adet 12–2000 (G2) to 2254.7 kg ha−1 for genotype Gondar 027–2001(G4) (Table ). The maximum environmental mean seed yield was obtained from Takusa-2014 (3282.8 kg ha−1). The minimum environmental mean seed yield was obtained from Assosa-2015 (841.6 kg ha−1) and Chefa-2015 (857.1 kg ha−1) (Table ). Heidaria et al. (Citation2016) found that seed yield of Ajowan (Trachyspermum ammi L.) accessions collected in Iran ranged from 1432. kg ha−1to 4539.2 kg ha−1.
4. Nonparametric stability analysis
The value of 10 nonparametric stability statistics using seed yield and their rank based on the value were presented in Tables and , respectively. The significant tests, Z1 and Z2, values for Si(1) and Si(2) were calculated using ranks of adjusted data for each genotype and added over to get Z1 and Z2 sum, respectively (Table ) (Nassar & Huehn, Citation1987). The critical value of χ 2 (21.03) (P < 0.05, degree of freedom (DF) = 11) exceeded both Z sum values, showing that there were no significant differences in rank stability among genotypes. Besides, none of any genotype had higher Z value than the critical value χ2 (8.2) (P < 0.05, df = 1), indicating all genotypes performed significantly stable, relative to others. G1 and G12were considered as the most stable genotype since they had the minimum value of both Nassar and Huehn (Citation1987) statistics, Si (1) and Si(2). The highest yielding genotype, G4, ranked the third most stable according to both stability statistics (Table ). G5 showed maximum value of Si(1) and Si(2), indicating to be the most unstable genotype. Si(3) and Si(6) stability statistics combine yield and stability performance and the lowest values of these statistics indicate the most stable genotype (Huehn, Citation1979). Both Si (3) and Si(6) statistics identified G2 and G6 as the most stable and G9 as the most unstable genotypes.
Table 5. The value of nonparametric stability statistics computed for 12 genotypes
Table 6. Ranks of 12 Ethiopian caraway genotypes after yield data from 8 environments were analyzed for G × E interaction and stability using 10 different nonparametric methods
Thennarasu’s (Citation1995) nonparametric statistics, NPi(1), NPi(2), NPi(3), andNPi(4), consider a genotype with lowest value of these statistics as the most stable. According to NPi(1), G1 and G12 scored the lowest value, hence they were the most stable genotypes and G5 and G11 were the most unstable. G1showed small value of NPi(2), indicating to be the most stable, followed by G8 and G12. Like NPi(1), NPi(3) selected G1and G12 as the most stable. Statistics NPi(4) identified G6, G3 and G2 as the most stable genotypes. Three of Thennarasu’s (Citation1995) statistics, NPi(2), NPi(3), and NPi(4) indicated that the highest yielding genotypes, G4 and G11 were the most unstable (Table ). Similarly, Yong-jian et al. (Citation2010) found that NPi(2), NPi(3), and NPi(4) identified higher yielding genotypes as unstable in maize multienvironment trials.
Genotypes with fewer changes in rank are considered to be more stable (Becker & Leon, Citation1988). The Si(1) estimates are based on all possible pair-wise rank differences across environments for each genotype, whereas Si(2) is based on variances of ranks for each genotype across environments (Nassar & Huehn, Citation1987). Nevertheless, these two statistics ranked genotypes similarly for stability. For example, according to both Si(1) and Si(2). Two other nonparametric statistics of Huehn (Citation1979), Si(3) and Si(6) combine yield and stability based on yield ranks of genotypes in each environment. These parameters measure stability in units of the mean rank of each genotype.
TOP stability measure chose the best yielding genotypes G4 and G11 as the most stable followed by G9 and G10, since they ranked in the top third in the majority of environments (Fox et al., Citation1990) (Tables and ). According to Tamene et al. (Citation2015), TOP measure identified high yielding genotypes to be the most stable in faba bean. The undesirable genotypes identified by TOP measure were G6. According to Kang (Citation1988), nonparametric stability statistics, genotypes that score lowest rank-sum (RS) value are the most preferred ones. Two best yielding (G4 and G11) and three relatively lower yielding (G10, G1, and G5) genotypes had lower rank-sum (RS) and were considered as the most stable (Tables and ). G3, G6, and G8 were identified to be undesirable genotypes by the rank-sum statistic.
4.1. Correlations of seed yield and yield related traits
Knowledge of association between yield and its components is useful to make simultaneous selection for more than one trait. The correlation analysis helps in determining the direction and number of traits to be considered in improving the yield. Correlations among traits are presented in Table . Seed yield per hectare had high and positive associations with days to maturity (r = 0.69**), number of branch per plant (r = 0.8**), and number of umbel per plant (r = 0.78**). This result indicated that agronomic traits like number of branch per plant and number of umbel per plant could be exploited to increasing yield parameters in Ethiopian caraway. This means with increasing value of these traits, seed yield increases as well and vice versa. Whereas, there were negative correlations indicated among seed yield with plant height (r = −0.4) of Ethiopian caraway.
Table 7. Correlation among yield and yield components and growth parameters of Ethiopian caraway
Number of branch per plant showed a negatively and nonsignificant correlation with days to flowering (r = 0.04) and days to maturity (r = 0.03) but positively and highly correlation with plant height (r = 0.6**) (Table ). Number of umbel per plant showed a positive and highly significant correlation with plant height (r = 0.9**) and number of branch per plant (r = 0.65**) (Table ) while number of umbel per plant a positive and significant correlation with days to maturity (r = 0.45*) (Table ).
4.2. Relationships among nonparametric stability statistics
The result of spearman’s rank correlation shown on Table indicates that only TOP parameter was significantly (P < 0.01) and positively correlated with mean yield, indicating TOP could be importantly used for selecting genotypes with high wider adaptability in Ethiopian caraway. Strong positive correlation of mean yield with TOP has been also reported in lentil (Sabaghnia et al., Citation2006), bread wheat (Hintsa & Abay, Citation2013), faba bean (Tamene et al., Citation2015), and durum wheat (Kaya & Turkoz, Citation2016; Mohammadi & Amri, Citation2008) genotypes. Mean yield and TOP measure were significantly and negatively correlated with NPi(2), NPi(3), NPi(4), and Si(6) and these four statistics were correlated significantly and positively to each other (Table ). Similarly Sabaghnia et al. (Citation2006) and Mohammadi et al. (Citation2009) have reported that yield and TOP measure were negatively correlated with NPi(2), NPi(3), NPi(4), and Si(6) in lentil and barley genotypes, respectively. These four statistics were correlated positively to each other in lentil and barley genotypes (Mohammadi et al., Citation2009; Sabaghnia et al., Citation2006). In this study, NPi(2), NPi(3), and NPi(4) statistics were not significantly correlated with NPi(1). Similarly, absence of significant association of NPi(1) with the remaining NPis’ was also reported in lentil and maize genotypes (Sabaghnia et al., Citation2006; Yong-jian et al., Citation2010). There were significantly (P < 0.01) positive rank correlation among Si(1), Si(2), and NPi (1) but these statistics were not correlated with mean yield. Sabaghnia et al. (Citation2006), Mohammadi and Amri (Citation2008), Mohammadi et al. (Citation2009), and Kaya and Turkoz (Citation2016) have reported similar result in multienvironment trial of genotypes of different crops. In agreement with the current result, significantly positive correlation between Si(3) and Si(6) and significantly negative correlation with mean yield were indicated by Mohammadi et al. (Citation2007a), Segherloo et al. (Citation2008), Shah et al. (Citation2009), and Tamene et al. (Citation2015). RS was not significantly correlated with mean yield and TOP. Mohammadi and Amri (Citation2008) reported similar result in durum wheat. According to Mohammadi et al. (Citation2009), RS was not significantly correlated with TOP in genotypes of four studied crops.
Table 8. Spearman’s rank correlation coefficient of yield and nonparametric stability statistics for 12 Ethiopian caraway genotypes tested across eight environments
4.3. Principal component analysis
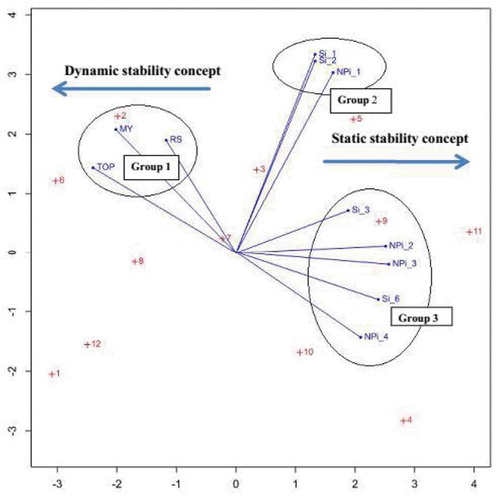
Principal component analysis (PCA) was computed to further investigate the relationship among nonparametric stability parameters and with mean yield. Figure shows a bi plot graph of PCA1 against PCA2. The first two principal components described 80.76% (54.55% and 26.21% by PCA1 and PCA2, respectively) of the original variance. The bi plot of the PCA1 and PCA2 divided stability parameters and mean yield into three groups (Figure ).
In this study, PCA1 distinguished stability parameters and mean yield based on two contrasting concepts of stability: the static (biological) and dynamic (agronomic) concepts. The concept of both stabilities is explained in detail by Becker (Citation1981) and Becker and Leon (Citation1988). Regarding to static stability/biological concept, a stable genotype performs constant yield regardless of environmental variations. On the contrary, according to dynamic/agronomic stability, the yield performance of a stable genotype responds to environmental variation (Becker, Citation1981; Becker & Leon, Citation1988).
PCA1 axis clustered mean yield and parameters TOP and RS, (Group 1), at left side and these parameters were matched with the dynamic/agronomic stability concept. At right side, PCA1 axis clustered the remaining other nonparametric stability parameters, Si(1), Si(2), and NPi(1) (Group 2) and Si(3), Si(6), NPi(2), NPi(3), and NPi(4) (Group 3) that matched with static/biological stability concept.
Parameters clustered in Group 1 (TOP and RS) had positive correlation among themselves and with mean yield in Ethiopian caraway genotypes (Table ). These stability parameters, TOP and RS, are related to dynamic/agronomic stability concept. Several previous studies indicated that TOP and RS are positively associated with mean yield and are related to the dynamic concept of stability (Akcura and Kaya, Citation2008; Flores et al., Citation1998; Mohammadi & Ahmed, Citation2013; Mohammadi & Amri, Citation2008; Sabaghnia et al., Citation2006). Therefore, these parameters could be recommended as useful measures for cultivar selection; according to Becker (Citation1981) and Friew (Citation2002), most plant breeders are interested in selecting for high yield and stability, simultaneously.
Hence, Top, and RS could be used to select high yielding Ethiopian caraway genotypes stable to wide range of environments. In this study, Gondar 027–2001 (G4) and Gondar 023–2000 (G11) were found to be high yielding and stable based on the TOP and RM parameters that are related to dynamic concept of stability. Besides, genotype Gondar 027–2001 (G4) also ranked as third most stable based on two static concept statistics, Si(1) and NPi(1) that did not correlate with yield. According to Becker and Leon (Citation1988), in dynamic concept of stability, stable genotype should not necessarily have a constant performance across environments. Hence, parameters associated with dynamic concept of stability could be used to identify cultivars for high potential environments. However, as pointed out by Roostaei et al. (Citation2014), these stability parameters might drop low general adaptable but high specific adaptable genotypes.
Stability parameters clustered in group 2 (Si(1), Si(2), and NPi(1)) were correlated significantly (p < 0.01) and positively to each other. Si(1), Si(2), and NPi(1) statistics ranked genotypes for stability similarly suggesting one of these parameters can be used as an alternative to the other parameters. Statistics Si(1), Si(2), and NPi(1) (group 2) matched with static/biological concept of stability and were not significantly correlated with mean yield, the group 1 (dynamic stability) and group 3 (static stability) statistics. In agreement with the current result, Sabaghnia et al. (Citation2006), Kaya and Turkoz (Citation2016), and Mohammadi and Amri (Citation2008) indicated that Si(1), Si(2), and NPi(1) were not correlated with yield and related to static/biological concept of stability. Previous research (Mohammadi et al., Citation2007b; Nassar & Huehn, Citation1987) have also shown that Si(1)and Si(2) defined stability in the sense of homeostasis and are related to the static (biological) concept of stability. Group 2 statistics (Si(1), Si(2), and NPi(1)) were influenced simultaneously by both mean yield and stability. Therefore, as also reported by Sabaghnia et al. (Citation2006), Si(1), Si(2), and NPi(1) parameters could be used as compromise methods to select genotypes with moderate yield and high stability (Sabaghnia et al., Citation2006).
Three of Thennarasu’s (Citation1995) parameters (NPi(2), NPi(3), and NPi(4)), Si(3), and Si(6) clustered in group 3 had positive association to each other. Like the group 2, statistics clustered in group 3 identified stable genotypes based on the static or biological concept of stability. But unlike group 2, group 3 statistics (NPi(2), NPi(3), NPi(4), Si(3), and Si(6)) had significantly negative correlation with mean yield. Kaya and Turkoz (Citation2016), Mohammadi and Amri (Citation2008), and Yong-jian et al. (Citation2010) have indicated that NPi(2), NPi(3), NPi(4), Si(3), and Si(6) statistics matched with static concept of stability and associated negatively with mean yield. The above parameters that are selected based on only stability without considering high yielding might not be suitable, since, according to Becker (Citation1981), plant breeders and agronomists prefer to select high yielding genotypes with wider adaptability. Besides, Mohammadi et al. (Citation2007a), Yong-jian et al. (Citation2010), Kaya and Turkoz (Citation2016), and Sabaghnia et al. (Citation2006) reported that NPi(2), NPi(3), NPi(4), Si(3), and Si(6) were not suitable for detecting stable and high yielding genotypes.
Figure 1. Bi plot of PC-1 and PC-2 of the rank correlation matrix of the 10 nonparametric stability parameters with seed yield.
5. Conclusion
Plant breeders and farmers prefer to select high yielding genotypes with good stability. So, both yield and stability should be simultaneously considered in genotype selection. Therefore, the use of agronomic or dynamic concept of stability is better. The present study indicated that group 1 nonparametric statistics, TOP (proportion of environments at which the genotype occurred in the top third) and rank-sum (sum of ranks of mean yield and Shukla’s stability variance), positively correlated with mean yield and associated with the dynamic concept of stability.
This study indicated that TOP and RS nonparametric statistics could be used to select genotypes for both high yielding and better stability simultaneously, in future Ethiopian caraway breeding program. Based on TOP and RS stability measures, Gondar 027–2001 (G4) and Gondar 023–2000 (G11) were high yielding and stable genotypes over other varieties . Hence, National Variety Releasing Committee under the Ministry of Agriculture and Natural Resources of Ethiopia approved the release of 027–2001 (G4) and Gondar 023–2000 (G11) for production and named as “Dembia-01” and “Takusa-01” respectively (MoANR, Ministry of Agriculture and Natural Resources [MoANR], Citation2017). Thus, it could be demonstrated in large-scale production in the study areas and with similar agro ecologies.
Competing interests
The authors declares no competing interests.
Acknowledgements
We would like to extend our acknowledgement Amhara Agricultural Research Institute, Gondar Agricultural Research Center for financing and providing work facilities. The Author also expresses their great gratitude to researchers for devoting their time to support this work.
Additional information
Funding
Notes on contributors
Endalkachew Aklilu
Mr. Endalkachew Aklilu has been an assistance researcher II in crops research directorate in Gondar Agricultural Research Center. Currently, he is working as breeder and coordinating the Pulse and Oil Breeding Program in the Center. He had done research activities including breeding, agronomy and related issues. The research group is composed of researchers working on breeding of crops in mid attitude areas. The researchers are working on evaluation and selection of breeding lines adapted to mid attitude and lowland areas. The group has released two white cumin varieties adapted to Amhara region and similar agro ecology.
References
- Abate, D., Dereje, A., & Urga, K. (2003). Medicinal plants and other Useful plant in Ethiopia. Ethiopian health and nutrition research institute.
- Akcura, M., & Kaya, Y. (2008). Nonparametric stability methods for interpreting genotype by environment interaction of bread wheat genotypes (Triticum aestivum L.). Genetics and Molecular Biology, 31(4), 906–16. https://doi.org/10.1590/S1415-47572008005000004
- Bairwa, R., Sodha, R., & Rajawat, B. (2012). Trachyspermum ammi. Pharmacognosy Reviewss, 6, 56–60.
- Becker, H. C. (1981). Correlations among some statistical measures of phenotypic stability. Euphytica, 30(3), 835–840. https://doi.org/10.1007/BF00038812
- Becker, H. C., & Leon, J. (1988). Stability analysis in plant breeding. Plant Breeding, 101(1), 1–23. https://doi.org/10.1111/j.1439-0523.1988.tb00261.x
- Branco, L. C. (2015). Phenability: Nonparametric stability analysis (R package version 2.0). https://CRAN.R-project.org/package=phenability.
- Dwivedi, S., Mishra, R., & Alava, S. (2012). Phytochemistry: Pharmacological studies and traditional benefits of Trachyspermum ammi (Linn). Sprague. International Journal of Pharmacy and Life Sciences, 3, 1705–1709.
- FAOSTAT. (2018). http://fao.org/faostat.
- Flores, F., Moreno, M. T., & Cubero, J. I. (1998). A comparison of univariate and multivariate methods to analyze G × E interactions. Field Crops Research, 56(3), 271–286. https://doi.org/10.1016/S0378-4290(97)00095-6
- Fox, P. N., Skovmand, B., Thompson, B. K., Braun, H. J., & Cormier, R. (1990). Yield and adaptation of hexaploid spring triticale. Euphytica, 47(1), 57–64. https://doi.org/10.1007/BF00040364
- Friew, M. (2002). Simultaneous selection for high yield and stability in common bean (Phaseolus vulgaris L.) genotypes. The Journal of Agricultural Science (Cambridge), 138, 249–253.
- GenStat. (2015). GenStat for Windows (18th ed.). VSN International.
- Girma, H., Habetewold, K., & Haimanot, M. (2016). Spices research achievements, challenges, and future prospects in Ethiopia. Academic Research Journal of Agricultural Science and Research, 4, 9–17.
- Heidaria, E. F., Rahimmalek, M., Mohammadia, S., & Ehtemam, M. H. (2016). Genetic structure and diversity of ajowan (Trachyspermum ammi) populations based on molecular, morphological markers, and volatile oil content. Industrial Crops and Products, 92, 186–196. https://doi.org/10.1016/j.indcrop.2016.08.014
- Hintsa, G., & Abay, F. (2013). Evaluation of bread wheat genotypes for their adaptability in wheat growing areas of Tigray Region, Northern Ethiopia. Journal of Biodiversity and Endangered Species, 1, 100–104.
- Huehn, M. (1979). Beitrage zur erfassung der phanotypischen stabilitat. EDV Medicine and Biology, 10, 112–117.
- Huehn, M. (1990). Non-parametric measures of phenotypic stability: Part1. Theory. Euphytica, 47, 189–194.
- Hussein, M. A., Bjornstad, A., & Aastveit, A. H. (2000). SAS G × E STAB: A SAS program for computing genotype × environment stability statistics. Agronomy Journal, 92(3), 454–459. https://doi.org/10.2134/agronj2000.923454x
- Kang, M. S. (1988). A rank-sum method for selecting high yielding, stable corn genotypes. Cereal Research Communications, 16, 113–115.
- Kang, M. S. (1990). Understanding and utilization of genotype-by-environment interaction in plant breeding. In M. S. Kang (Ed.), Genotype-by-environment, interaction and plant breeding (pp. 52–68). Louisiana State University, Department of Agronomy, Baton Rouge.
- Kaya, Y., & Turkoz, M. (2016). Evaluation of genotype by environment interaction for grain yield in durum wheat using non-parametric stability statistics. Turkish Journal of Field Crops, 21(1), 51–59.
- Magari, R., & Kang, M. S. (1993). Genotype selection via a new yield-stability statistic in maize yield trials. Euphytica, 70(1–2), 105–111. https://doi.org/10.1007/BF00029647
- Ministry of Agriculture and Natural Resources. (2017). Crop variety registration: Plant variety release, protection and seed quality control department. Addis Ababa, Ethiopia. Bull, 20.
- Mohammadi, R., Abdulah, A., Haghparast, R., & Armion, M. (2007a). Interpreting genotype × environment interactions for durum wheat grain yields using nonparametric methods. Euphytica, 157(1–2), 239–251. https://doi.org/10.1007/s10681-007-9417-3
- Mohammadi, R., Abdulahi, A., Haghparast, R., Aghaee, M., & Rostaee, M. (2007b). Nonparametric methods for evaluating of winter wheat genotypes in multi environment trials. World Journal of Agricultural Sciences, 3, 137–242.
- Mohammadi, R., Aghaee, M., Haghparast, R., Pourdad, S. S., Rostaii, M., Ansari, Y., Abdolahi, A., & Amri, A. (2009). Association among non-parametric measures of phenotypic stability in four annual crops. Middle Eastern and Russian Journal of Plant Science and Biotechnology, 3, 20–24.
- Mohammadi, R., & Ahmed, A. (2013). Genotype x environment interaction and genetic improvement for yield and yield stability of rainfed durum wheat in Iran. Euphytica, 192(2), 227–249. https://doi.org/10.1007/s10681-012-0839-1
- Mohammadi, R., & Amri, A. (2008). Comparison of parametric and non-parametric methods for selecting stable and adapted durum wheat genotypes in variable environments. Euphytica, 159(3), 419–432. https://doi.org/10.1007/s10681-007-9600-6
- Nassar, R., & Huehn, M. (1987). Studies on estimation of phenotypic stability: Tests of significance for nonparametric measures of phenotypic stability. Biometrics, 43(1), 45–53. https://doi.org/10.2307/2531947
- Roostaei, M., Mohammadi, R., & Amri, A. (2014). Rank correlation among different statistical models in ranking of winter wheat genotypes. The Crop Journal, 2(2–3), 154–163. https://doi.org/10.1016/j.cj.2014.02.002
- Sabaghnia, N., Dehghani, H., & Sabaghpour, S. H. (2006). Nonparametric Methods for Interpreting Genotype × Environment Interaction of Lentil Genotypes. Crop Science, 46(3), 1100–1106. https://doi.org/10.2135/cropsci2005.06-0122
- SAS Institute. (2002). SAS/STAT User’s Guide (Vol. 9, 4th ed.). SAS Inst.
- Segherloo, A. E., Sabaghpour, S. H., Dehghani, H., & Kamrani, M. (2008). Non-parametric measures of phenotypic stability in chickpea genotypes (Cicer arietinum L.). Euphytica, 162(2), 221–229. https://doi.org/10.1007/s10681-007-9552-x
- Shah, S. H., Shah, S. M., Khan, M. I., Ahmed, M., Hussain, I., & Eskridge, K. M. (2009). Nonparametric methods in combined heteroscedastic experiments for assessing stability of wheat genotypes in Pakistan. Pakistan Journal of Botany, 41(2), 711–730.
- Shukla, G. K. (1972). Some aspects of partitioning genotype environmental components of variability. Heredity, 29(2), 237–245. https://doi.org/10.1038/hdy.1972.87
- Steel, R. G. D., & Torrie, J. H. (1980). Principles and procedures of statistics. McGraw Hill Book Company, NY.
- Tamene, T., Gemechu, K., Tadese, S., & Mussa, J. (2015). Yield stability and relationships among stability parameters in faba bean (Vicia faba L.) genotypes. The Crop Journal, 3(3), 258–268. https://doi.org/10.1016/j.cj.2015.03.004
- Thennarasu, K. (1995). On certain non-parametric procedures for studying genotype-environment interactions and yield stability [PhD Thesis]. PJ School, IARI
- Tomar, P., & Malik, C. (2014). Botanycultivation chemical constituents and genetic diversity in Trachyspermum ammi. L. an aromatic seed spice. LS- International Journal of Life Sciences, 3, 114–123.
- Truberg, B., & Huehn, M. (2000). Contributions to the analysis of genotype x environment interactions: Comparison of different parametric and non-parametric tests for interactions with emphasis on crossover interactions. Journal of Agronomy and Crop Science, 185(4), 267–274. https://doi.org/10.1046/j.1439-037x.2000.00437.x
- Yan, W., & Kang, M. S. (2003). GGE-biplot analysis: A graphical tool for breeders, geneticists, and agronomists. CRC Press.
- Yong-jian, L., Chuan, D., Meng-liang, T., Er-liang, H., & Yubi, H. (2010). Yield stability of maize hybrids evaluated in maize regional trials in southwestern China using nonparametric methods. Agricultural Sciences in China, 9(10), 1413–1422. https://doi.org/10.1016/S1671-2927(09)60232-7
- Zarshenas, M. M., Moein, M., Samani, S. M., & Petramfar, P. (2014). An overview on ajwain (Trachyspermum ammi) pharmacological effects; modern and traditional. Journal of Nursing Researc, 14(1).