
 ?Mathematical formulae have been encoded as MathML and are displayed in this HTML version using MathJax in order to improve their display. Uncheck the box to turn MathJax off. This feature requires Javascript. Click on a formula to zoom.
Abstract
This study assessed how socioeconomic and attitudinal factors affect adoption of Non-Transgenic Soybean in Zambia. The study used quantitative primary data collected from 160 smallholder farming households in Chipata district. The Double Hurdle model was used to analyse both the factors determining adoption and the extent of adoption, while factor analysis was used to identify latent dimensions underlying the different variables that measured respondents’ attitudes towards Non-Transgenic soybean adoption and production. Parametric results showed that the decision to adopt Non-Transgenic soybean was affected by the age of the farmer, household size, livestock ownership and access to agricultural extension services of the households. Results further showed that the decision on the extent of adoption was largely influenced by presence of off-farm income, land size, livestock ownership, and access to credit services, gender and the marital status of the respondent. Further, Factor analysis results pointed out that the key attitudes were related to improved seed access, output pricing and marketing, as well as gender mainstreaming issues during promotion of production, marketing and consumption of soybean. The study concluded that Non-Transgenic Soybean adoption in Zambia is low despite the numerous socioeconomic prospects of the crop. The study further established that farmer attitudes towards the crop are negative. Hence there is minimal contribution of the crop to poverty alleviation and malnutrition. There is thus need for institutional strengthening in order to improve smallholder farmer access to information, credit services, extension services and access to land.
PUBLIC INTEREST STATEMENT
Challenges such as low soil fertility, poor maize varieties and vulgarize of climate change in Zambia have made it difficult for smallholder farmers to profitably produce the crop, resulting in increased poverty levels of over 80 percent. To cope with these challenges, smallholder farmers diversified into traditional and high value crops as alternative sources of livelihood. Recognizing the high nutritive and economic potential that Non-Transgenic Soybean possess, government identified it as a crop with enormous prospects of uplifting living standards for rural households. However, the number of farmers adopting and growing the crop has remained very low. No empirical study has been done in the study area to understand factors affecting Non-Transgenic soybean adoption and commercialization. Therefore this study will contribute to minimizing the death of knowledge on Non-Transgenic soybean adoption and commercialization, thus improving the crop’s contribution to poverty reduction.
Competing Interests
The authors declares no competing interests.
1. Introduction
World over, the popularity of Soybean (Glycine max) has increased over millennia due to its flexibility of use as food and its reliability as a rich source of protein. Development of improved and better yielding varieties and reduced production costs have improved its competitiveness amongst other arable crops (Islas-Rubio & Higuera-Ciapara, Citation2002). The crop has mainly been grown due to its economic and nutritive value. According to Thoenes (Citation2016), soybean accounts for over 60 percent of the world’s output of vegetable and animal meal production and accounts for over 20 percent of vegetable oil production. For major producing countries such as Brazil, Argentina, Paraguay, United States of America [USA], India and China, soybean has contributed considerably to Gross Domestic Product (GDP). In these countries, evidence shows that the crop improved living standards for the smallholder farmers particularly women and children (FAO, Citation2018). Further, introduction of soybean in these countries led to enhanced crop production and increased profitability from rotation due to its ability to replenish soils (Paroda, Citation1999).
In Central Africa, Zambia has witnessed a growing demand for Non-Transgenic Soybean in order to counter the major national challenges of food insecurity and malnutrition. Defined as the lack of access to adequate and nutritious food, it was estimated that by 2018 over 67 percent of people in Zambia were food insecure (FAO, Citation2018). The scenario is worse for smallholder rural farming communities that subsist on agriculture for livelihood. This is because at it is very least, food insecurity is indicative of malnutrition and high mortality rates (Kadiyala & Rawat, Citation2012). It is thus not surprising that on average over 40 percent of children less than 5 years are estimated to be stunted (USAID, Citation2018). With an estimated 70 percent of the population living in rural areas and dependent on smallholder agriculture, it’s inevitable that the pathway out of these challenges will depend highly on better use of this agriculture potential.
The popularity of Non-Transgenic Soybean in Zambia grew with its growing demand locally and regionally particularly in the livestock industry. The poultry sector which accounted for 89 percent of Non-Transgenic Soybean consumption in 2010 was poised to grow by an average 20 percent annually for the next decade. In addition, human consumption mostly in the form of chunks and oil, accounting for the remaining 11 percent was also estimated to grow by 8 percent annually till 2020 (Hichaambwa et al., Citation2014). This anticipated ever increasing demand for the crop promised better prospects for farmers to adopt Non-Transgenic Soybean production. However, despite these lucrative prospects, the Soybean sub-sector remains dominated by commercial producers with smallholders producing only an average of 15 percent of the crop annually. In addition, productivity of smallholder producers is low (0.9 Metric tonnes per hectare) compared to their commercial counterparts with 2.6 Metric tonnes per hectare.
It is clear from the foregoing that despite the probable benefits, the number of smallholder farmers who have adopted and are growing the crop remains low. Further, in order to realize the probable benefits, it is imperative that farmers adopt the crop and make it part of their cropping system. Past studies have identified various socio-economic and institutional factors that affect adoption of new technologies in sub-Saharan Africa (Miruts, Citation2016; Shannon & Kalala, Citation1994; Tamimie, Citation2017). These factors included access to extension services, age and experience of the farmer, access to information, availability of labour, yield and maturity period (variety potential), education levels of the farmers and the net benefits from the technologies. However, no empirical study has been done in Zambia to understand the specific factors peculiar to the country. In addition, a factor most times ignored in many adoption studies is the effect that farmer attitudes pose towards adoption of new crop technologies. Shannon and Kalala (Citation1994), proposed that the inability of people in sub-Saharan Africa to consume soybean due to attitudinal factors such as unacceptable taste, slow cooking time, high labour requirements and beliefs that the crop is poisonous and might cause sterility negatively affects adoption of the crop. The objective of this research is to explore the socioeconomic, institutional and attitudinal factors that influence Non-Transgenic Soybean adoption in Zambia.
2. Methodology
2.1. Theoretical framework of technology adoption
According to economic theory of household decision making, households will choose to allocate their resources such as skill, labour and equipment to choices that promise the highest satisfaction. This implies that household decisions on technology adoption will be largely affected by consumption decisions (consumer preferences) as well as the socioeconomic factors affecting them. Under these conditions, a household decides whether to adopt an agricultural innovation or not. Many adoption studies have used the Tobit (Tobin, Citation1958), to analyse the determinants of technology adoption and the extent of adoption. Being an extension of the Probit model, the Tobit was developed to deal with the problem of censored dependent variables and is used for analysis under the assumption that the two decisions (adoption and extent of adoption) are affected by the same factors (Greene, Citation2003). This assumption is sometimes limiting as literature has shown that the factors affecting the two decisions in most cases are different. Due to these statistical inadequacies, recent studies have opted to use the Double Hurdle model for analysis (Beshir et al., Citation2012; Eakins, Citation2014; Mongoso et al., Citation2015; Musah, Citation2013).
2.2. Empirical model specification and variables
Based on the works of Beshir et al. (Citation2012), the double hurdle model is a parametric generalization of the Tobit model in which two separate stochastic processes determine the decision to adopt and the level of adoption of technology. The Double-Hurdle model has an adoption (D) decision with an equation as shown in EquationEquation 1(1)
(1) :
Where is a latent variable that takes the value 1 if a farmer adopts Non-Transgenic Soybean and zero otherwise,
is a vector of household characteristics and α is a vector of parameters. The extent of Non-Transgenic Soybean adoption (Y) decision has an equation as in EquationEquation 2
(2)
(2) :
Where is the observed amount of Non-Transgenic soybean harvested by the sampled households in the study year of 2015/2016,
is a vector of household socioeconomic characteristics and
is a vector of parameters. The double hurdle model is estimated using maximum likelihood technique with the log likelihood given as follows in EquationEquation 3
(3)
(3) :
It can be noted that the standard Tobit model is actually a nested version of the Cragg model when is equal to 1 (i.e. the log likelihood of the Tobit equates that of the Cragg model when there is no adoption (participation) equation). Thus the Cragg model is effectively a Tobit model that allows for estimates of the adoption equation to be made separately from the extent of adoption equation. Assuming independence between the error terms
and
the double hurdle model is equivalent to a combination of the Probit (EquationEquation 1
(1)
(1) ) and the truncated regression (EquationEquation 2
(2)
(2) ) models. Further, estimates of the Double Hurdle cannot be expressed directly like is done with a linear regression model. Marginal effects are computed and used to estimate the impact of the regressors on the dependent variable. This involves decomposing the unconditional mean into the effect on the probability of adoption and the effect on the conditional level of adoption and differentiating these components with respect to each explanatory variable. The conditional mean can be written as shown in EquationEquation 4
(4)
(4) :
The probability of adoption and the extent of adoption conditional on participation are computed as shown in EquationEquations 5(5)
(5) and Equation6
(6)
(6) below respectively (Jensen & Yen, Citation1996; Yen & Jones, Citation1997):
For the continuous explanatory variables, these marginal effects are used to calculate elasticities at the sample means, while for discrete categorical variable; the marginal effects are used to calculate percentage changes in the dependent variable when the variable shifts from zero to one assuming all other factors are constant. Economic theory has not provided explicit guidance on which explanatory variable to include in the first hurdle and the second hurdle of the double hurdle models. Including the same set of regressors in both models makes it difficult to identify the parameters of the model correctly and so exclusion restrictions must be imposed (Jensen & Yen, Citation1996; Jones, Citation1992). A generally applied assumption is that the first hurdle is a function of non-economic variables that determine households’ decision to participate. As such, variables such as off-farm income were excluded from the first hurdle. Therefore, the following dependent and independent variables were included in the adoption and extent of adoption equations in the model and specified as shown in Table .
Table 1. Definition of variables hypothesized to influence adoption and extent of adoption of non-transgenic soybean in Zambia
2.3. Analysis of attitudes affecting non-transgenic soybean adoption
Farmers’ attitudes towards agricultural technology have a huge bearing on their ability to adopt and intensify the technologies. A study by Adesina (Citation1993), showed that farmer’s perceptions of characteristics of modern rice varieties significantly influenced their decision to adopt. Similarly, in a study on adoption of fish farming, farmers’ perceptions influenced their ability to adopt (Wandji et al., Citation2012). In most typical attitude analysis studies, two main approaches are used to assess attitudes. These include descriptive and inferential statistics. The descriptive statistics include summing up the responses and obtaining a score or using the percentage of respondents in a given Likert scale category or scale average for the particular question responses (Shibia, Citation2010). Other scholars have used factor analysis for attitudinal analysis (O’Shea et al., Citation2018). Factor analysis simplifies data analysis by reducing an excessive number of observed variables to allow for a meaningful summarization of data for analysis. Factor analysis also provides a practical, standardized and straightforward method of extracting relevant information from confusing data sets, reducing the dimensionality of the data set and identifies meaningful underlying variables (Paul et al., Citation2013). The Factor analysis approach uses a list of factor loadings or eigenvalues of the correlation matrix where a factor loading represents the amount of variance captured by a given component. The loadings give an indication of how much a given variable has contributed to a given factor and hence its relative importance to the factor. At the end of the analysis, when all the variance in the component has been accounted for, the last step is to determine how many components should be retained for interpretation (Young & Pearce, Citation2013). The general rule is that components capturing low amounts of variance are not retained.
In this study, a combination of descriptive and inferential statistics was used to examine household’s attitudes towards soybean adoption. Descriptive statistics (percentages and mean scores) were used to describe respondents’ attitude towards soybean. On the other hand, factor analysis was used to identify latent dimensions underlying the different variables that measured respondents’ attitudes towards Non-Transgenic soybean adoption.
2.4. Data sources and sampling
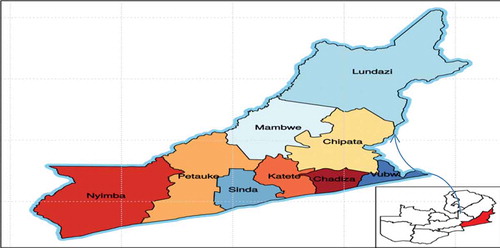
The study was conducted in Chipata district in eastern province of Zambia (13°38ʹ43.0”S, 32°38ʹ47.0”E). The district is located in agro ecological zone II; an area that receives between 800 mm and 1000 mm of rainfall. This amount of rainfall makes the area suitable for cultivation of most arable crops including Soybean, Maize, and Sunflower, Groundnuts, beans and Cotton among others. As such, the main economic activity in the district is agriculture. The district was intentionally selected for the study because it lies within eastern province; which has highest smallholder farmer population of over 1.5 million in the country. In addition, the district is the third largest in eastern province; has shown a high adoption of improved technologies and received a lot of assistance from research, development organizations and the government (Manda, Citation2016). The district has a population of over 437,000 people (Tembo & Sitko, Citation2013). Of these, 173,782 are farming households comprising 90,038 males and 83,744 females (MOA, Citation2016). Figure shows a Map of Zambia, Chipata District of Eastern Province.
Figure 1. Source: Google maps (2019).
2.5. Sampling procedures
In terms of agricultural activities, districts in Zambia are first divided into agricultural blocks. The blocks are further divided into agricultural camps in which you find several villages. An agricultural block refers to the highest level of delineation of a district were areas with similar geographical and crop production characteristics are grouped together. An agricultural camp is the smallest unit of delineation at district level which is usually divided to make it easy and convenient to be manned by a single field agricultural extension officer. The number of camps within a block and the number of villages within a camp as well as farmer population varies from one block and camp to the other. Specifically, Chipata district has eight (8) blocks, fifty-eight (58) agricultural camps and an average of over thirty (30) villages per camp. The study targeted smallholder farmers in the selected villages within the four (4) randomly sampled agricultural camps and four (4) randomly sampled agricultural blocks respectively. Primary data collected using structured household interview questionnaires was used for the study. In addition, eight (8) key informant interviews were also conducted with local leadership at village level, agricultural camp level and officials from the Ministry of Agriculture at district level. In order to ensure that a representative sample was selected, multi-stage random sampling was used at agricultural block, agricultural camp, village and individual level to select sample households.
Fisher (Citation1998), formula was used to determine a required sample size of 160 farmers representing fourty (40) farmers from each sampled agricultural camp. To determine this sample size it was assumed that the farmer population is normally distributed, with five (5) percent level of statistical significance. It was further assumed that at least twelve (12) percent of the farmer households cultivate Non-Transgenic Soybean as advised by officials at the district agriculture office. Adopters in this study were defined as farmers who grew Non-Transgenic Soybean in the 2015/16 agricultural season. Based on this definition, twenty (20) adopters and twenty (20) non-adopters were randomly sampled from a sampling frame of Non-Transgenic Soybean growers and non-growers provided by the district agricultural office. The resultant sample was ultimately selected as shown in Table below.
Table 2. Sampled households by agricultural camp
2.6. Data collection and analysis
Initially, key informant interviews were carried out at village, camp and district level to understand the social and cultural aspects of the district. Thereafter, individual household interviews were conducted with sampled households to generate quantitative data on demographic, socioeconomic and attitudinal aspects of the households. Once collected, the data was coded, entered in excel, cleaned and exported to STATA version fifteen (15) for analysis.
3. Results and discussion
3.1. Socioeconomic and institutional characteristics of non-transgenic soybean adopters and non-adopters
Table shows the demographic and socioeconomic characteristics of Non-Transgenic Soybean adopting and non-adopting households in the study area during the 2015/2016 agricultural season. The distribution shows that adopters had lower levels of average education of 6.64 years compared to non-adopters with 6.67 years. This could be attributed to the fact that the majority of the adopters were older and experienced farmers who had limited access to education facilities in the past decades. The average age among adopters was 45.01 years and 43.68 years among the non-adopters. The results indicated that the youthful farmers with minimal farming experience seldom engage in new crops whose market opportunities are not assured. Survey results also showed that although Non-Transgenic soybean is generally regarded as a “female” crop in the area, the majority 39 percent of the adopters were male. This indicates that males are slowly replacing females in growing Non-Transgenic soybean due to the increasing economic prospects for the crop. Further, males have a high tendency of taking risks compared to women when it comes to engaging into new cropping activities. Since soybean is a labour intensive crop, larger households with an average size of six persons adopted the crop compared to non-adopting counterparts with five persons. Descriptive results also showed that over 81 percent of the respondents were married comprising 46 percent adopters and 35 percent non-adopters. It was evident during data collection that farmers growing larger areas of soybean were married with large family sizes which could be attributed to availability of family labour.
Table 3. Demographic characteristics of study population
Further, descriptive assessment showed that adopters owned more land (8.14 hectares) compared to non-adopters (7.93 hectares). The larger land size made it easier and flexible for the adopters to explore emergent crop types as they diversified their crop production. However, on average, 1.89 hectares was actually allocated to Non-Transgenic soybean, harvesting 1.6 metric tonnes from which 1.5 metric tonnes was sold at ZMW 3,800 per kilogram. Access to institutional factors such as extension services, credit and membership to organizations are crucial factors as they support the sector and also act as avenues through which farmers are informed of existing opportunities within the agricultural sector. The distribution in Table showed that 48 percent of adopters and 35 percent of non-adopters had access to extension services in the reference year. This could be indicative of the fact that adopters were more informed about new trends in the agricultural sector compared to non-adopters. The data also showed low access to credit for both categories of farmers (11 percent of adopters and nine percent of non-adopters) implying that adopters generally had better credit access which allowed them to invest.
A majority (60 percent) of the respondents (32 percent adopters, 28 percent none adopters) had membership to farmers organizations. When checked to see if these groups had any influence on Non-Transgenic soybean production, 152 respondents said that there was no presence of soybean farmer groups in the area. The remaining eight respondents indicated that the soybean groups helped them by improving their access to soybean inputs while other minimal benefits included access to marketing information and production technology.
Markets are the key component of development in all agricultural value chains. They are crucial in promoting access to inputs for production as well as access to output markets for disposal of agricultural produce. As shown in Table , farmers took less time to walk to output markets to sell their produce (56 minutes), than to walk to input markets to purchase their inputs (166 minutes). It is also evident from the results that non-adopters it took more time to access input markets (171 minutes) than the adopters who took 161 minutes. Further assessment of the descriptive results revealed that the majority (76 percent) of the respondents sold their Non-Transgenic soybean to local traders within Chipata district. A considerable percentage (17%), sold to traders from distant markets while a minority (five and two percent) sold to government and traders from neighbouring towns respectively.
Technology is critical in improving return per unit of inputs as well as in reducing the cost of production. In reference to soybean production, critical technology includes improved seed, inoculum and herbicides. Survey results showed that the majority (78 percent) of the adopters had access to improved soybean seed varieties while the rest used recycled seed. Another 19 percent had access to inoculum while less than 1 percent had access to organic fertilizers and herbicides. Overall, only 0.08 percent had access to all the critical inputs. The low access was largely attributed to the higher prices of the inputs and their non-availability. Results further showed that 52 percent of adopters had access to oxen for draught compared to 37 percent among the non-adopters. This situation implies that it is easier for adopters to grow labour intensive crops since they have draught oxen. Moreover, a majority (65 percent) of the adopters had bicycles compared to 51 percent of the non-adopters. When it came to access to information, adopters had more access to radio and phone (57 and 65 percent) compared to their non-adopting counterparts with 48 and 45 percent respectively. Additionally, adopters generated more overall annual income of more than ZMW 28,000 compared to ZMW 13,000 among the non-adopters. This income was a sum of both on-farm and off-farm activities.
3.2. Socio-economic factors determining non-transgenic soybean adoption
In a quest to check the relative importance and direction of influence of the hypothesized variables, the Double Hurdle model was used to assess the effect of the various socio-economic, institutional and demographic factors on Non-Transgenic soybean adoption and the extent of adoption respectively amongst smallholder farmers. The hypothesized variables were first checked for existence of multicollinearity using the Variance Inflation Factor (VIF). VIF shows how the variance of an estimator is inflated by the presence of multicollinearity. A VIF value of less than five indicates absence of multicollinearity (Alauddin & Ngiem, Citation2010). Results showed that all the variables had VIF values were less than five signifying the absence of multicollinearity.
The parametric results of the Double hurdle model are shown in Table . The analyses showed that the overall models were significant (Prob > chi2 = 0.0414 for the Probit and Prob > chi2 = 0.0000 for the Truncated Regression). Further, the log likelihood test statistics for both cases suggested that the models fitted the data well. The results further showed that the decision to adopt soybean was affected by the age, household size, livestock ownership and access to agricultural extension of the respondent. Results further showed that the decision on the extent of adoption was influenced by presence of off-farm income, land size, livestock ownership, and access to credit services, gender and the marital status of the respondent.
Table 4. Factors determining adoption & extent of adoption of non-transgenic soybean among smallholder farmers in Chipata District
Household size in the study was used as a proxy measure of labour availability and had a significant (p < 0.05) and positive relationship with soybean adoption. This implied that the probability of adopting Soybean increased with increase in the size of the household. The finding confirms that for labour intensive crops such as soybean, labour availability is a critical factor for adoption. It is also consistent with Alabi et al. (Citation2014), who while studying the factors affecting adoption and use of agrochemicals concluded that labour availability increased the probability of agrochemical adoption. Other comparable results include Djokoto et al. (Citation2016), Chiputwa et al. (Citation2011), and Asfaw and Shiferaw (Citation2010), who found that larger households had a higher probability of adopting agricultural technologies, varieties and conservation agriculture practices respectively.
Off-farm income was also significant (p < 0.05) and negatively related with the extent of adoption of Non-Transgenic soybean. This result was as expected in that as the income realized from off-farm activities increases, the probability of investing in crop production activities reduces. The possible explanation is that farmers opt to replace crop production with off-farm economic activities. This result was consistent with Alabi et al. (Citation2014), who found that an increase in off-farm income reduced the likelihood of farmers adopting use of agrochemicals noting that higher returns off-farm justified investment when compared to the risks associated with crop production in Africa.
Land availability was significant (p < 0.1) and positively related to the intensity of adoption of Non-Transgenic soybean. The probability of adopting Non-Transgenic Soybean increased with increase in the amount of land a household owned. Land is an important factor in production and the larger the number of hectares produced, the larger the output (Hichaambwa & Jayne, Citation2012). This shows the importance of land availability in enabling households expand the area under production. Comparable results were also found by Handrina and Lwesya (Citation2004), while investigating the factors influencing adoption of Treadle pump irrigation technology in Malawi. The pair concluded that households with large land holdings have a higher potential of increased production, which enable them to invest and gain more from the technology adopted. Access to credit was significant (p < 0.01) and negatively affected the intensity of Non-Transgenic soybean adoption. Increased access to credit services reduced the probability of harvesting more Soybeans. This result was against priori expectations were an increase in credit services is expected to increase intensity of production. Access to credit enables producers to increase the quantity of inputs and other productive assets acquired such as fertilizers and seed which in turn increase output produced (Sindi, Citation2008). However, the cost of accessing credit should be affordable to small holder farmers so they can benefit from the credit services. Thus, when credit is un-affordable it becomes prohibitive to increased crop yields (Moono, Citation2015). A possible explanation is that farmers take credit and invest in other crop enterprises with perceived greater returns than Soybean hence impacting it negatively.
Gender of the respondent significantly and positively influenced (p < 0.01) the extent of adoption of Non-Transgenic soybean production. This implied that compared to females, male smallholder farmers yielded more Soybean. This result was consistent with Beshir et al. (Citation2012), who observed that male farmers had a higher probability of adopting chemical fertilizers compared to their female counterparts. The justification for this is that male farmers might have more access to information and land which are crucial in crop production. Marital status of the respondents was also significant (Married (p < 0.01), Widowed (p < 0.1), Divorced (p < 0.01), Separated (p < 0.05)) and positively affecting the extent of soybean adoption by smallholder farmers. This meant that the marital status of the responded affected the amount of Non-Transgenic soybean which they harvested. Married respondents yielded 792 kilograms, widowed yielded 729 kilograms and the divorced yielded 1,396 kilograms while those separated yielded 756 kilograms. This result is consistent with Dogbe et al. (Citation2013), who found that marital status had implications on access to farm land, control of production resources and marketing of output as well as availability of family labour. This might justify why divorced farmers with more control over their agricultural activities and better access to land yielded more soybean compared to the other marital status categories.
3.3. Analysis of farmers’ attitudes towards adoption of non-transgenic soybean
Farmer attitudes towards farming activities have an effect on their ability to invest their time and resources. The households were asked to rank their opinion on a Likert scale ranging from 1 (strongly disagree) to 5 (Strongly agree) on particular attitudinal dimensions about soybean production, marketing and consumption. Points were added from each statement and divided by the highest sum to calculate a score in percentage terms. For the sake of analysis, the 50 percent mark was assumed to be the boundary for positive and or negative attitude orientation for a specified attitude dimension (Olunga, Citation2013). The attitudinal dimensions were classified into two categories as shown in Table .
Table 5. Attitudes related to non-transgenic soybean production
The first category included attitudes associated with soybean input acquisition and production while the other category involved attitudes associated with soybean marketing and processing. Results in Table showed that 67 and 25 percent of the farmers strongly agreed and agreed respectively that Non-Transgenic soybean seed is expensive to acquire. Another 64 percent agreed that they were willing to invest their time and resources into soybean production. This was because despite the expensive seed, the crop had higher returns on the market as evidenced by 61 percent of the farmers who agreed that soybean contributes significantly to their livelihoods.
Regarding knowledge on production aspects, 48 percent of the respondents disagreed that they did not know how to grow the crop. This was consistent with 51 percent who equally disagreed that Non-Transgenic soybean yields were low. These results were indicative that Non-Transgenic soybean was a significant crop in the cropping system of the area. The results further indicated that there were some institutional challenges that made the crop unattractive as evidenced by 26 and 36 percent of respondents who agreed and strongly agreed that the crop lacks institutional support. When it came to marketing and processing, 51 percent agreed while 34 percent strongly agreed that s Non-Transgenic soybean is a profitable crop. Another 49 percent agreed that the crop was important for food security and that it was also a reliable source of protein (45 percent). Attitudes were however neutral on the importance of gender in production, marketing and consumption of the crop.
Assuming that there could be some common but latent factors causing the variations in the attitudes of the respondents towards Non-Transgenic soybean production, marketing and consumption, as measured by their responses to the asked attitudinal dimensions, Factor analysis was used to identify the latent factors with an aim of reducing the dimensions to a few that accurately reflected the relationships among the inter-related dimensions. An Eigen value greater that one rule was used to identify the factors. The variables with high factor loadings were grouped together and named. Considering that factor loading of 0.5 or more are generally taken to be normal and significant, a solution of three (3) factors were retained and accounted for 79.3 percent of the variance in the model.
Prior to extraction of factors, it is recommended that a Kaiser-Meyer-Olkin (KMO) test is conducted to ascertain sampling adequacy for the methodology. The KMO index ranges from 0 to 1 with 0.5 considered suitable for factor analysis. The KMO index, in particular, is recommended when the cases to variable ratio are less than 1:5 (Brett Williams, Citation2010). Thus, a KMO value of 0.61 realized in the study made use of factor analysis appropriate. Survey results in Table showed two variables associated with use of improved seed and crop diversification were loaded on factor 1 with factor loadings of 0.51 and 0.59 respectively for the two variables. Factor one accounted for 32 percent of the variance and was named seed access and crop diversification. Factor 1 symbolized the importance of promoting improved soybean seed as well as the need to promote Non-Transgenic soybean production as a component of a crop production package to ensure diversification in production while reducing risks associated with crop failure.
Table 6. Results of exploratory factor analysis
The second factor accounting for 26 percent of the variance was called soybean pricing and marketing. The factor comprised of variables associated with soybean prices and marketing mechanisms which had 0.5 and 0.79 loadings respectively. The factor was indicative of the importance of efficient marketing and pricing of produce in promoting increased production especially that very little proportions of Non-Transgenic soybean are consumed at household level. The third factor was named Gender relations and food processing and accounted for 21 percent of variance. The factor highlighted the importance of soybean to men and women with factor loadings of 0.71 and 0.70 respectively. This finding emphasized the need to mainstream gender issues in soybean promotion as some gender and cultural related factors had both positive and negative effects in production, marketing and consumption of Non-Transgenic soybean. Overall, the model explained 79 percent of the variance amongst the variables. Factor analysis results pointed out the key attitudes related to improved seed access, pricing and marketing and gender mainstreaming during promotion of production, marketing and consumption of Non-Transgenic soybean.
4. Conclusions and recommendations
This study assessed factors affecting household’s decisions to adopt and intensify Non-Transgenic Soybean production as well as establishes fundamental attitudes that influence farmer behaviour towards Non-Transgenic soybean production in Chipata district of eastern Zambia. The study used data from 160 households in four agricultural camps. The sites was selected because of its high agricultural potential and also because past agricultural interventions targeting legume intensification such as the USAID funded feed the future development initiative were implemented in the area. Regression techniques were used to assess adoption. Double Hurdle regression analysis was particularly used to determine both the factors that influence the adoption decision as well as the extent of adoption. Thereafter, Factor analysis was used to identify the latent factors that accurately reflected the relationships among the identified inter-related attitudinal dimensions.
The study established that the factors that significantly affected Non-Transgenic soybean adoption included the Age of the household, household size, ownership of livestock and the respondents’ access to agricultural extension services. Further, size of available land, presence of off-farm income, ownership to livestock, access to agricultural credit services, the gender and marital status of the farmer significantly influenced the extent of Non-Transgenic soybean adoption. The overall results on the attitude of farmers towards Non-Transgenic soybean adoption were negative. The attitudes were associated with lack of diversity in the local diet which made Non-Transgenic soybean nutritionally unimportant. Households also exhibited little knowledge on Non-Transgenic soybean processing options into food probably due to the low education status associated with the majority of the respondents. The negative attitudes were also attributed to higher input and low output prices.
The study concluded that overall household characteristics related to demographics such as age and gender as well household characteristics related to productive resources such as access to labour, access to land; and institutional factors such as access to agricultural extension and credit services are critical determinants in adoption of Non-Transgenic Soybean among smallholder farmers. This implies that in order to enhance adoption, there is need to revise policies governing allocation of land in order to make it more available to smallholder farmers for growing of emergent crops and scaling up production. Policy makers also need to engage the private sector in order to reduce the cost of agricultural credit. This will enhance farmer’s access to crop inputs and labour saving technologies through subsidized inputs or low interest credit. There is also need to enhance access to agricultural extension by employing more agricultural extension agents in order to make the service more available to farmers. The study further concluded that farmer attitudes have a huge impact on Non-Transgenic soybean adoption. One key attitude was that farmers did not feel confident in growing Non-Transgenic Soybeans suggesting a knowledge and skill gap. This could be plugged up through bottom-up extension approaches such as promotion of group learning and learning through Farmer Field Schools. There is also need to fully understand farmer attitudes before introducing new crops and technologies. This ensures that the introduced crops conform to farmer needs and aspirations which enhance adoption. Finally, the study also recommends that there is need for further research to ascertain why land is a significant constraint to crop despite having huge expanses of unexplored land in the country.
Acknowledgements
The authors are also grateful to all the farmers from whom the data used in this survey was collected. Special thanks go to Ministry of Agriculture staff in Chipata district for their assistance during data collection.
Disclosure statement
The authors declare that there is no conflict of interest in this paper.
Additional information
Funding
Notes on contributors

Ziko Kahenge
Ziko Kahenge is a Senior Agriculture Officer, Ministry of Agriculture, Zambia. His research interest includes themes on agriculture extension and technology adoption.
Muendo Kavoi
Muendo Kavoi (PhD) is an Associate Professor of Agriculture Economics at Department of Agricultural and Resource Economics, Jomo Kenyatta University of Agriculture and Technology. His research interest is on agriculture, food security and agriculture value chains in Arid and Semi-Arid Lands.
Nhamo Nhamo
Nhamo Nhamo (PhD) is an Associate Professor of Soil Science at Zimbabwe Open University. His research interest is on plant nutrition, soil ecology, natural resource management, farming systems and crop simulation modelling.
References
- Abdulai, S., Zakariah, A., & Donkoh, S. A. (2018). Adoption of rice cultivation technologies and its effect on technical efficiency in Sagnarigu District of Ghana. Cogent Food & Agriculture, 4(9). https://doi.org/10.1080/23311932.2018.1424296
- Adesina, A. A. (1993). Technology characteristics, farmer perceptions and adoption decisions: A Tobit model application in Sierra Leone. 9, 297–17.
- Alabi, O. O., Territory, F. C., Lawal, A. F., Services, E., Coker, A. A., Technology, E., … Commission, N. P. (2014). Probit model analysis of smallholder’s farmers decision to use agrochemical inputs in Gwagwalada and Kuje area councils of federal capital territory, Abuja, Nigeria. International Journal of Food and Agricultural Economics, 2(1), 85–93. https://doi.org/10.1073/pnas.1011013108
- Alauddin, M., & Ngiem, H. S. (2010). Do instructional attributes pose multicollinearity problems? An Emprical exploration. Economic Analysis and Policy, 40(3), 351–361.
- Ali, E. B., Awuni, J. A., Danso-abbeam, G., Baba, E., Awuni, J. A., & Danso-abbeam, G. (2018). Cogent Food & Agriculture Determinants of fertilizer adoption among smallholder cocoa farmers in the Western Region of Ghana Determinants of fertilizer adoption among smallholder cocoa farmers in the Western Region of Ghana. Cogent Food & Agriculture, 4(1), 1–10. https://doi.org/10.1080/23311932.2018.1538589
- Asfaw, S., & Shiferaw, B. (2010). Agricultural technology adoption and rural poverty : Application of an endogenous switching regression for selected East African Countries. In Joint 3rd African association of agricultural economists (AAAE) and 48th Agricultural Economists Association of South Africa (AEASA) Conference, Cape Town, South Africa (pp. 19–23). Cape Town.
- Bekele Shiferaw, H. T. (2007). Structure and functioning of chickpea markets in Ethiopia : Evidence based on analyses of value chains linking Smallholders and Markets (No. 6).
- Beshir, H., Emana, B., Kassa, B., & Haji, J. (2012). Determinants of chemical fertilizer technology adoption in North eastern highlands of Ethiopia : The double hurdle approach. Journal of Research in Economics and International Finance, 1(August), 39–49.
- Brett Williams, D. (2010). Exploratory f actor a nalysis: A five - step g uide for n ovices. Journal of Emergency Primary Care, 8(3), 1–13. of C. E. H. and P., Medicine, F. of, And, N., Sciences, H., Monash University, M.), Of, A. O. (Centre for the A., … Melbourne)
- Chiputwa, B., Langyintuo, A. S., & Patrick, W. (2011). Paper accepted for the 2011 meeting of the Southern agricultural economics association (SAEA) in Texas, USA, Feb 5- 8.
- Djokoto, J. G., Owusu, V., Awunyo-vitor, D., Djokoto, J. G., Owusu, V., & Awunyo-vitor, D. (2016). Adoption of organic agriculture : Evidence from cocoa farming in Ghana Adoption of organic agriculture: Evidence from cocoa farming in Ghana. Cogent Food & Agriculture, 52. doi:https://doi.org/10.1080/23311932.2016.1242181
- Dogbe, W., Etwire, P. M., Martey, E., Etwire, J. C., Baba, I. I. Y., & Siise, A. (2013). Economics of soybean production : Evidence from saboba and chereponi districts of Northern Region of Ghana. 5(12), 38–46. https://doi.org/10.5539/jas.v5n12p38
- Eakins, J. (2014). Application of the Double Hurdle Model to Petrol and Diesel Household Expenditures in Ireland (145). United Kingdom.
- FAO. (2018). Rome declaration on world food security and world food summit plan of action rome declaration on world food security. In World Food Summit.
- Fisher, L. D. (1998). Self-designing clinical trials. Journal of Statistical in Medicine, 17(14), 1551–1562. https://doi.org/10.1002/(SICI)1097-0258(19980730)17:14<1551::AID-SIM868>3.0.CO;2-E
- Greene, W. (2003). Econometric analysis (5th ed.). Mcmillan.
- Handrina, A., & Lwesya, A. (2004). Impact of treadle pump adoption on food security. Lilingwe University of Agriculture.
- Hichaambwa, M., Chileshe, C., Chimai-mulenga, B., & Mwiinga-ngcobo, M. (2014). Soybean value chain and market analysis. Lusaka.
- Hichaambwa, M., & Jayne, T. S. (2012). Smallholder commercialization trends as affected by land constraints in Zambia : What are the policy implications? Indaba Agricultural Policy Research Institute POLICY BRIEF, (Lusaka, Zambia, April, 2012). 61
- Islas-Rubio, A., & Higuera-Ciapara, I. (2002). Soybeans post-harvest operations.
- Jensen, H., & Yen, S. T. (1996). Food expenditures away from home by type of meal. Canadian Journal of Agricultural Economics/Revue Canadienne D9agroeconomie, 44, 67–80. https://doi.org/10.1111/j.1744-7976.1996.tb00143.x
- Jones, A. (1992). A note on computation of the double-hurdle model with dependence with an application to tobacco expenditure. Bulletin of Economic Research, 44(1), 67–74. https://doi.org/10.1111/j.1467-8586.1992.tb00507.x
- Kadiyala, S., & Rawat, R. (2012). Food access and diet quality independently predict nutritional status among people living with HIV in Uganda. Public Health Nutrition, 16(1), 164–170. https://doi.org/10.1017/S136898001200050X
- Manda, J. (2016). Econometric analysis of improved maize varieties and sustainable agricultural practices (SAPs) in Eastern Zambia. Wageningen University.
- Miruts, F. (2016). Analysis of the factors affecting adoption of soybean production technology in Pawe District, Metekele Zone of Benshangul Gumuz Regional. World Scientific News, 53(3), 122–137.
- MOA. (2016). Ministry of Agriculture, Chipata District Annual Performance Report 2016.
- Mongoso, A. J., Kiwia, R. H., Komba, C. K., & Kafere, D. (2015). Determinants of Soybean market participation among smallholder NASFAM members and non-members in Mchinji district, Malawi.
- Moono, L. (2015). An analysis of factors influencing market participation among smallholder rice farmers in Western Province. Department of Agricultural Economics, University of Nairobi.
- Musah, A. B. (2013). Market participation of smallholder farmers in the upper west region of Ghana. University of Ghana.
- O’Shea, R., O’Donoghue, C., Ryan, M., & Breen, J. (2018). Understanding farmers: From adoption to attitudes.
- Olunga, M. (2013). Assessment of Factors influencing utilization of forest resources in Kipini division of Tana delta district, Kenya. University Of Nairobi.
- Paroda, R. (1999). State of soybean research and development in India. In H. Kauffman (Ed.), Proceedings of the World soybean research conference (pp. 4–7). Chicago, USA: University of Illinois.
- Paul, L., Suman, A., & Sultan, N. (2013). Methodological analysis of principal component analysis (PCA) method. International Journal of Computational Engineering & Management, 16(2), 32–38.
- Shannon, D. A., & Kalala, M. M. (1994). Adoption of soybean in sub-Saharan Africa: A comparative analysis of production and utilization in Zaire and Nigeria. Agricultural Systems, 46(4), 369–384. https://doi.org/10.1016/0308-521X(94)90102-L
- Shibia, M. G. (2010). Determinants of attitudes and perceptions on resource use and management of marsabit national reserve. Kenya, 30(1), 55–62.
- Sindi, J. (2008). Kenya‟s Domestic horticulture subsector: What drives commercialization decisions for rural households? Michigan State University.
- Tamimie, A. (2017). Determinants of soybean adoption and performance in Northern Ghana. University of Illinois.
- Tembo, S., & Sitko, N. (2013). Technical compendium : Descriptive agricultural statistics and analysis for Zambia. IAPRI and Government of the Republic of Zambia.
- Thoenes, P. (2016). The role of soybean in fighting world hunger.
- Tobin, J. (1958). Estimation of Relationships for limited dependent variables. Econometrica, 26(1), 24–36. https://doi.org/10.2307/1907382
- USAID. (2018). Zambia : Nutrition profile.
- Wandji, D. N., Pouomogne, V., Binam, J. N., & Nouaga, R. Y. (2012). Farmer’ s perception and adoption of new aquaculture technologies in the western highlands of Cameroon.
- Yen, S., & Jones, A. (1997). Household consumption of cheese: An inverse hyperbolic sine double-hurdle model with dependent errors. American Journal of Agricultural Economics, 79(1), 246–251. https://doi.org/10.2307/1243958
- Young, A., & Pearce, S. (2013). A beginner’s guide to factor analysis: Focusing on exploratory factor analysis. Tutorials in Quantitative Methods for Psychology, 9(2), 79–94. https://doi.org/10.20982/tqmp.09.2.p079