
 ?Mathematical formulae have been encoded as MathML and are displayed in this HTML version using MathJax in order to improve their display. Uncheck the box to turn MathJax off. This feature requires Javascript. Click on a formula to zoom.
Abstract
Phosphorus is the most limiting nutrient in most of soils of highlands of Ethiopia. Mathematical models that integrate the soil test indices with fertilizer requirements can be important for phosphorus fertilizer recommendation. This study was conducted to verify the recommended soil test based calibration equation for phosphorus (P) fertilizer for two consecutive years on 16 farmers’ fields. Before planting, the initial soil P level was analyzed and ranged from 5.8 to 11.4 ppm. Based on the P calibration model of Debre Berhan Agricultural Research Center (DBARC), the phosphorus requirement ranged from 17 to 120 P2O5 kg ha−1. Nevertheless, in the second year, the initial P level was between 5.04 and 14.29 ppm and the need for P2O5 ranged from zero to 110.4 kg P2O5 ha−1 with DBARC model. In contrast, with agronomic phosphorus fertilizer recommendation, the need for P2O5 was 138 kg ha−1 for both locations for the two years. The first year result revealed that soil test based fertilizer application save 51% of the P2O5 applied compared to the agronomic fertilizer recommendation (138 P2O5 kg ha−1). However, in the second year DBARC and GARC model, could reduce P2O5 fertilizer applied by 65.94 and 44.2%, respectively. The first year result indicated that DBARC model had a mean grain and straw yield penalty of 0.8% and 0.7% compared to the agronomic phosphorus fertilizer recommendation. Similarly, in second year the penalty could be found to be 10.3% and 7.8%. The result also indicated that DBARC P calibration model had the higher net benefit of 19,088 ETB ha−1. The same was true for benefit cost ratio. Therefore, from this study, it is recommended that soil test based fertilizer recommendation shall be used for farmers and hence the P critical and P factor for the test crop were found to be 12.56 and 6.41, respectively.
PUBLIC INTEREST STATEMENT
Wheat (Triticum aestivum L.) is the staple food and the fourth most important food crop after maize, tef and sorghum in Ethiopia. Nevertheless, wheat production in the country is adversely affected by low soil fertility and suboptimal use of mineral fertilizer in addition to others factor. Phosphorus is one of the most limiting elements in the tropics and majority of the soils of Ethiopia are reported as deficient in phosphorus. Therefore, application of Phosphorus is crucial for increasing wheat production. In this regards, fertilizers constituent an integral parts of improved crop production technology. For wheat and other crops, blanket recommendation of fertilizers are introduced in to the extension system. However, this recommendation are shortcoming and are not considered the inherent soil fertility status at general. Hence, mathematical model that integrate soil test indices and with fertilizer rate requirement is required for different soils and crops in different agro-ecologies.
Competing Interests
The authors declares no competing interests.
1. Introduction
Cereals are the most widely grown crops and comprise about 87.97% of total grain production in Ethiopia (CSA(Central Statistical Agency), Citation2019). Wheat is one of the most important cereals in Ethiopia and Eyhiopia is one of the largest producers of wheat in sub-Saharan Africa.The area coverage and production of the crop in Ethiopia is estimated to be 1.7 million hectares and 4.8 million tons of grain yields, respectively. This accounts about 15.39% of total grain output in the country (CSA(Central Statistical Agency), Citation2019). There are two types of wheat grown in Ethiopia: durum and bread wheat accounting 40 and 60% of production, respectively. Wheat production in Ethiopia are characterized by subsistence farming and mostly dominated by small holder farmers (CSA(Central Statistical Agency), Citation2019; Minot et al., Citation2015). The national average productivity of wheat (2.7 tone ha) (CSA(Central Statistical Agency), Citation2019) was still lower than world’s average (3.4 tone ha) (FAOSTAT, Citation2014). Of the many reason for low productivity of wheat; decline of soil fertility, prevalence of disease, dependency on rain-fed traditional agriculture and low input including fertilizer application are the most important ones.
Among others, mineral nutrition is becoming one of the most important factors for increasing crop production. Unfortunately, many soils of Ethiopian highlands are inherently poor in available plant nutrients and organic matter content (Giday et al., Citation2015; Hillette et al., Citation2015; Kiflu & Beyene, Citation2013; Zeleke et al., Citation2010). Phosphorus is of primary concern in the appraisal of the soil resources of Ethiopia since most of the soils in the highland areas of the country are reported to be deficient in phosphorus (Agegnehu et al., Citation2015; Brady & Weil, Citation2008). Indicating that crop growth in such area needs application of N and P containing fertilizer. However, crop only use 10–30% of applied P in the year of application a decresing amount in subsequent year (Korkmaz et al., Citation2010). In addition to the inherently low available P content, the high P fixation capacity of some soils made the problem complex (Korkmaz et al., Citation2009).
The role of chemical fertilizers in increasing yield is evident. Fertilizers accounted for more than 50% of the increase in yield (Yazıcı & Korkmaz, Citation2020). Experience has shown that in seasons with good rain, farmers produce surplus yield through fertilization. The rates applied, however, differ with soil types, agro-ecology, farmers perception to fertilizer, resource endowment, and credit availability. In contrast with this variability to fertilizer application, some blanket fertilizer recommendations have been developed and introduced into the extension system. For instance, the old national phosphorus fertilizer recommendation for wheat producing area of Vertisols is 20 kg P (Woldeab et al., Citation1991). This recommendation were successively refined and found to be 60 and recently it is 45 P (Molla, Citation2018). This approach of fertilizer recommendation, however, had shortcomings in extrapolating the results to farmer fields, because the available nutrient status on the experimental fields was lower than, equal to or higher than that of the farmers’ fields. Hence, fertilizer recommendations should take into account the available nutrient already present in the soil (Mengel, Citation1982).
For implementing this more scientific and precise option of fertilizer recommendation, soil laboratories are being built in many Regional States of the country including in the study area. Nevertheless, since no universally accepted method exists for indexing the availability of nutrients, reliable methods must be selected through research to meet the specific conditions under which the crops are intended to grow. Bray-II and Olsen methods have been proven to be the best indices for Ethiopian soils (Sahelemedihin & Taye, Citation2000). Using these indices, mathematical models that integrate the soil test indices with fertilizer rate requirements can be developed for each crop species on specific soil types and agro-ecologies. Research works on soil test-based fertilizer recommendations are at preliminary stages in Ethiopia, although some recent research recommendations have been made for some crops (e.g. Agegnehu & Lakow, Citation2013; Agegnehu et al., Citation2015). Other researchers also reported research findings on soil test crop response studies in different parts, crops and soils of Ethiopia (Chimdessa, Citation2019; Gebremedhin et al., Citation2015; Getachew & Berhane, Citation2013; Gidena, Citation2016; Girma et al., Citation2018; Taye et al., Citation2000) However, the effort must be further strengthened by conducting refined soil test crop response for different crops and soils of Ethiopia. Therefore, the objectives of this study are to: (1) develop mathematical models that will give phosphorus fertilizer recommendations using Olsen phosphorus levels; (2) verify the recommended soil test-based calibration equation for P; and demonstrate the advantage of soil test-based over agronomic fertilizer recommendation for the study site.
2. Materials and methods
2.1. Description of the study area
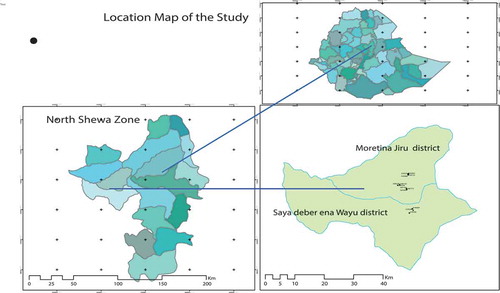
The experiment was conducted in Moretina Jiru and Saya deber ena Wayu districts, North Shewa Zone of the Amhara Regional State, about 195 and 176 km northeast of Addis Ababa, respectively. The capital of Moretina Jiru and Saya deber ena Wayu are Enewari and Deneba respectively. The geologic materials at and around the districts consist of the Aiba basalt of the middle late Oligocene era of the Paleocene period. The areas are characterized by a unimodal rainfall pattern and receives an average annual rainfall of 929 and 1276.3 mm, respectively. The annual average maximum and minimum air temperatures are 21.4 and 9.0°C at Enewari and 22.3 and 6.9 at Deneba, respectively. Vertisols, are the dominant soil type at both districts.
The experimental site were characterized by neutral reaction (mean pH = 6.8) which was measured by using a pH meter in a 1:2.5 soil:water ratio, low in organic carbon content (mean OC = 0.31) which was determined by the Walkley-Black method, low in total N (mean of TN = 0.08) which was determined by Kjeldahl method and textural class of clay.
The crops widely grown in the study area include wheat, teff, faba bean, and lentil; whereas chickpea, grass pea, and others have low area coverage and they are mainly grown on residual soil moisture at the end of the rainy season. Figure shows the geographical location of the experimental sites.
Figure 1. Location map of the study sites.
2.2. Determination of P-critical and P-factor
The phosphorus calibration study was conducted in two phases. In the first phase, P-Critical and P-factor were determined and hence P fertilizer was calibrated. In the next phase, verification of the developed model was conducted.
For determination P-critical and P-factor, 5 P level (0, 20, 40, 60, and 80 kg ha−1) were tested with three replication on 20 farmers field. For each P level, optimum amount of N fertilizer (192 kg ha−1) was applied half at planting and the rest at knee height of the crop. After 3 weeks of incubation period of the applied P fertilizer, soil samples were collected and analyzed using Olsen methods (Olsen et al., Citation1954). This methods was actually selected because the soils of the experimental site were found to be neutral in their reaction (pH) The P requirement factor was calculated and found to be 6.41ppm. The P-critical was also determined using Cate-Nelson graphical techniques (Cate & Nelson, Citation1965), and P requirement factor also was determined for the development of the final equation (Pr) Rate of fertilizer to be applied (kg P ha−1). Soil test P level is correlated with relative crop yield (expressed as a percent of maximum yield) to determine the nutrient concentration of the soils to crop productivity. The data in Figure indicate that the critical level for wheat is 12.56 ppm for this soil test (Olsen method)
Figure 2. Scatter diagram of percentage yield of wheat versus soil test P (Cate-Nelson graph).
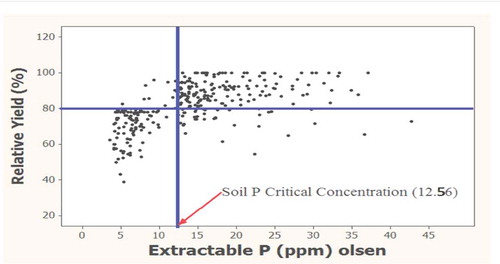
Where, Pr = P fertilizer requirement (kg ha−1), Pc = Critical P concentration = 12.56 (mg kg−1), Po = Initial P values for the site, Pf = P requirement factor = 6.41 (DBARC Model)
Where, Pr = P fertilizer requirement (kg ha−1), Pc = Critical P concentration = 15.8 (mg kg−1), Po = Initial P values for the site, Pf = P requirement factor = 5.4 (GARC Model)
Based on this equation, the verification of the developed model was implemented at Enewari and Deneba areas on 16 sites by using each farmer as a replication. The research was conducted for two years in the main rainy season. The soils at both locations were generally referred as Vertisols. The composite soil samples collected before planting were analyzed using the Olsen method (Sahelemedihin & Taye, Citation2000). Based on the available phosphorus and the above equation the phosphorus requirement of each farmer’s field was calculated.
2.3. Treatments
Agronomic phosphorus fertilizer recommendation. This is the P fertilizer previously recommended for the study areas. The agronomic P recommendation for the areas is 138 P2O5 and this fertilizer is recommended for all farmers plot without considering the inherent soil P level.
Soil test-based phosphorus fertilizer recommendation (DBARC Model). This fertilizer recommendation is based on the soil P level and consider the inherent soil P levels of farmer’s field. For this recommendation, soil samples were collected from each farmer’s field. The samples were analyzed for available P using Olsen method and hence this P level was modeled with DBARC phosphorus calibration equation (Equationequation 1
(1)
Soil test-based phosphorus fertilizer recommendation (GARC model). This fertilizer recommendation is also based on the soil P level and consider the inherent soil P levels of farmers field. For this recommendation, soil samples were collected from each farmer’s field. The samples were analyzed for available P using Olsen method and hence this P level was modeled with GARC phosphorus calibration equation (Equationequation 2
In the first year, the trial included two treatments (agronomic phosphorus fertilizer recommendation and Debra Birhan Agricultural Research Center (DBARC). In the second year Gonder Agricultural Research Center (GARC) model was also included and evaluated.
2.4. Experimental procedure
The experimental sites were prepared using standard cultivation practices before planting. Trial fields were plowed using oxen-drawn implements. Planting and harvesting was done on mid of July and at the first week of December, respectively. Improved wheat varieties (Menzaie) was selected based on the recommendation of research was sown at the rate of 175 kg ha−1. The plot size used was 10 m x 10 m (100 m2). A net plot size was 5 m x 5 m (25 m2) was used for the final harvest. The spacing between each treatment and block were 1 m and 1.5 m, respectively. Ridge was constructed between plot and plot to remove cross contamination of fertilizer between plot and ridge.
All treatments received equal amount of N 192 kg N ha−1 in the form of Urea. The full does of Phosphorus indicated in each treatment will be applied in the form of Triple super phosphate at the time of planting. N will be applied half at planting and the rest half at the tillering stage of the crop.
At the end of the season, the wheat was harvested at the ground level from the net plot area. Then, total biomass (the grain and straw yield) was weighted at harvest. After threshing, seeds were cleaned and weighed. Seed moisture content was measured using a gravimetric method. Total biomass (on dry matter basis) and grain yields were adjusted to a moisture content of 12.5%. straw yield was obtained by subtracting grain yield from total biomass yield.
2.5. Data analysis
Data were analyzed using descriptive statistics as well as analysis of variance. One way analysis of variance (ANOVA) was performed to assess the significance differences in the yield and yield related components of wheat among the treatments. SAS statistical software was used for the analysis of the collected data. Means separation was done using least significant difference (LSD) after the treatments were found significant at P < 0.05. Cost benefit analysis also performed for the treatment by considering farm gate price of grain and straw of wheat 8 and 1.5 ETB, respectively. Total cost of labor, fertilizer price, and fertilizer transportation also considered for economic analysis.
3. Results and discussion
3.1. Initial soil P level and phosphorus fertilizer requirement for the first year
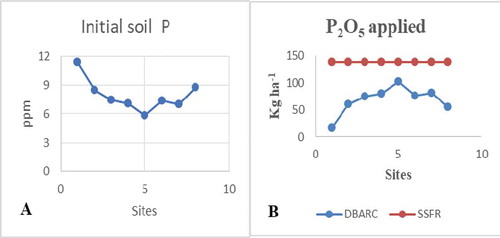
The initial phosphorus level of the soil ranged from 5.8 to 11.4 ppm and hence based on the developed model the need for P2O5 fertilizer ranged from 17 to 102 kg ha−1 (Figure )). However, with agronomic phosphorus fertilizer recommendation the need for P2O5 was found to be 138 kg ha−1, indicating that the P calibration model of DBARC could save about 51% of the P fertilizer to be applied.
Figure 3. (a) Initial soil phosphorus level, (b) P2O5 applied at each farm for the first year.
3.2. Initial soil P and P fertilizer requirement factor for the second year
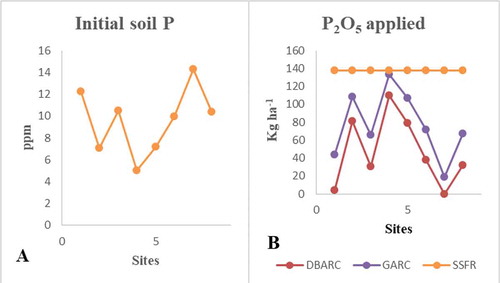
The initial soil P value ranged from 5.04 ppm to 14.29 ppm, indicating that the soil phosphorus level ranged from low to medium phosphorus, respectively (Figure )). Indicating that soil P levels significantly vary across farmers field in the same district. Thus, based on the phosphorus requirement equation developed by DBARC, the needs for P2O5 were between 110.4 kg and 0 kg ha−1. However, based on P requirement equation developed by GARC, the need for P2O5 ranged from 133.6 kg ha−1 to 18.56 kg ha−1. The mean phosphorus fertilizer applied to the soil also showed great difference and the mean P2O5 requirements of the soil were 138, 77, and 47 Kg ha−1 for agronomic phosphorus fertilizer recommendation, GARC and DBARC model respectively. The results of the study also demonstrated that about 65.94% and 44.2% of P2O5 ha−1 could be saved by using DBARC and GARC P calibration model, respectively compared to the agronomic phosphorus fertilizer recommendation (138 kg P2O5). Likewise, GARC P calibration model resulted in a 30 kg P2O5 penalty compared with DBARC model. Similarly, Gebremedhin et al. (Citation2015) reported that based on soil test-based phosphorus fertilizer recommendation saves 23.8 kg P2O5 compared with blanket recommendation of 46 P2O5 in wheat growing area of Hintalo-wajirate district.
Figure 4. (a) Initial soil phosphorus level, (b) P2O5 applied at each farm for the second year.
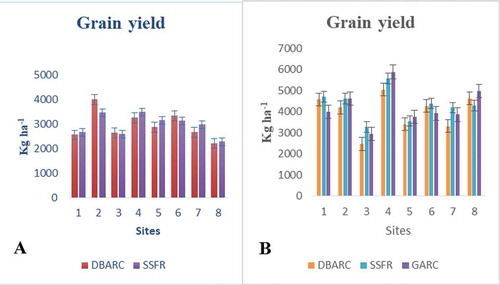
3.3. Grain yield
In the first year of the experiment, the statistical analysis showed that there was nonsignificant difference between the model and agronomic phosphorus fertilizer recommendation (Table ) and the model worked best for most of the sites but failed to show the expected result for few locations (Figure )). Implying that the possibilities of using the model in most sites instead of agronomic phosphorus fertilizer recommendation for the areas. For instances, for site 2, 3, and 8 the model resulted in yield advantages of 15.4% (535 kg ha−1), 2.3% (59 kg ha−1), and 6.8% (213 kg ha−1) compared to the agronomic phosphorus fertilizer recommendation (138 kg ha−1 P2O5) respectively. However, on site 1, 4, 5, 7, and 8 agronomic phosphorus fertilizer recommendations (138 kg ha−1 P2O5) produced grain yield advantages of 4.4% (118 kg ha−1)), 6.6% (230 kg ha−1), 8.8% (279 kg ha−1), 10.2% (304 kg ha−1), and 3.2% (73 kg ha−1) over the DBARC model, respectively. Generally, agronomic phosphorus fertilizer recommendation had a mean grain yield advantage of 0.8% (24.6 kg ha−1) over the DBARC model.
Table 1. Yield response of wheat as influenced by the treatment
Table 2. Cost benefit analysis of the soil test phosphorus calibration treatments
In the second year, the DBARC model worked best in some sites and produced a comparable and even higher grain yields than agronomic phosphorus fertilizer recommendation (Figure )). In sites 1 and 2, DBARC model had a comparable wheat grain yield over agronomic phosphorus fertilizer recommendation, but on site 8, the model had a grain yield advantage of 339.3 kg ha−1 (7.9%). In contrast, on sites 2, 3, 4, 5 and 7, agronomic phosphorus fertilizer recommendation resulted in grain yield advantages of 411.5 kg ha−1 (8.9%), 798.2 kg ha−1 (24.4%), 543.3 kg ha−1 (9.7%), 149.5 kg ha−1 (4.2%), and 876.6 kg ha−1 (20.9%), respectively over DBARC P calibration model. Generally, agronomic phosphorus fertilizer recommendation produced a yield advantage of 336 kg ha−1 (7.8%) over DBARC model. As compared to DBARC model, GARC model showed comparable and even higher yield on most of the testing sites. In sites 2, 4, 5, and 8, GARC model had gain yield advantages of 7.2 kg ha−1 (0.2 %), (5.4 %), 193.9 kg ha−1 (5.4%), and 685.8 kg ha−1 (16%), respectively compared with agronomic phosphorus fertilizer recommendation.
Nevertheless, on sites 1, 3, 6, and 7, GARC model resulted in grain yield penalty of 702.9 kg ha−1 (14.9%), 318.7 kg ha−1 (9.8%), and 329 kg ha−1 (10.8%), respectively compared to agronomic phosphorus fertilizer recommendation. Generally, the result indicated that GARC model had mean a yield penalties of 79.9 kg ha−1 (1.8%) and 256.4 kg ha−1 (6%) compared to agronomic phosphorus recommendation and DBARC P calibration model, respectively. In line with the present study, Gebremedhin et al. (Citation2015) reported that soil test-based phosphorus fertilizer recommendation increase wheat yield by 14% compared with blanket recommendation (50 urea: 100 DAP). Similar result were also reported by Girma et al. (Citation2018) for faba bean on nitisols, Gidena (Citation2016) for teff on vertisols, Getachew and Berhane (Citation2013) for malting barley on nitisols.
Figure 5. (a) Grain yield of first year, (b) grain yield of second year.
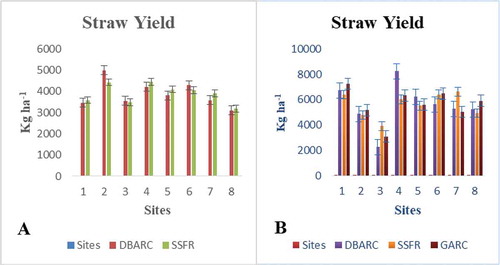
3.4. Straw yield
In the first year, the model worked best for most of the tested sites. In sites 2, 3, and 6 DBARC model had straw yield advantages of 563.6 kg ha−1 (12.7 %), 62.15 kg ha−1 (1.7%), and 224.4 kg ha−1 (5.5 %), respectively. However, on sites 1, 4, 5, 7, and 8, agronomic phosphorus fertilizer recommendation (138 kg ha−1) resulted in straw yield advantages of 124.3 kg ha−1 (3.5%), 242.3 kg ha−1 (5.5%), 293.9 kg ha−1 (7.2%), 320.2 kg ha−1 (8.2%), and 76.9 kg ha−1 (2.4%), respectively. Generally, agronomic fertilizer recommendation produced a mean straw advantage of 25.9 kg ha−1 (0.7 %) as compared to the model.
In the second year, Figure 9 indicates that in most of the sites the DBARC phosphorus calibration model showed the expected result. In sites, 1, 2, 4, 5, and 8 the model outwitted that of agronomic phosphorus fertilizer recommendation (Figure )). In those sites, the model had straw yield advantages of 355.7 kg ha−1 (5.3 %), 81.5 kg ha−1 (1.7%), 2214 kg ha−1 (26.8%), 696 kg ha−1 (11.2%), and 300 kg ha−1 (5.7%), respectively. But on sites 3, 6 and 7 agronomic phosphorus fertilizer recommendation (138 kg ha−1) resulted in straw yield advantages of 1656.2 kg ha−1 (73.3%), 787.9 Kg ha−1 (13.9%), and 1350.9 kg ha−1 (25.6%), respectively compared to the DBARC phosphorus calibration model. GARC model also showed the expected result and in sites 1, 2, 4, 5, 6, and 8 the model had straw yield advantages of 874.3 kg ha−1 (13.7 %), 384.7 kg ha−1 (8 %), 299.1 kg ha−1 (4.9 %), 84.6 kg ha−1 (1.5 %), 61.9 kg ha−1 (0.9 %), and 984.8 kg ha−1 (19.9 %), respectively compared to agronomic phosphorus recommendation. However, on the remaining sites (3 and 7) the GARC model resulted in a straw yield penalty of 805.4 kg ha−1 (20.6 %)
Figure 6. (a) Straw yield of first year, (b) Straw yield of second year.
3.5. Cost-benefit analysis
The two years results indicated that DBARC phosphorus calibration model resulted in the highest net benefit compared to the agronomic phosphorus fertilizer recommendation and had a mean net benefit of 19,088 ETB ha−1 (Table ). The same was true for the benefit cost ratio also. The result also revealed that GARC phosphorus calibration model also resulted in the highest net benefit (26,457 ETB ha−1) and the benefit cost ratio as compared to agronomic phosphorus fertilizer recommendation.
4. Conclusion and recommendation
Routine soil analysis for fertilizer recommendations is considered an important component contributing to increased crop yields and maintaining soil productivity. The present study were conducted in wheat producing areas of North Shewa zone on vertisols. The objective of the study were to develop mathematical models that will give phosphorus fertilizer recommendations using Olsen phosphorus levels according to P availability indices, verify the recommended soil test-based calibration equation for P and demonstrate the advantage of soil test-based over agronomic fertilizer recommendation for the study site.
The statistical analysis showed that nonsignificant difference between the model and agronomic fertilizer indicating that the possibility of using the model for wheat production in the study site. The P fertilizer model developed by DBARC had a mean phosphorus fertilizer saving advantage of 58.5% compared with agronomic fertilizer recommendation. Similarly, the two years result indicated that DBARC P calibration model had the higher net benefit than agronomic P fertilizer recommendation and resulted in a mean net benefit of 19,088 ETB ha−1
Therefore, from this study, it is recommended that soil test-based fertilizer recommendation shall be used for farmers and hence the P critical and P factor for the test crop were found to be 12.56 and 6.41, respectively.
Acknowledgments
The author acknowledge Amhara Agricultural Research Institute for granting research fund. The authors would also acknowledge all staff of Debra Birhan Agricultural Research center for their support at all levels of the experiment.
Additional information
Funding
Notes on contributors
Beza Shewangizaw
Beza Shewangizaw is soil fertility researcher in Amhara Agricultural Research Institute, Debra Birhan Agricultural Research Center. Beza obtained his MSc in soil science. He has conducted research work related to crop response to fertilizer application, soil microbiology, and amelioration of problematic soils.
Kenzemed Kassie is soil fertility researcher in Amhara Agricultural Research Institute, Debra Birhan Agricultural Research Center. Kenzemed obtained his MSc in soil science. He has conducted research work related to crop response to fertilizer application, soil microbiology, and amelioration of problematic soils.
Shawl Assefa is soil fertility researcher in Amhara Agricultural Research Institute, Debra Birhan Agricultural Research Center. Shawl obtained his MSc in soil science. He has conducted research work related to crop response to fertilizer application, soil microbiology, and amelioration of problematic soils.
Tesfaye Feyisa is researcher in soil fertility and currently director of soil and water management directorate of Amhara Agricultural Research Institute.
References
- Agegnehu, G., & Lakow, B. (2013). Soil test phosphorus calibration for malting barley (Hordeum vulgare L.) production on Nitisols of. Ethiopian highlands. Tropical Agriculture, 90(4), 177-187.
- Agegnehu, G., Nelson, P. N., Bird, M. I., & van-Beek, C. (2015). Phosphorus Response and fertilizer recommendations for wheat grown on Nitisols in the central Ethiopian highlands. Communications in Soil Science and Plant Analysis, 46(19), 2411–12. https://doi.org/10.1080/00103624.2015.1081922
- Brady, N. C., & Weil, R. R. (2008). The nature and properties of soils. Pearson Prentice: New Jersey, USA.
- Cate, R. B., & Nelson, L. A. (1965). A rapid method for correlation of soil test analyses with plant response data. North Carolina Agricultural Expertiment Station, International Soil Testing Series, Tech. Bull, 1.
- Chimdessa, D. (2019). Phosphorus calibration study under soil test based maize response in bedele district of oromia, west Ethiopia. Forestry Research and Engineering: International Journal, 3(4), 154–158. DOI: 10.15406/freij.2019.03.00092
- CSA(Central Statistical Agency). (2019). Agricultural sample survey. Report on area and production of major crops (private peasant holdings, meher season). Addis Ababa, Ethiopia.
- FAOSTAT. (2014). Online [Internet]. Retrieved August 6, 2020, from. http://faostat.fao.org/site/291/default.aspx. FAO, Rome.
- Gebremedhin, G., Hagos, B., & Daniel, B. (2015). Verification of soil test based phosphorus fertilizer recommendation for yield and yield components of wheat in Hintalo-wajirat District. Ethiopia, Journal of Natural Sciences Research, 5(17), 84–88.
- Getachew, A., & Berhane, L. (2013). Soil test phosphorous calibration for malt barley production on Nitisols of Ethiopian highlands. Tropical Agriculture, 90(4), 177–187.
- Giday, O., Gibrekidan, H., & Tareke, B. (2015). Soil fertility characterization in Vertisols of Southern Tigray, Ethiopia. Advanced Plants Agricultural Research, 2(1), 00034. DOI: 10.15406/apar.2015.02.00034
- Gidena, T. (2016). Verification and demonstration of soil test based phosphorus fertilizer recommendation rate on yield of teff (Eragrostis Tef (Zucc) Trotter) in vertisols of northern Ethiopia. Journal of Natural Sciences Research, 6(1), 51–55. https://iiste.org/Journals/index.php/JNSR/article/view/28274
- Girma, C., Gemechu, K., & Zeleke, O. (2018). Soil test based phosphorous calibration for fababean (Vicia faba L.) production on nitisols in central highlands of Ethiopian. Greener Journal of Agricultural Sciences, 8(1), 022–29. https://doi.org/10.15580/GJAS.2018.1.011818007
- Hillette, H., Tekalign, M., Riikka, K., Erik, K., Heluf, G., & Taye, B. (2015). Soil fertility status and wheat nutrient content in Vertisol cropping systems of central highlands of Ethiopia. Agriculture and Food Security, 4(19), 1-10. https://doi.org/10.1186/s40066-015-0038-0
- Kiflu, A., & Beyene, S. (2013). Effect of different land use systems on selected soil properties in south Ethiopia. Journal of Soil Science and Environmental Management, 4(5), 100–107. https://doi.org/10.5897/JSSEM2013.0380
- Korkmaz, K., Ibrikci, H., Karnez, E., Buyuk, G., Ryan, J., Oguz, H., & Ulger, A. C. (2010). Responses of wheat genotypes to phosphorus fertilization under rainfed conditions in the Mediterranean region of Turkey. Scientific Research and Essays, 5(16), 2304–2311. https://academicjournals.org/journal/SRE/article-abstract/5BFD5AA17882
- Korkmaz, K., Ibrikci, H., Karnez, E. B. R. U., Buyuk, G., Ryan, J., Ulger, A. C., & Oguz, H. (2009). Phosphorus use efficiency of wheat genotypes grown in calcareous soils. Journal of Plant Nutrition, 32(12), 2094–2106. https://doi.org/10.1080/01904160903308176
- Mengel, K. (1982). Factor of plant nutrient available relevant to soil testing. Plant and Soil, 64(1), 129–138. https://doi.org/10.1007/BF02375167
- Minot, N., Warner, J., Lemma, S., Kasa, L., Gashaw, A., & Rashid, S. (2015). The wheat supply chain in Ethiopia: Patterns, trends, and policy options. International Food Policy Research Institute (IFPRI).
- Molla, A. (2018). Response of wheat to NP fertilizer rates, precursor crops and types of vertisols in central highlands of Ethiopia. Journal of Agricultural Science, 10(4), 231–244. https://doi.org/10.5539/jas.v10n4p231
- Olsen, S. R., Cole, V., Watanabe, F. S., & Dean, L. A. (1954). Estimations of available phosphorus in soils by extractions with sodium bicarbonate. U.S. Dept. Of Agric. Cric.939, USDA.
- Sahelemedihin, S., & Taye, B. (2000). Procedures for soil and plant analysis. National Soil Research Center, Ethiopian Agricultural Research Organization.
- Taye, B., Hassan, Y., Setsu, S., Gorfu, A., Hassana, M., Tanner, D. G., Tesemma, T., & Gebre, T. (2000). Optimizing fertilizer use in Ethiopia-Corelation of soil analysis with fertilizer response in Hetosa Woreda, Arsi Zone. Sasakawa-Global.
- Woldeab, A., Mamo, T., Bekele, M., & Ajema, T. (1991). Soil fertility management studies on wheat in Ethiopia. In H. Gebre-Mariam, D. G. Tanner, & M. Holluka (Eds.), Wheat research in Ethiopia: A historical perspective (pp. 137–172). IAR/CIMMYT.
- Yazıcı, D., & Korkmaz, K. (2020). The effect of potassium applications on toxicity and uptake of boron in buckwheat. Academic Journal of Agriculture, 9(1), 151–162. http://dx.doi.org/10.29278/azd.723988
- Zeleke, G., Agegnehu, G., Abera, D., & Rashid, S. (2010). Fertilizer and soil fertility potential in Ethiopia: Constraints and opportunities for enhancing the system. International Food Policy Research Institute (IFPRI).