
Abstract
A modified QuEChERS method was employed with LC-MS/MS to evaluate the matrix effects of 12 different vegetables matrices in 57 globally used herbicides. The average recoveries of pesticides at different concentrations varied between 70 and 120%. The reproducibility expressed as relative standard deviation was <25%. The limit of quantitation was (0.005–0.01 mg/kg). The measurement uncertainty is lower than 40%. Three vegetables families: Cucurbitaceae, Solanaceae and leafy vegetables were selectd for study. Among the investigated commodities, leafy green vegetables have the highest matrix effects, MEs percentages ranged between (2 & 282%). The highest suppression in analytes response was observed for parsley with matrix ME (2–19%). Most of tested herbicides showed suppression extent at the lower fortified concentrations. Tomato recorded the highest enhancement in most of studied herbicides of MEs% ranged from (122 to 379%). Butachlor, chlorbromuron, fenoxaprop-p-ethyl, flufenacet, fluzafop-p-butyl, hexythiazox, prosulfocarb and pyriproxyfen showed ion suppresion for all vegetables matrices with MEs% ranged from (5 to 79%). Matrix effects (MEs) were evaluated by comparing the slopes of target analytes to prove reproducibility (n = 5). The current study emphasize using of matrix match calibration with these commodity pesticides combinations, whereas, ME’s were dependent on composition of analyte and co-eluting agents.
PUBLIC INTEREST STATEMENT
Health and food safety issues’ regarding the use of pesticides on agricultural crops is an area of growing worldwide concern. Pesticides (insecticides, fungicides and herbicides) are outcome of the application of pesticides used in controlling many types of pests and crop diseases in farming industry to get high quality food commodity. However, pesticides use has been associated with alteration of the local environment and the potential risks to human health from both occupational and non-occupational exposures. The phenomena of matrix effects have become one of the great concerns among the quantitative analysis of pesticide residues in food using LC-MS/MS. Therefore, the study of matrix effects was evaluated among various commodities belongs to different vegetables families. Results obtained indicated that, that matrix effects were dependent on the composition of analyte as well as the components of matrix and co-eluting agents. Therefore, matrix effects are highly important while applying a reliable quantitative method.
1. Introduction
Health and food safety regarding the use of pesticides on agricultural crops is an area of growing worldwide concern. Herbicides were widely used as selective pesticides for controlling unwanted vegetation and grassy weeds in a variety of vegetables. However, their degradation and residual activities in many of agriculture crops, water and soil, might represent critical hazards to human and even environment through the food chain.
Pesticide residues in food and agriculture crops are outcome of the application of pesticides, used in controlling many types of pests and crop diseases in farming industry (Businelli et al., Citation1992). On the other hand, the use of herbicides is considered as a valuable benefit in protecting agriculture crops from loss before and after harvest, therefore get high quality food commodity (Hajšlová et al., Citation1998).
Raw vegetables are one of supplementary sources and important ingredients, that are essential for a healthy and balanced diet. But vegetables also are liable to contain pesticide residues through the treatment of soil during cultivation, spraying and administration of pesticides during storage (De Smet, Citation1992).
Worldwide, many of the farmers spray the same mixture of pesticides on all vegetables and ignore pre-harvest intervals (PHI) (Ntow et al., Citation2006). However, pesticides use has been associated with alteration of the local environment and the potential risks to human health from both occupational and non-occupational exposures (Mansour et al., Citation2009).
Many organizations have regulated the use of pesticides and set maximum residue limits for herbicides applied on vegetables during integrated pest management and pest control, such as Codex Alimentarius (Citation2020). Hence official food laboratories must implement analytical quality control (AQC) procedures to fulfill this goal (SANTE Guidance, Citation2017).
One of the great concern among the analysis of pesticide residues in cultivated vegetables is matrix effect which affect mainly on laboratory throughput (Xu et al., Citation2017). Although triple quadrupole (QQQ LC-MS/MS) is a highly selective and sensitive technique but matrix co-extractives like sugars, fatty acids, organic acids, lipids and pigments play adverse role in analyte recovery. During chromatographic separation matrix co-elutes along with target compounds and interfere with determination of pesticide residues. This is due to properties of matrix co-elutes, i.e. changing the efficiency of analyte ionization resulting in peak signal suppression or enhancement, finally affecting the concentration of target analytes (Fialkov et al., Citation2007). The background signal of LC-chromatogram increases the suppression of chromatographic peak via gradient degradation as matrix compounds at substantial levels.
QuEChERS approach has been applied in many of routine laboratories with high effectiveness and recovery for the extraction of food samples with complex matrices such as vegetables (Hou et al., Citation2013; Wilkowska & Biziuk, Citation2011). Cleanup and separation protocol have been used in the QuEChERS methodology (Anastassiades et al., Citation2003), to remove matrix complexity but not sufficient to remove all interferences. The dilution technique is another approach used recently to remove matrix compounds but there is probability of losing analytes in the determination of pesticide residues because it reduces the matrix co-extractives thereby decreasing the analytes concentration. Matrix effects can be eleminated successfully by increasing the dilution factor range which may vary from 10- to 100-fold. A dilution factor of 15 is enough to eliminate most of the matrix effects and reduce the signal suppression (Ferrer et al., Citation2011). The more dilution, better the response and sensitivity (Stahnke et al., Citation2012). However pesticides vary in physicochemical properties so that a single method is not adequate to minimize matrix effects. The compensation of matrix effects by matrix-matched calibration approach could be effective but adds time and cost to analysis (Kittlaus et al., Citation2011; Kruve et al., Citation2008). Estimation of matrix effects is mathematically determined by the slope of matrix-matched calibration curve compared to the slope of pesticide standards calibration curve in the solvent solutions (Guerrero, Citation2003; Moura et al., Citation2011). Other studies used the analysis of covariance ANCOVA in matrix effect statistics (Ahumada & Zamudio, Citation2011). Further an investigation of matrix effects has been performed using the ME % (Economou et al., Citation2009).
Accordingly, objective of current research work is to evalute method performance and matrix effect of twelve different vegetable matrices on 57 different herbicides. Matrix effect impacts identification and quantitifcation of target analytes, which was studied meticulously. Representative matrix selection was carried out to simplify the complexity involved in multiple matrices-based calibration curve. In addition, the limitations of LC-MS/MS sensitivity was investigated by comparing calibration curve slope of standard and matrix matched claibrations.
2. Experimental
2.1. Reagents and Materials
All pesticides active ingredients were obtained from Sigma Aldrich (Steinheim, Germany) with purity ≥ 95% and were kept in refrigerator freezer at −20°C. Stock standard solutions of 1000 mg/L were prepared in 10 mL volumetric flask in acetonitrile and transferred to amber-screw-capped glass vial (12 mL). Pesticide stock solutions were kept in the dark at −20 ± 2°C. (Banerjee et al., Citation2007) Intermediate mixtures standard solutions (100, 10 & 1 mg/L) were prepared in acetonitrile, the calibration mixtures solutions (0.005, 0.01, 0.025, 0.05 & 0.1 mg/L) were prepared from of 1 mg/L. A multi-level concentration (0.005, 0.01, 0.025, 0.05 & 0.1 mg/L) were prepared in the final extract of previously cleared blank samples and used for the matrix-matched calibration solutions. Methanol, acetonitrile, LC-MS grade and ammonia solution (33%) were obtained from Honeywell (Riedel-de-Haën). Formic acid 98–100% (Merck) was used as acid modifier of the LC mobile phase. De-ionized water was generated by Milli-Q unit (Millipore Corporate, USA) to get LC-grade water. Buffer salts were purchased from Agilent technologies: QuEChERS extract kit, Part No. 5982–5650, containing magnesium sulphate 4 g; sodium chloride 1 g; trisodium citrate 1 g and disodium hydrogen sesquihydrate 0.5 g, with purity ≥99%. Dispersive solid phase extraction (DSPE) 15 ml, Part No. 5982–5056, was containing 25 mg of the primary secondary amine bulk sorbent (PSA) and 150 mg magnesium sulfate (Purity ≥ 98%).
2.2. Sample Preparation and Clean-Up
The standard method of European Committee for Standardization, i.e. QuEChERS multi-residues methods established in 2003, then the citrate buffered QuEChERS; EN 15,662 was developed in 2008 to significantly improve laboratory efficiency and performance. Pesticide residues extractions were done on 12 different vegetables matrices using QuEChERS multi-residues methods EN 15,662:2008 (European Union, Citation2008). The procedures were carried out based on an initial single-phase extraction using a test homogeneous portion of 10 g sample (water content ~80%) with acetonitrile at 10 mL per 10 g of sample. A liquid–liquid partition is followed by adding one contents of QuEChERS extract kit, part no. 5982–5650. Centrifugation carried out at 10,000 rpm for 10 minutes. An aliquot of upper layer, containing pesticide was transferred to 15 mL tube in which matrices were cleaned and the excess of water removed by mixing acetonitrile with magnesium sulfate anhydrous and PSA sorbents through single d-SPE step, part no. 5982–5056. The final extract can be analyzed directly by LC-MS/MS technologies. The development of QuEChERS extraction method is shown in (Figure 1S). The modification to original QuEChERS using sodium citrate tribasic dehydrate, sodium citrate dibasic sesquihydrate in extraction step and primary secondary amine (PSA) in cleanup step have been introduced to minimize degradation of susceptible compounds like base and acid labile pesticides which can expand the range of matrices amenable by this approach and increase sample throughput while reducing costs.
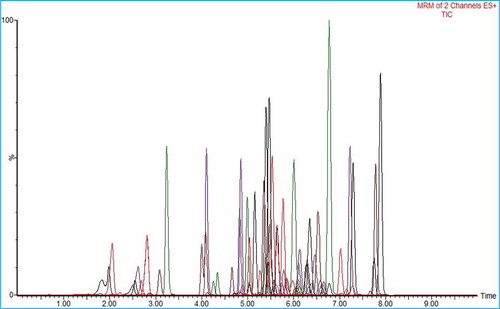
Figure 1. Total Ion Chromatogram (TIC), MRM of 2 Channels ES+ for Herbicides.
2.3. Evaluation of Matrix Effect
A total of twelve different blank matrices of the most widely cultivated and consumed organic vegetables, seven fruiting vegetables, i.e. cucumber (Cucumis sativus), eggplant (Solanum melongena), pepper (Capsicum annuum), squash summer (Cucurbita), melon (Cucumis melo), pumpkin (Cucurbita pepo), and tomato (Solanum lycopersicum); four leafy vegetables, i.e. dill (Anethum graveolens), parsley (Petroselinum crispum), lettuce (Lactuca sativa) and spinach (Spinacia oleracea); one root vegetables, i.e. potato (Solanum tuberosum); were collected from locally available supermarkets as illustrated in (Table ).
Table 1. Types of Vegetables Matrices with their Scientific Names and Families
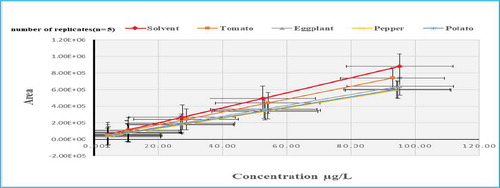
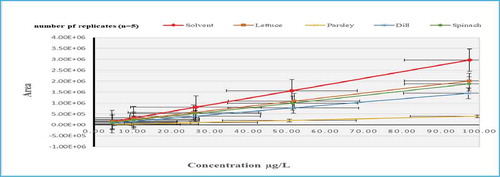
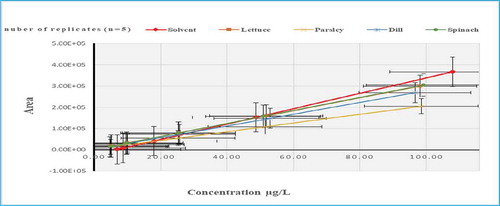
The studied commodities were fortified with a mixture of 57 herbicides at five concentration levels (5, 10, 25, 50 & 100 µg/L). The matrix effect could be obtained by comparing the slopes between solvent matched and matrix matched calibrations for all studied analytes. Furthermore, matrix effects were investigated against vegetables families groups. Hence, this could give an idea about the behavior of analytes to optimize the calibration curves in line with the behavior of the analytes in the respective matrix as well as to evaluate how much the quantification could be affected by the matrix type and the extraction method used (Marchi et al., Citation2010; Trufelli et al., Citation2011).
3. Liquid Chromatography-Triple Quadrupole-Mass Spectrometry Instrumentation
Acquity UPLC system equipped with binary pump, vacuum degasser and autosampler. Gas generator designed to provide nitrogen gas at least 5 L/min at 60 psi, source gas (zero air) at least 22 L/min at 100 psi and exhaust gas (air) at least 8 L/min at 60 psi. LC–MS/MS was carried out using Waters Xevo TQ-S (Waters systems) triple quadrupole mass spectrometer with mass range (50–2000 m/z) and equipped with atmospheric pressure ion source (Turbo V) that accepts either electro sprayer ionization (TurboIonSpray) and atmospheric pressure chemical ionization (ESI/APCI) probes and can measure in negative and positive modes. Separation was performed on Acquity BEF C18 2.1 × 100 mm, 1.7 µm particle size. The injection volume was 2 µL. A gradient elution program at 0.45 ml/min flow, in which one reservoir contained 10 mM ammonium formate solution in methanol-water (1:9), and the other contained methanol. The ESI source was used in the positive mode, argon nebulizer, and other gas setting were optimized according to recommendations made by the manufacturer; source temperature was 300°C, ion spray potential 5500 v, de-cluster potential and collision energy were optimized using a Harvard apparatus syringe pump by introducing individual pesticide solutions into the MS instrument to allow optimization of the MS/MS conditions. The Multiple Reactions Monitoring mode (MRM) was used in which one MRM was used for quantification and the other for confirmation.
4. Results and discussion
4.1. LC-QQQ-MS/MS Determination
All target pesticides were optimized at 100 µg/L using Waters® Xevo™ TQ-S in full-scan mode. Separation of pesticides was performed using Acquity UPLC mobile phase gradient program, (Table ). Filtration of ions was occurred according to their mass to charge ratio (m/z) using quadrapole mass analyzer within the mass range (50–2000 m/z). The produced precursor ions of a single m/z were parked in the first quadrupole (Q1) then passed through the collision cell (Q2) where, collided with Argon (Ar) gas and dissociated to produce the daughter ions. Finally, Q3 parked only passed daughter ions with of a single m/z to the electron-multiplier detector (Figs.&2S).
Table 2. Gradient Programme for Waters UPLC
Figure 2. Slope of Calibration Mixture Solutions (solvent based standards) compared to Matrix-Matched Calibration Solutions for Hexythiazox.
Suitable MRM transitions were selected carefully for each compound to ensure specificity and sensitivity of technique’s determination. Firstly, the precursor and product ion were investigated for each pesticide standard according to their retention time and maximum intensity, and then the collision energies were optimized to obtain the highest intensity and best response for two selected daughter ions. One of the product ions will be selected as quantification ion and the other as target ion. However, quantification always was done based on one transition (quantifier) while the other will be for confirmation (qualifier). Optimized conditions, i.e. Retention times (tR/min), MRM transitions/Collision Energy (CE) and Cone Voltage (CV) were illustrated in (Table 1S).
System suitability: System suitability test (SST) was performed before injection and analyzing samples as a manner for accurate and reliable data. Initially, this process included injection of blank sample followed by a multi-residues calibration of five concentration points and then quality control samples (QCs). Blank sample is injected with each set to evaluate the absence of the compounds of interest and/or presence of interfering compounds. It is acceptable in case of the signal is ≤ 20% against the LOQ. The efficiency of the method was tested by evaluating the recovery % of spike samples at concentration level 50 µg/kg. The mean recoveries shall range from 70 to 120% and RSD % ≤ 20% as per standard guidelines.
4.2. Method Performance and Quality Assurance
The method was validated in accordance to SANTE and Eurachem guidelines documents on analytical quality control and method validation procedures for pesticides residues analysis in food and feed. In-house method validation by the following parameters: Specificity, limit of detection, limit of quantification, recovery, accuracy (precision and trueness), method linearity and measurement uncertainty and robustness. All target analyses were carried out using the blank samples (pesticides residue free) of cucumber and lettuce.
Specificity: In accordance to European Commission document SANTE/11,813/2017, the specificity of the analytical multi-residues method for pesticides detection was confirmed by obtaining positive results from the studied commodities containing the target analytes barring control samples. The identification and quantification of pesticides were performed by comparing their retention times in samples and in both solvent and matrix-matched calibration solutions. In addition, to compare with the two selected ion transitions of each pesticide.
Detection and quantification limits (LODs & OQs) were calculated from the values of standard deviations (SDs) associated with the measurement of target pesticides. For this purpose, seven replicates of each matrix were injected at concentration level of 10 µg/kg. LOD and LOQ were evaluated statistically as 3 and 10 times of SD, respectively, whereas ranged from (0.73 to 2.91 µg/kg), (0.52 to 2.89 µg/kg) and (2.43 to 9.71 µg/kg), (1.75 to 9.63 µg/kg) for LODs and LOQs in cucumber and lettuce samples, respectively, as illustrated in (Tables 2S&3S). The LOQ criteria should fulfill the requirements of precision and trueness/accuracy with respect to both recovery and RSD percentages. LOQs were lower than international maximum residue limits (MRLs) prescribed for all target parameters.
Table 3. Results and Z-Score for Detected Pesticides in Cucumber (2018–2019)
Method linearity: The calibration curves of 57 herbicides mixture were studied at concentrations levels (5, 10, 25, 50 and 100 µg/L) using LC-MS/MS with five replicate injections per each concentration, prepared in acetonitrile and blank matrices extract of the studied commodities, i.e. cucumber, summer squash, pumpkin, melon, dill, tomato, eggplant, pepper, potato, lettuce, parsley and spinach. The method linearity for all analyses was achieved with correlation coefficient (R2) ≥ 0.995 and deviation of recalculations ≤ ±20%.
Recovery: A statistical test was applied to the mean of the recovery values for all 57 pesticides in cucumber and lettuce matrices to compare calculated recoveries with the 100% at confidence level 95%, considering a probability <5%. Recovery test was studied at three fortified spiking levels (10, 50 & 100 µg/kg) for all of analytes, using different organic samples of cucumber and lettuce as well as using 7 replicates per each concentration level as showed in (Tables 3S and 4S). The mean recovery was in the range from (70 to 120%) expressed as trueness/accuracy.
Precision is defined as the closeness or degree of agreement among multiple analyses of a given sample, referred to as repeatability and within-laboratory reproducibility. This is expressed as RSD% which was ≤ 20%.
The trueness/accuracy of the method is a summary of how close the mean is to a set of results. To check the trueness of this method, spiked samples were used at different levels on cucumber and lettuce samples (Figures 3S and 45).
Figure 3. Slope of Calibration Mixture Solutions (solvent based standards) compared to Matrix-Matched Calibration Solutions for Chlorpropham.
Robustness: In this study intra-laboratory reproducibility will only be considered, spiked samples of cucumber and lettuce were analyzed by different analysts over a period of several days and at different concentration levels. Robustness was evaluated from validation data by pooling the variances of different levels. The pooled CV (RSD %) for reproducibility should be ≤ 20% (Table 6S).
Uncertainty measurements expressed as RSD % and in the term of expand uncertainty, was found to be ±40% at confidence level 95%, which less than the default value set by (EU) ±50% (Eurachem guide, Citation2014, Citation2012). Moreover, the lab also has participated in proficiency tests (PTs) which provide the contribution inter laboratory bias to evaluate the performance of the method and qualification of analysts (Table ).
4.3. Matrix Effects and Selectivity Study
The matrix effects of the studied commodities were evaluated in all target pesticides through the ratio of analyte spiking area in both solvent and matrix extract. In the present study, the working calibration solutions of five points were prepared in both solvent and blank matrices of target samples at concentration levels (5, 10, 25, 50 & 100 µg/kg). The MEs were calculated using the following equation (Kruve et al., Citation2008):
%ME = (analyte matrix spike area/analyte solvent spike area) × 100
The suppression and/or enhancement extents of matrix effects were evaluated through calculation of matrix effects percentages (Ferrer et al., Citation2011) as a difference in the percentages between the slopes values of the solvent matched and matrix-matched calibration curve. So, the negative values of matrix effects percentages signified suppression of the signal while positive values signified enhancement. Accordingly, the % MEs values could be categorized into three groups: (i) low matrix effect < ±20%, (ii) medium > ±20 and < ±50% and (iii) high > ±50%. In our study the obtained results showed that the MEs were dependent on the commodities as well as the analytes (Remane et al., Citation2010). Overall investigated commodities, there was significant suppression in the signal intensity of all studied analytes especially at lower concentration levels as illustrated in (Tables 7S–9S).
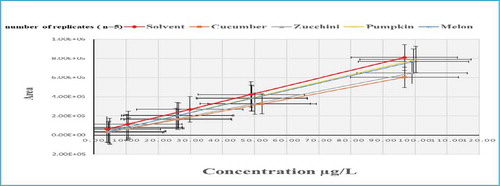
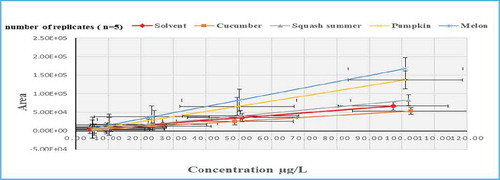
4.3.1. Matrix Effects for Cucurbitaceae Vegetables Family Using LC-MS/M
The matrix effects percentages were investigated in cucumber, squash summer, pumpkin and melon as representative matrices of Cucurbitaceae family. The highest suppression of matrix effects values were ranged from (5 to 13%), (6 to 19%), (8 to 17%) and (10 to 16%) for cucumber, squash summer, pumpkin, and melon respectively. Most of pesticides showed suppression of signal intensity in all matrices, especially at lower levels (Table 7S).
Moderate matrix effects percentages varied between (21 and 79%) were observed for most of pesticides in all studied matrices. For examples the % ME values of (59, 34, 40 & 46%), (36, 31, 41 & 41%), (44, 35, 67 & 72%), (58, 56, 55 & 71%), (32, 22, 35 & 59%) and (38, 27, 52 & 55%) were obtained for cucumber, squash summer, pumpkin and melon in amidosulfuron, anilofos, bensulfuron methyl, clodinafop-p-propargyl, diflufenican and trietazine respectively.
A suppression extent of variable values of MEs were observed in flufenacet at lower and higher levels with MEs % values of (33, 55 & 71%), (23, 53 & 59%), (28, 52 & 66%) and (10, 48 & 79%) for cucumber, squash summer, pumpkin and melon, respectively. Furthermore, strong suppression of MEs 9% was observed for both cucumber and squash summer in fluazifop-p-butyl and the same extents of MEs % (5 & 15%) and (13 & 19%) were recorded in hexythiazox and prosulfocarb, respectively (Figure ). While linuron and monuron pesticides recorded ME values of 8% and picolinafen (10 & 17%) for squash summer and pumpkin matrices respectively. Such extents of suppression were originated from the organic and/or ionic nature of pesticides compounds as well as matrices contents and their interactions with target analytes during ionization process (Furey et al., Citation2013; Stahnke & Alder, Citation2015)
In contrast, melon matrix showed high enhancement extent in the signal response of chlorpropham at the minimum, medium and maximum fortified levels with MEs % values of (202, 211 & 254%), respectively (Figure ). In addition to that, melon matrix showed high MEs of (144, 143, 148, 141 & 148%) in chloridazon, chlorsulfuron, flumeturon, prometryn and propachlor, respectively. There were observed also high MEs of (161 & 169%) and (176 &153%) in oxyflurofen and metribuzin for both pumpkin and melon samples, respectively. In cucumber matrix, oxadiazon, phenmedipham and quizalofop-ethyl showed signal enhancement of MEs (157, 154 & 159%), respectively. Furthermore, in squash summer matrix, the same behavior of ion enhancement was observed in fluroxypyr, phenmedipham and quizalofop-ethyl with ME (143, 141&143%), respectively.
A tolerable response of matrix effects ranged from (80 to 120%) were observed in cinosulfuron ethyl and halosulfuron methyl at all fortified concentrations of studied matrices (Table 7S).
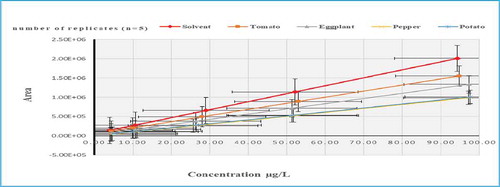
4.3.2. Matrix Effects for Solanaceae Vegetables Family Using LC-MS/MS
Four of the most popular and consumed commodities were chosen as representative matrices of Solanaceae family, i.e. tomato, eggplant, pepper and potato. Most of tested pesticides showed strong suppression in the signal intensity at minimum and medium ranges of matrix effects percentages. Such extent of suppression due to the undesired components and co-eluting, i.e. volatile pigments, sugar, lipids, etc. which affect on the chromatographic separation and occur changes in mobile phase’s properties such as pH, viscosity and surface tension. Finally, alter the ionization process of target analytes (Damalas & Eleftherohorinos, Citation2011; Gosetti et al., Citation2010; King et al., Citation2000).
In descending order, the suppression extent of matrix effects percentages was found for pepper followed by potato, eggplant and tomato, respectively (Table 8S). A Strong suppression was recorded for pepper with MEs values (2, 6, 9, 10, 12, 12, & 18%) in hexythiazox, oxyflourfen, pyriproxyfen, fenoxaprop-P-ethyl, picolinafen, prosulfocarb and linuron respectively (Figure ).
Figure 4. Slope of Calibration Mixture Solutions (solvent based standards) compared to Matrix-Matched Calibration Solutions for Pyriproxyfen.
High suppression was recorded for pepper matrix in both pendimethalin and oxyflurofen with MEs % of (17 & 6%). While for eggplant matrix (10 & 12%), respectively. In potato matrix, the same behavior of suppression was in cinidon ethyl and mefenpyr-diethyl with MEs (15 & 17%), respectively.
Overall Solanaceae family, there was a suppression of MEs % ranged from (21 to 79%) at the minimum range in the following herbicides: butachlor, chlorbromuron, clodinafop-p-propargyl, diflufenican, foramsulfuron, halosulfuron methyl, metribuzin, prometryn, pyrazosulfuron ethyl, quinmerac, quizalofop-ethyl, simetryn, terbumeton, terbutryn, thifensulfuron methyl, thiobencarb and tribenuron methyl.
On the other hand, the enhancement extents of matrix effects were observed for tomato being very acidic matrix and affecting the target analytes. Therefore, trietazine, linuron (Figure ) and quinmerac recorded MEs of (379, 314 & 180%), respectively (Agüera et al., Citation2004; Chawla et al., Citation2017). The acidic nature of tomato could be a reason for presenting strong enhancement of ME>150% in cinidon ethyl, flufenacet, lenacil and thifensulfuron methyl. In addition to that, tomato matrix showed MEs % ranged from (80 to 120%) at lower and higher concentration levels in ametryn, anilofos, bensulfuron methyl, chlorpropham, clomazone, dimethenamid, diuron, fluroxypyr, metamitron, metosulam, picolinafen, and propachlor.
Figure 5. Slope of Calibration Mixture Solutions (solvent based standards) compared to Matrix-Matched Calibration Solutions for Linuron.
A tolerable matrix effect percentage ranged from (80 to 120%) was observed for tomato, eggplant and potato in amidosulfuron, chloridazon and chlorsulfuron (Figure 5S) and for tomato, pepper and potato matrices in flumeturon.
4.3.3. Matrix Effects for Leafy Vegetables Family Using LC-MS/MS
Leafy green vegetables, i.e. lettuce, parsley, dill and spinach are an important part of a healthy and balanced diet as well as rich in carbohydrates, vitamins, fibers, lipids and many of supplementary nutrients. The highest pesticides residues are always found on leafy vegetables due to their nature of crop, i.e. being cultivated along with other crops and due to their broad leaves where pest attack is higher (Sohair et al., Citation2013). In our study, the maximum suppression of matrix effects due to leafy vegetables was observed for parsley matrix followed by dill, spinach and lettuce, respectively. Most of the studied pesticides showed suppression extent in the signal intensity, especially at lower and medium levels of matrix effects (Table 9S). Almost, high suppression was observed only for parsley matrix, whereas MEs % values were (2, 4, 5, 14, 15, 16, 16, 18 & 19%) in trietazine, terbutryn, prosulfocarb, mefenpyr-diethyl, metamitron, quizalofop-ethyl, thiobencarb, picolinafen and flufenacet, respectively.
A Significant effect of ion suppression (20%<MEs<80%) were obtained for all investigated matrices in the following herbicides: ametryn, butachlor, chlorbromuron, dimethenamid, methabenzthiazuron, propazine, pyriproxyfen and simetryn, except for diuron which noted a low matrix effect 9% in parsley matrix (Figure ).
Figure 6. Slope of Calibration Mixture Solutions (solvent based standards) compared to Matrix-Matched Calibration Solutions for Diuron.
On the other hand, there were variations in the signal enhancement response due to interaction with the matrix components of lettuce matrix resulting in MEs % of (282, 227, 208, 196, 168, 164 & 163%) in the following pesticides: pendimethalin, pyrazosulfuron ethyl, cinidon ethyl, flufenacet, foramsulfuron, oxadiazon and mefenpyr-diethyl, respectively. Furthermore, phenmedipham showed strong enhancement of MEs % (179, 174, 167 & 151%) for lettuce, spinach, dill and parsley, respectively (Figure ).
Figure 7. Slope of Calibration Mixture Solutions (solvent based standards) compared to Matrix-Matched Calibration Solutions for Phenadipham.
Leafy green vegetables were considered the most variable family in matrix effects behavior as the studied analytes were varied in their response among different investigated matrices. Variable MEs % ranged from (80 to 120%) were observed for lettuce and spinach in diflufenican, dill and spinach in flumeturon, lettuce and dill in thifensulfuron methyl. The same behavior of matrix effect was observed also for lettuce matrix in the following pesticides: amidosulfuron, anilofos, chlorpropham, chlorsulfuron, clodinafop-p-propargyl, prometryn, propachlor, terbumeton and triasulfuron (Figure 6S) and for spinach matrix in bensulfuron methyl and metosulam.
Overall, matrix effects were evaluated in 57 herbicides for various vegetables matrices including cucumber, squash summer, pumpkin, melon, tomato, eggplant, pepper, potato, lettuce, parsley, dill and spinach, respectively. Accordingly, pesticides were categorized into five groups based on the behavior on vegetables matrices due to matrix components and co-eluting agents effects (Figure ). First group: High enhancement (ME>150%), the highest number of herbicides was observed for tomato, lettuce, pepper and potato respectively as the following 12, 9, 8 & 8 compounds. Second group: Moderate enhancement (120%<ME≤150 %), the highest number of compounds was observed for pumpkin, melon, lettuce and tomato respectively as the following 13, 12, 12 and 10 compounds. Third group, the number of herbicides with tolerable ME ranged from (80–120%) was obtained for tomato followed by lettuce as following: 17 and 11 compounds. Fourth group: Moderate suppression (20%<ME <80%), the highest number was observed for dill, parsley and spinach as the following: 42, 40 and 36 compounds. Fifth group: High suppression (ME<20%), squash summer, pepper and parsley recorded high numbers as the following 11, 9 and 9 compounds, respectively. Finally, the highest count of suppression extent was observed for parsley matrix while the highest enhancement was observed for tomato matrix.
Figure 8. Matrix effect (ME %) behavior for herbicides in various vegetables matrices.
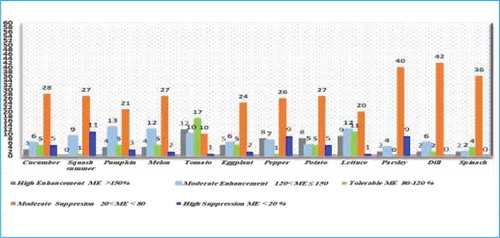
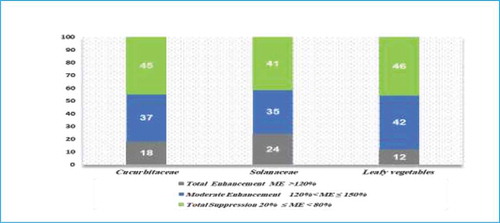
Based on the graph (Figure ) while comparing the three families of vegetables matrices: Leafy vegetables, Cucurbitaceae and Solanaceae recorded total suppression of MEs 46%, 45% and 41% and moderate enhancement of MEs 42%, 37% and 35%, respectively for 57 studied herbicides. While Solanaceae, Cucurbitaceae, and leafy vegetables presented total enhancement of MEs 24%, 18% and 12%, respectively. Finally, it was observed that the leafy vegetable family has the highest total suppression and moderate enhancement counts, while Solanaceae has the highest number of total enhancement count.
Figure 9. Overall Matrix effect (ME %) behavior for herbicides in Cucurbitaceae, Solanaceae and leafy vegetables families.
Post comparison and understanding the relationship of the above-mentioned data the following key points can be discussed. The high ME in different matrices could be associated to the volatiles, oils, terpenes and pigments that co-elute with the target analytes. The intrusion of the co-eluting compounds with the ionization of the target compounds, affect their signal intensity, and in turn generate the ME. Signal enhancement of ion-response can be attributed to various vegetables matrices, because of high surface activity resulting in fine droplets in +ESI: (Positive-Electro-Spray Ionization) response. Where the strong affinity for the surface due to the presence of non-polar region, oxygenated groups and reaction targets like carbonyl groups, could increase the ionization process especially, with the presence of co-eluting matrix-components which comply with this reference (Ahumada et al., Citation2012; Cech et al., Citation2001; Martínez et al., Citation2005). Most of the studied herbicides displayed signal suppression in most of studied matrices. This could be due to the presence of undesired components i.e. volatiles, pigments, and other coelutes in the chromatographic separation. Matrix components could either access to the surface of droplets and successive ion evaporation or induce changes in eluent’s properties like surface tension, viscosity, volatility, and pH, thus affecting the ionization process.
As it has been established that there is a relationship between the chemical composition of herbicides and their behavior, the suppression and enhancement of the studied herbicides based on their chemical group were evaluated, and could be categorized into four main groups as follows:
1. Urea group: Amidosulfuron, bensulfuron methyl, cinsulfuron ethyl, diuron, formasulfuron, halosulfuron methyl, linuron, metsulfuron methyl, monuron, pyrazosulfuron ethyl, triasulfuron, etc. showed suppression ranged from (5 to 75%). Highest enhancement was observed for Solanaceae vegetables family in linuron, halosulfurom methyl, cinsulfuron ethyl, thiasulfuron methyl and metsulfuron methyl with MEs % ranged from (219 to 314%), (132 to 293%), (127 to 185%), (152 to 168%) & (153 to 165%), respectively. However, in Cucurbitaceae family, cinsulfuron ethyl, halosulfuron methyl and metsulfuron methyl were the highest.
2. Pyridin and pyidazin group’s: Cloridazon, clodinafop-p-propargyl, difluenica, fluzafop-p-butyl, picolinafen, pyriproxyfen, etc. All pesticides showed suppression ranged from (3 to 79%), except for cloridazon showed enhancement for Cucurbitaceae family i.e. pumpkin and melon with MEs % of (138 & 144%) while normal matrix effects noticed for Solanaceae family, i.e. tomato, eggplant and potato of MEs (80–120%).
3. Carbamates: Chlorpropham, phenmedipham, prosulfocarb, thiobencarb, etc. Suppression in the signal intensity, ranged from (5 to 77%) were obtained for all carbamates herbicides except for phenmedipham showed enhancement of MEs % (179, 174 & 167%) for lettuce, spinach and dill, respectively. Furthermore, chlropropham showed enhancement of MEs % (254 & 208%) in both melon and pumpkin, respectively. However, chlorpropham represented tolerable ME % (80–120%) for tomato and lettuce.
4. Trietazine: Ametryn, metamitron, prometon, prometryn, propazine, simetryn, terbumeton, terbutryn, teietazine, etc. All compounds showed suppression ranged from (2 to 78%). No matrix effects were recorded for melon, eggplant and tomato, lettuce in the following herbicides: simetryn, prometryn and ametryn, respectively.
5. Conclusion
The validated method was applied for determination of herbicide residues in vegetable samples. It was elucidated that; the phenomena of matrix effects have become one of the great concerns among the quantitative analysis of pesticide residues in food using LC-MS/MS. In the present study, matrix effects were studied for various commodities belonging to different vegetables families. The matrix components and other co-eluting agents need to be carefully evaluated during the method performance in order to accomplish reliable analytical results. The concept of using selective representative matrix and/or the grouping of commodities were evaluated and found to be inappropriate for such pesticides commodities combinations and does not lead to accurate quantitative results. Therefore, individual matrix-matched calibration should be used as alternative practical approach to compensate for matrix effects. In addition, fortified matrix spike could be run along solvent calibration solution to correct the effect resulting from matrix.
Compliance with ethical standards
Ethics approval: This article does not involve any human or animal participants by any of the given authors.
Supplemental Material
Download PDF (1.2 MB)Acknowledgements
Open Access funding provided by the Qatar National Library.
Supplementary material
Supplemental data for this article can be accessed here.
Additional information
Funding
Notes on contributors

Ali S. Mohammed
Our research group is concerned with research topics belonging to food contaminants analysis, quality control and assurance. Therefore, our interest is focused on the development of sensitive analytical methods for screening and quantification of food contaminants in accordance to SANTE and Eurachem guidelines. Furthermore, monitor and conduct risk assessment of contaminates, such studies are required to ensure safety of locally consumed foods that might be contaminated by various residues (pesticides, mycotoxins and trace elements). Therefore, evaluation of the interest problems, i.e. matrix effects that might affect the reliability of results during the analysis of pesticide residue in food becomes important. In fact, results obtained were part of method performance that has been carried out in our ISO-17025 accredited laboratory using QuEChERS method coupled to LC-MS/MS and GC-MS/MS. This study is critical for further efficient evaluation to matrix effects in other groups of pesticides in various commodities of vegetables and fruits.
Related Research Data
References
- Agüera, A., López, S., Frenández-Alba, A. R., Contreras, M., Crespo, J., & Piedra, L. (2004). One-year routine application of a new method based on liquid chromatography–tandem mass spectrometry to the analysis of 16 multiclass pesticides in vegetable samples. Journal of Chromatography. A, 1045(1–2), 125–16. https://doi.org/10.1016/j.chroma.2004.06.039
- Ahumada, D. A., & Zamudio, A. M. (2011). Revista Colombiana de Química, 40(2), 227–246. http://www.scielo.org.co/scielo.php?script=sci_arttext&pid=S0120-28042011000200007.
- Ahumada, D. A., Zamudio, A. M., & Esp, J. C. (2012). Matrix effect in pesticide analysis by ultra fast liquid chromatography coupled to mass spectrometry. Journal of the Brazilian Chemical Society, 23(4), 661–669. https://doi.org/10.1590/S0103-50532012000400011
- Anastassiades, M., Lehotay, S. J., Stajnbaher, D., & Schenck, F. J. (2003). Fast and easy multiresidue method employing acetonitrile extraction/partitioning and “dispersive solid-phase extraction” for the determination of pesticide residues in produce. Journal AOAC International, 86(2), 412–431. https://doi.org/10.1093/jaoac/86.2.412
- Banerjee, K., Dasharath, P., Dasgupta, O. S., Patil, S. B., Patil, S. H., Savant, R., & Adsule, P. G. (2007). Validation and uncertainty analysis of a multi-residue method for pesticides in grapes using ethyl acetate extraction and liquid chromatography–tandem mass spectrometry. Journal of Chromatography. A, 1173(1–2), 98–109. https://doi.org/10.1016/j.chroma.2007.10.013
- Businelli, A., Vischetti, C., & Coletti, A. (1992). Fresenius Environmental Bulletin, 1(1), 583–588. https://ci.nii.ac.jp/naid/10017575826/
- Cech, N. B., Krone, J. R., & Enke, C. G. (2001). Predicting electrospray response from chromatographic retention time. Analytical Chemistry, 73(2), 208–213. https://doi.org/10.1021/ac0006019
- Chawla, S., Patel, H. K., Gor Hetal, N., VaGhela Kiran, M., SolaNKi Priti, P., & Shah, P. (2017). Evaluation of matrix effects in multiresidue analysis of pesticide residues in vegetables and spices by LC-MS/MS. Journal of AOAC International, 100(3), 616–623. https://doi.org/10.5740/jaoacint.17-0048
- Damalas, C. A., & Eleftherohorinos, I. G. (2011). Pesticide exposure, safety issues, and risk assessment indicators. International Journal of Environmental Research and Public Health, 8(5), 1402–1419. https://doi.org/10.3390/ijerph8051402
- De Smet, P. A. G. M. (1992). Adverse effects of herbal drugs (Vol. 1). Springer-Verlag. https://doi.org/10.1007/978-3-642-60367-9
- Economou, A., Botitsi, H., Antoniou, S., & Tsipi, D. (2009). Determination of multi-class pesticides in wines by solid-phase extraction and liquid chromatography-tandem mass spectrometry. Journal of Chromatography. A, 1216(31), 5856–5867. https://doi.org/10.1016/j.chroma.2009.06.031
- Eurachem guide. (2012). Quantifying uncertainty in analytical measurement (3d ed.). Eurachem. file:///C:/Users/amohammed/Documents/QUAM2012_P1.pdf
- Eurachem guide. (2014). The fitness for purpose of analytical methods – A laboratory guide to method validation and related topics (2nd ed.). Eurachem. https://www.eurachem.org/images/stories/Guides/pdf/MV_guide_2nd_ed_EN.pdf
- European Commission. (2020). EU Pesticides database. Maximum Residue Limits (MRLs). https://ec.europa.eu/food/plant/pesticides/eu-pesticides database/public/?event=homepage&language=EN
- European Union. (2008). Foods of plant origin, determination of pesticide residues using GC–MS and/or LC–MS/MS following acetonitrile extraction/partitioning and clean-up by dispersive SPE QuEChERS method. BS EN, 15662.
- Ferrer, C., Lozano, A., Agüera, A., Girón, A. J., & Fernández-Alba, A. R. (2011). Overcoming matrix effects using the dilution approach in multiresidue methods for fruits and vegetables. Journal of Chromatography. A, 1218(42), 7634–7639. https://doi.org/10.1016/j.chroma.2011.07.033
- Fialkov, A. B., Steiner, U., Lehotay, S. J., & Amirav, A. (2007). Sensitivity and noise in GC–MS: Achieving low limits of detection for difficult analytes. International Journal of Mass Spectrometry, 260(1), 31–48. https://doi.org/10.1016/j.ijms.2006.07.002
- Furey, A., Moriarty, M., Bane, V., Kinsella, B., & Lehane, M. (2013). Ion suppression; A critical review on causes, evaluation, prevention and applications. Talanta, 115(1), 104–122. https://doi.org/10.1016/j.talanta.2013.03.048
- Gosetti, F., Mazzucco, E., Zampieri, D., & Gennaro, M. C. (2010). Signal suppression/enhancement in high-performance liquid chromatography tandem mass spectrometry. Journal of Chromatography A, 1217(25), 3929–3937. https://doi.org/10.1016/j.chroma.2009.11.060
- Guerrero, J. A. (2003). Agronomía Colombiana, 21(3), 198–209. https://revistas.unal.edu.co/index.php/agrocol/article/view/19815.
- Hajšlová, J., Holadová, K., Kocourek, V., Poustka, J., Godula, M., Cuhra, P., & Kempný, M. (1998). Matrix-induced effects: A critical point in the gas chromatographic analysis of pesticide residues. Journal of Chromatography. A, 800(2), 283–295. https://doi.org/10.1016/S0021-9673(97)01145-X
- Hou, X., Han, M., Dai, X., Yang, X., & Yi., S. (2013). A multi-residue method for the determination of 124 pesticides in rice by modified QuEChERS extraction and gas chromatography–tandem mass spectrometry. Food Chemistry, 138(2–3), 1198–1205. https://doi.org/10.1016/j.foodchem.2012.11.089
- King, R., Bonfiglio, R., Fernandez-Metzler, C., MillerStien, C., & Olah, T. (2000). Mechanistic investigation of ionization suppression in electrospray ionization. Journal of the American Society for Mass Spectrometry, 11(11), 942–950. https://doi.org/10.1021/jasms.8b01411
- Kittlaus, S., Schimanke, J., Kempe, G., & Speer, K. (2011). Assessment of sample cleanup and matrix effects in the pesticide residue analysis of foods using postcolumn infusion in liquid chromatography–tandem mass spectrometry. Journal of Chromatography. A, 1218(46), 8399–8410. https://doi.org/10.1016/j.chroma.2011.09.054
- Kruve, A., Künnapas, A., Herodes, K., & Leito, I. (2008). Matrix effects in pesticide multi-residue analysis by liquid chromatography–mass spectrometry. Journal of Chromatography. A, 1187(1–2), 58–66. https://doi.org/10.1016/j.chroma.2008.01.077
- Mansour, S. A., Belal, M. H., Abou-Arab, A. A., & Gad, M. F. (2009). Monitoring of pesticides and heavy metals in cucumber fruits produced from different farming systems. Chemosphere, 75(5), 601–609. https://doi.org/10.1016/j.chemosphere.2009.01.058
- Marchi, I., Viette, V., Fathi, M., Saugy, M., Veuthey, J., Veuthey, J., & Veuthey, J.-L. (2010). Characterization and classification of matrix effects in biological samples analyses. Journal of Chromatography. A, 1217(25), 4071–4078. https://doi.org/10.1016/j.chroma.2009.08.061
- Martínez, V. J. L., Frenich, A. G., López, L. T., Martínez, S. I., Hajjaj, E. H. L., & Hassan, B. M. (2005). Selection of a representative matrix for calibration in multianalyte determination of pesticides in vegetables by liquid chromatography-electrospray tandem mass spectrometry. Chromatographia, 61(3–4), 127–131. https://doi.org/10.1365/s10337-004-0488-1
- Moura, G. C. R., Freguglia, R. M. O., Furlani, R. P. Z., Torres, N. H., & Tornisielo, V. L. (2011). Determination of pesticide residues in tomato using dispersive solid-phase extraction and gas chromatography/ion trap mass spectrometry. Journal of Brazilian Chemical Society, 22(9), 1701–1708. https://doi.org/10.1590/S0103-50532011000900012
- Ntow, W. J., Gijzen, H. J., Kelderman, P., & Drechsel, P. (2006). Farmer perceptions and pesticide use practices in vegetable production in Ghana. Pest Management Science, 62(4), 356–365. https://doi.org/10.1002/ps.1178
- Remane, D., Wissenbach, D. K., Meyer, M. R., & Maurer, H. H. (2010). Systematic investigation of ion suppression and enhancement effects of fourteen stable-isotope-labeled internal standards by their native analogues using atmospheric-pressure chemical ionization and electrospray ionization and the relevance for multi-analyte liquid chromatographic/mass spectrometric procedures. Rapid Communications in Mass Spectrometry, 24(7), 859–867. https://doi.org/10.1002/rcm.4459
- SANTE Guidance. (2017, November 21 – 22). A document on analytical quality control and method validation procedures for pesticides residues analysis in food and feed. European commission SANTE/11813/2017, Brussels Belgium. 2017rev.0.
- Sohair, A. G. A., Wasfi, M. T., & Emil, Y. S. (2013). Middle East Journal of Applied Sciences, 3(4), 216–230. http://www.curresweb.com/mejas/mejas/2013/216-230.pdf.
- Stahnke, H., & Alder, L. (2015). Mass Spectrometry for the Analysis of Pesticide Residues and their Metabolites. 161–186. NJ: John Wiley & Sons, Inc. ISBN: 978-1-118-50017-0. DOI:10.1002/9781119070771
- Stahnke, H., Kittlaus, S., Kempe, G., & Alder, L. (2012). Reduction of matrix effects in liquid chromatography–electrospray ionization–mass spectrometry by dilution of the sample extracts: How much dilution is needed? Analytical Chemistry, 84(3), 1474–1482. https://doi.org/10.1021/ac202661j
- Trufelli, H., Palma, P., Famiglini, G., & Cappiello, A. (2011). An overview of matrix effects in liquid chromatography-mass spectrometry. Mass Spectrometry Reviews, 30(3), 491–509. https://doi.org/10.1002/mas.20298
- Wilkowska, A. M., & Biziuk, M. (2011). Determination of pesticide residues in food matrices using the QuEChERS methodology. Food Chemistry, 125(3), 803–812. https://doi.org/10.1016/j.foodchem.2010.09.094
- Xu, Y., Song, N., Zhang, Q., Liu, J., Chen, J., Shi, L., Wang,, & Wang, J. (2017). A strategy for the evaluation of an analytical approach for selected pesticide residues in complex agricultural product matrices—A case study of leek. Journal of Food Chemistry, 221(1), 205–213. Epub 2016 Oct 4. https://doi.org/10.1016/j.foodchem.2016.10.009