
 ?Mathematical formulae have been encoded as MathML and are displayed in this HTML version using MathJax in order to improve their display. Uncheck the box to turn MathJax off. This feature requires Javascript. Click on a formula to zoom.
Abstract
Yield is a complex quantitative trait largely influenced by the environment. Direct selection for grain yield is less efficient in improving groundnut productivity. The selection efficiency can be enhanced by exploiting the relationship between yield and its related traits. Moreover, the use of genetically diverse parents is essential to generate genetic variation for successful selection of genotypes in a breeding program. Therefore, the study aimed at analysing the relationship between grain yield and its related traits and determining the morphological diversity among selected groundnut genotypes under natural rosette disease (GRD) infestation. The genotypes were evaluated in a 7 × 4 alpha lattice design with three replications. Data were collected on yield and yield-related traits. Correlation, path coefficient and multivariate analyses were done. The results revealed that yield was directly associated with plant height, number of pods per plant, hundred seed weight, GRD incidence and number of secondary branches. Therefore, these traits should be considered in selection when improving groundnut for yield. Cluster analysis revealed existence of diversity among the evaluated groundnut genotypes with no influence of geographical origin to the clustering pattern. The Principal Components Analysis (PCA) biplot was effective in showing the genetic distance among the genotypes and the results were comparable with those of the cluster analysis. Moreover, Shannon-Weaver diversity indices revealed existence of high diversity among the genotypes, an implication that groundnut improvement for yield is possible through selection in breeding.
PUBLIC INTEREST STATEMENT
Groundnut yield is one of the key traits that influence adoption of improved varieties. The development of high yielding varieties would be made possible through effective selection. Moreover, the use of genetically diverse parents is essential to generate genetic variation for successful selection in breeding. The study analyzed the relationship between grain yield and its related traits and determined the diversity among selected groundnut accessions based on morphological traits under natural rosette disease (GRD) infestation. The results revealed that plant height, number of pods, hundred seed weight and GRD incidence would be key traits as a proxy to yield. The multivariate analysis revealed existence of genetic diversity and effectively showed the genetic distance among the groundnut accessions. The implication is that groundnut improvement for yield is possible through breeding. The findings are of significance to breeding programs to exploit the genetic variation while using the key traits to support selection.
1. Introduction
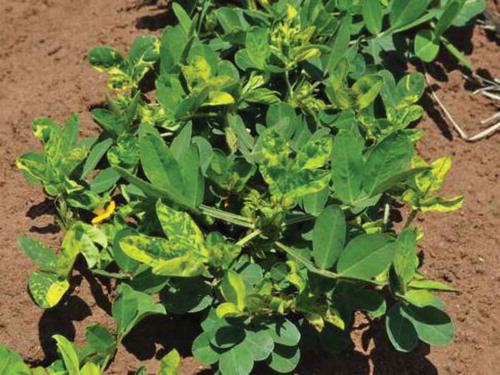
Cultivated groundnut (Arachis hypogaea L., AABB, 2 n = 4x = 40) also known as peanut, is a legume crop that originated in South America through hybridization of its diploid ancestors, Arachis duranensis (AA) and Arachis ipaensis (BB), followed by spontaneous chromosome doubling (Talawar, Citation2004; Bertioli et al., Citation2015; Zhang et al., Citation2016). The crop is grown in tropical and subtropical countries for its high-quality oil (47–53%) and easily digestible protein (24–36%) (Maiti, Citation2002; Singh & Nigam, Citation2016). The crop is the sixth and third most important source of vegetable oil and protein, respectively and ranks 13th among the world food crops (Singh & Nigam, Citation2016). However, several biotic, abiotic and socio-economic factors constraint groundnut production in Malawi and other developing countries (Chala et al., Citation2014; Chikowo et al., Citation2015). The groundnut rosette disease (GRD), is among the major biotic constraints. It is a viral disease caused by a complex of three agents (Groundnut rosette assistor virus (GRAV), Groundnut rosette virus (GRV) and a satellite-RNA (satRNA) associated with GRV) and transmitted by an aphid (Aphis craccivora Koch). Therefore, the development of high yielding cultivars that are resistant to both biotic and abiotic stresses, with farmers` preferred traits should be continuous and a priority.
Plant breeding programs aim to improve one or more traits at the same time, with yield increase being the most important objective (Mandal et al., Citation2017; Yusuf et al., Citation2017). It has been indicated that grain yield is a complex quantitative trait, resulting from an interplay of various related traits (Acquaah, Citation2009; Kiranmai et al., Citation2016). It is largely influenced by the growing environment and generally has low heritability (Luz et al., Citation2011; Mukherjee et al., Citation2016). Hence, direct selection for yield is less efficient in improving groundnut productivity. Nevertheless, efficiency in yield improvement can be enhanced by exploiting the relationship between yield and its associated traits. As such through correlation and path-coefficient analysis, it would be possible to elucidate the most important traits that would help in achieving progress (Zaman et al., Citation2011). Trait association studies are important in groundnut than other crops, because the pods are formed underground thus it may not be possible to effect proper selection prior to harvesting (Kiranmai et al., Citation2016). Correlation and path-coefficient analyses have been reported in groundnut (Patil et al., Citation2006; Rao et al., Citation2014). However, it has been indicated that their estimates are influenced by the environment and/or the genotypes used (Kiranmai et al., Citation2016).
The selection of genetically diverse parents is essential for a successful breeding program, as it provides opportunity for the development of new improved cultivars with desirable traits (Govindaraj, Citation2015; Niveditha et al., Citation2016). Cluster and principal component analysis (PCA) are useful tools for the determination of genetic relationship among genotypes in crop improvement. This is due to the fact that they group genetically similar genotypes together and create a scatter plot of genotypes with the geometrical distances among them reflecting their genetic distances with minimum distortion, respectively (Ali, Kanwal, Ahsan, Ali, Bibi, Niazi et al., Citation2015; Jolliffe, Citation2002; Mohammadi et al., Citation2003; Pereira et al., Citation2015). This study, aimed at analysing the relationship between grain yield and its associated traits through correlation and path analyses among selected groundnut genotypes under natural GRD infestation. The key objective was to identify traits contributing the most to yield and identification of genotypes that would be useful in future groundnut improvement.
2. Materials and methods
2.1. Plant materials
Twenty-eight groundnut genotypes, comprising 25 accessions originating from various countries and three cultivars released in Malawi were evaluated under natural GRD infestation (Table ).
Table 1. List of genotypes evaluated for yield and associated traits in the study
2.2. Experimental site
The genotypes were evaluated at ICRISAT Malawi, located at Chitedze Agricultural Research Station (33°38ʹE and 13°85’S) in 2008/2009 and 2017/2018 cropping seasons. The station is located 16 km West of Lilongwe (Malawi) with an altitude of 1146 meters above sea level (masl). The accessions were evaluated under natural GRD infestation, since the station is a hotspot area with high GRD pressure during the growing season, especially with late-planted groundnut crop. Based on the long-term climatic data, the station has an average minimum and maximum temperature of 16°C and 24°C, respectively, with a mean annual rainfall of 892 mm.
2.3. Experimental design and management
The 28 groundnut genotypes were evaluated in a 7 × 4 alpha lattice design with three replications. Border rows of genotype JL24 that is highly susceptible to GRD were sown around the trial to enhance GRD inoculum build-up. Each genotype was hand-sown in a 3 row-plot at a spacing of 0.6 m and 0.15 m between rows and within plants, respectively. Two seeds were planted per hill and later thinned to one seedling per hole three weeks after planting. Fertilizers and pesticides were not applied and three hand weedings were carried out. The trial was conducted under rainfed conditions supplemented with irrigation when necessary. Harvesting and shelling were done manually.
2.4. Data collection
Data on quantitative and qualitative traits were collected. These included disease incidence and severity, days to flowering and maturity, number of branches, plant height, yield and its components and shelling percentage. Disease incidence was measured according to Waliyar et al. (Citation2007), while yield and agronomic traits were measured as described for groundnut descriptors (IBPGR & ICRISAT, Citation1992). Data were collected on five randomly selected plants and 10 mature pods that were randomly chosen except for disease incidence and yield (Waliyar et al., Citation2007).
2.4.1. Percentage of disease incidence (PDI)
Visual scoring for GRD development was carried out at 60, 80 and 100 days after sowing (DAS). The number of plants showing GRD symptoms in each plot was obtained by counting and PDI was calculated as follows:
Where: PDI is the percentage of disease incidence, NIP is the number of plants showing GRD symptoms and TP is the total number of plants in a plot.
2.4.2. Days to flowering (DTF) and days to maturity (DTM)
Days to flowering and maturity were determined as the number of days between sowing date and the date when 50% of plants in a plot had flowered and matured, respectively.
2.4.3. Plant height and number of branches
Plant height (PH), and number of primary (NPB) and secondary branches (NSB) were recorded at 85 DAS. Plant height was measured from the ground to the top of the main stem axis using a ruler, whereas branch numbers were counted. These traits were recorded on the five randomly chosen plants in each plot and a mean was calculated.
2.4.4. Yield and yield components
The number of pods per plant (NPP) was recorded during harvesting by counting the mature pods on the five selected plants and a mean was determined for each plot. Pod length (PL) and pod width (PW) were measured on 10 pods randomly chosen, at the longest and widest points, respectively. The pods were sun dried to approximately 8–10% moisture content and then weighed to determine pod yield per plot. A pod sample of approximately 100 g which was randomly drawn from each plot was shelled, then the seed weighed and the shelling percentage (SP) was determined as follows:
Where: SP is the shelling percentage, SW is the seed weight and PWT is the pod weight before shelling.
One hundred seeds were counted and weighed from the shelled samples and the hundred seed weight (HSW) was recorded and expressed in grams. Seed yield (SYD) was estimated using the formula:
Where: SYD is the seed yield, PY is the pod yield per plot (Patil et al., Citation2006), PS is the plot area (m2) and SP is the shelling percentage (expressed as a fraction).
Qualitative data were recorded on 10 traits, following groundnut descriptors (IBPGR & ICRISAT, Citation1992). The recorded qualitative data included growth habit and branching type (recorded at podding stage), stem surface, leaf shape, leaf colour and flower colour (recorded at flowering), pod constriction (recorded at harvest), seed colour, primary seed colour and seed size (recorded after shelling).
Table 2. Description of qualitative traits used to collect data among the groundnut genotype tested
2.5. Data analysis
2.5.1. Correlation analysis
Phenotypic correlation analysis was performed following Pearson’s method using PROC CORR in SAS version 9.4 (SAS Institute, Citation2015). Correlation coefficients were categorized as weak (0.0–0.4), moderate (0.4–0.6) and strong (0.6–1.0) (Belsley et al., Citation2005).
2.5.2. Path-coefficient analysis
Path-coefficient analysis was carried out using two procedures, the conventional and sequential path analysis to establish the direct and indirect effects of yield component traits on yield. The conventional path analysis considered all the traits as first-order predictors with grain yield as response variable whereby the correlation coefficients were partitioned into direct and indirect effects (Dewey & Lu, Citation1959). Sequential path analysis used sequential stepwise multiple regressions, in SAS version 9.4 (SAS Institute, Citation2015), to organize the traits into first- and second-order predictors, based on their contribution to the variation in grain yield and minimum collinearity (Mohammadi et al., Citation2003). Traits with minimal contribution and/or high multi-collinearity are automatically dropped by the multiple regression model. The procedure was repeated, taking each first-order predictor as dependent variable to find their associated predictors, which were second-order predictors for grain yield. The direct and indirect effects in the different path orders were estimated (Dewey & Lu, Citation1959) and classified as negligible (0.00–0.09), low (0.1–0.19), moderate (0.2–0.29) and high (0.3–0.99) (Lenka & Misra, Citation1973). Tolerance (TOL) and variance inflation factor (VIF) were used to measure the level of multi-collinearity for each predictor trait. Tolerance (, where
is the coefficient of determination for the prediction of jth variable by the predictor variables) is the amount of variance of the selected independent variable not explained by other independent variable. The variance inflation factor is the inverse of tolerance (
) and designates the extent of effects of other independent variables on the variability of the selected independent variable (Hair et al., Citation1995; Paul, Citation2006). Generally, variance inflation factor greater than five is an evidence of high multi-collinearity (Akinwande et al., Citation2015; Belsley et al., Citation2005).
2.5.3. Cluster analysis
The measured variables were standardized to unit variance, by dividing each observation by the standard deviation of the trait (Gan et al., Citation2007). The standardized values were used for cluster analysis using UPGMA (Unweighted Pair Group Method with Arithmetic Mean) clustering method in PROC CLUSTER program in SAS version 9.4 (SAS Institute, Citation2015), with average linkage method based on Euclidean distance. The associations among the genotypes were determined using Jaccard similarity coefficients based on squared elucidian distances. The genetic distances obtained from cluster analysis were used to construct a dendrogram using PROC TREE on the same software, depicting the relationships of the genotypes using.
2.6. Principal component analysis
Principal component analysis (PCA) was performed based on the correlation matrix in SPSS version 25 (Bryman & Cramer, Citation2012) using the standardized variables. The principal component analysis (PCA) biplot was plotted using Genstat 18th Edition (Payne, Citation2014). Only the principal components with eigenvalues greater than one were considered in determining variability among the accessions (Iezzoni & Pritts, Citation1991).
2.6.1. Shannon-Weaver diversity index
The Shannon-Weaver diversity index (H’) was calculated using Microsoft Excel 2016 (Hutcheson, Citation1970). The index was used as a measure of phenotypic diversity of each qualitative trait and was determined as follows:
Where: n is the number of phenotypic classes for a trait and pi is the proportion of accessions in the ith class of an n-class trait. Each value of diversity index was divided by its maximum value () to keep the values between zero and one.
3. Results and discussion
3.1. Correlation coefficient analysis
Table shows the magnitude of relationship among the quantitative traits. The results show that there was high degree of association between some of the traits. Grain yield had significant (P < 0.001) positive correlation with plant height (r = 0.66) and number of pods per plant (r = 0.87). However, it was negatively correlated (P > 0.05) with days to flowering (r = −0.26), days to maturity (r = −0.21), number of secondary branches (r = −0.12), pod width (r = −0.17) and pod length (r = −0.20). Further, it showed non-significant positive correlation with number of primary branches (r = 0.15) and hundred seed weight (r = 0.19), but strong negative correlation with rosette incidence (P < 0.01, r = −0.66). Number of pods per plant had strong positive correlation with plant height (P < 0.01, r = 0.51), but weak positive correlation with shelling percentage (P > 0.05, r = 0.27). Positive correlation coefficients were also recorded between hundred grain weight with days to flowering (P < 0.05, r = 0.47), days to maturity (P < 0.01, r = 0.57), number of primary branches (P > 0.05, r = 0.32), number of secondary branches (P < 0.01, r = 0.52), pod width (P < 0.001, r = 0.82) and pod length (P < 0.001, r = 0.61). There was negative correlation coefficient with disease incidence (%) (P > 0.05, r = −0.09). Days to maturity had high positive correlation with days to flowering (P < 0.001, r = 0.86) and number of secondary branches (P < 0.001, r = 0.84). However, it had moderate positive correlation with number of primary branches (P < 0.001, r = 0.49) and moderate negative correlation with plant height (P < 0.01, r = −0.49).
3.2. Conventional path analysis
The conventional path analysis considered all the traits as first-order predictors with grain yield as a response variable. The estimates of direct and indirect effects are shown in Table . High levels of multi-collinearity were observed among some predictor traits. The indirect effects were lower in magnitude than the direct effects. Number of pods per plant recorded the highest positive direct effect on grain yield of 0.586, followed by days to maturity (0.332), plant height (0.281), grain yield per plant (0.259) and hundred seed weight (0.155). Disease incidence (0.019), shelling percentage (0.018) and number of primary branches (0.079) showed the lowest and negligible positive direct effects on grain yield. The number of secondary branches (−0.271) had moderate negative direct effect on yield. In addition, pod length (−0.047), pod width (−0.020) and days to flowering (−0.012) showed negligible negative direct effects. The highest positive indirect effect on yield was grain yield per plant via number of pods per plant (0.451) while the most negative indirect effect was GRD incidence through number of pods per plant (−0.410).
Table 3. Direct and indirect effects on grain yield for genotypes tested with all traits as first-order predictors
3.3. Sequential path analysis
The sequential path analysis (Table and Figure ) had low multicollinearity for all the predictor traits. The predictor traits were classified into first- and second-order predictors. This ordering provided a better understanding of their interrelationships and relative contribution to grain yield. Based on the sequential stepwise multiple regressions, plant height, number of pods per plant, grain yield per plant and hundred seed weight were considered first-order predictors, which accounted for 88% of the variation in yield (Figure ). These traits had low to high positive direct effects on grain yield, with the highest effect being observed for number of pods per plant (0.552), followed by grain yield per plant (0.276), plant height (0.236) and hundred seed weight (0.177). The indirect effects of grain yield per plant (0.425) and plant height (0.282) on overall yield were the highest (Table and ). These indirect effects were higher in magnitude than the corresponding direct effects, while the rest were lower. The second-order predictors included number of secondary branches, rosette disease incidence (%), pod length and pod with. The sequential path analysis of the second-order predictors over the first-order predictors, revealed that 44% of the variation for plant height was due to number of secondary branches and groundnut rosette disease incidence. They both had high negative direct effects on plant height of −0.388 and −0.510, respectively, and negligible indirect effects. In the same order path, groundnut rosette disease incidence (−0.698) and pod length (−0.405) had high negative direct effects on number of pods per plant and together accounted for 63% of the variation in number of pods per plant. Pod width and rosette incidence explained 70% of the variation in hundred grain weight. The pod width had high positive direct effect (0.859) whereas groundnut rosette disease incidence showed moderate negative direct effect (−0.231). These two second-order predictors had lower indirect effects on hundred grain weight. The other remaining traits (days to flowering and maturity, number of primary branches and shelling percentage) were automatically dropped by the sequential path analysis multiple regression model. The implication is that these traits were found to have negligible contribution to variation in yield.
Figure 1. Cuause and effect relationships among the first and second-order predictor traits associated with grain yield
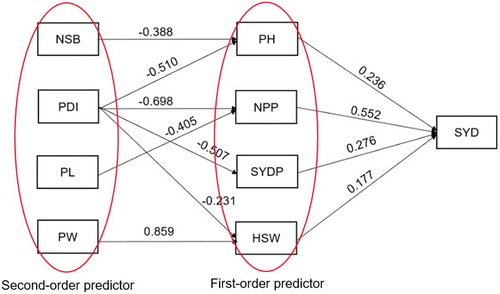
Table 4. Estimates of direct and indirect effects of different traits on grain yield for the groundnut genotypes tested
3.4. Cluster analysis
Cluster analysis showed a clear variation among the evaluated groundnut accessions (Figure and ). At truncation level of 0.85 in the Jaccard coefficient scale, the genotypes were grouped into four clusters. The similarity coefficients ranged between 0.4 and 0.85 indicating high level of genetic diversity among the genotypes. The cluster means for the recorded quantitative traits are shown in Table . Apart from other differences among the clusters, botanical grouping prevailed. Cluster II was the largest with 13 genotypes (46.4% of the total germplasm) which were mostly Spanish and Valencia. The genotypes in this cluster had low yield. Cluster I and III had seven (25%) and three (11%) of the genotypes, respectively, whereby most of them were the Virginia type. High hundred grain weight was observed in Cluster 1. The least number of genotypes (2) were observed in cluster IV, and these were high yielding and rosette resistant Spanish type. Genotype ICG 6813 was distinct and close to the first cluster while ICG 14985 and ICG 12509 were distinct and close to the fourth cluster.
Figure 2. Dendrogram generated for the 28 groundnut genotypes using UPGMA linkage cluster analysis based on Jaccard similarity coefficient
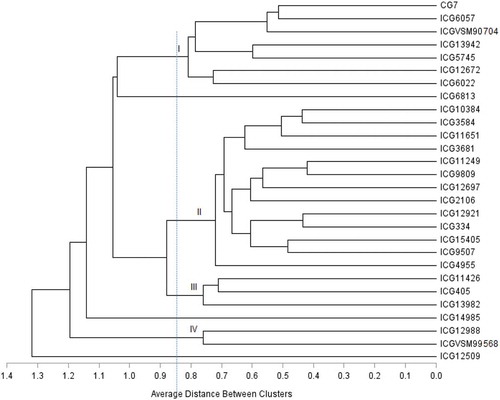
Table 5. Means for 13 quantitative traits of the 28 groundnut genotypes tested per cluster
Table 6. Principal component analysis scores for the 13 quantitative traits assessed among the genotypes
3.5. Principal component analysis
The first three principal components accounted for most of the variation observed and cumulatively explained 77.44% of the total variation among the 13 quantitative traits (Table ). The first principal component (PC1) had an eigenvalue of 5.27 and explained 40.5% of the total variation. This partitioned genotypes mainly based on grain yield, yield per plant, number of pods per plant, plant height and groundnut rosette disease incidence. This component discriminated the genotypes based on productivity and response to the groundnut rosette disease. The genotypes were therefore separated according to their superiority and resistance. The second principal component (PC2) accounted for 24.8% of the total variation, with most of the variation being attributed to days to flowering and maturity, number of primary and secondary branches. This component can be associated with physiological and geneology traits, whereby genotypes were separated based on their botanical groups (Spanish, Valencia and Virginia). The traits that contributed most to the third principal component (PC3), that accounted for 12.09% of the total variation were pod width and pod length.
Table 7. Shannon-Weaver diversity indices for the 10 qualitative traits
3.6. Principal component analysis biplot
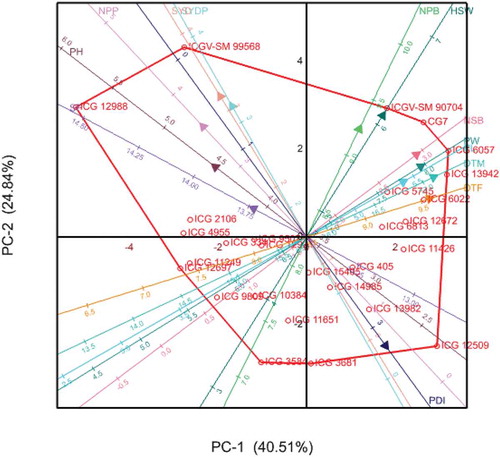
The principal component analysis (PCA) biplot (Figure 3) shows the relationship among the different variables and genotypes with respect to the first two principal components. The geometrical distances among genotypes in the biplot reflect the genetic distances among them. Smaller angles between dimension vectors in the same direction indicated high correlation of the traits in relation to discrimination of genotypes. Genotypes excelling in a particular trait were plotted closer to the vector line and further in the direction of that particular vector, often on the vertices of the convex hull. Genotypes ICGV-SM 99568 and ICG 12988 excelled in grain yield, which was contributed mostly by number of pods per plant, shelling percentage and plant height. Genotypes ICG 13942 and ICG 6057, being Virginia types were plotted in the direction of late maturing genotypes as expected. Genotypes ICGV-SM 90704 and CG7 were clustered together in the direction of high hundred seed weight and high number of secondary branches. Genotype ICG 12509 was plotted in the direction of high disease incidence. The high yielding and less diseased genotypes (lower incidence values) were plotted at the positive side of the biplot. It was evident that the first principal component analysis (PCA) scores effectively separated the genotypes.
Figure 3. Principal component analysis scores biplot of genotypes showing which-won where in relation to specific traits
3.7. Shannon-Weaver diversity index
Diversity indices (H`) were determined to compare phenotypic diversity among the 10 qualitative traits among the groundnut genotypes. Generally, high diversity indices were observed, which ranged between 0.95 for leaf colour and 0.9996 for flower colour. The diversity indices indicate the existence of high diversity for the qualitative traits among the genotypes and this was consistent with results of the cluster analysis.
4. Discussion
4.1. Correlation analysis
Grain yield had positive correlations with number of pods per plant, plant height, shelling percentage, hundred seed weight and number of primary branches. Similar associations have been reported in previous studies by Zaman et al. (Citation2011) and Rao et al. (Citation2014). These positive associations suggest that selecting for these traits would simultaneously contribute to improvement in yield. The strong positive correlation between grain yield and number of pods per plant may suggest that these traits share some common genes (Almeida et al., Citation2014; Kozak & Azevedo, Citation2014). Moreover, one SSR marker has been linked to both traits, and another marker to pod length and hundred seed weight (Gomez Selvaraj et al., Citation2009), and this agrees with the observed strong positive correlation between the two traits in the current study. The positive correlation between grain yield and plant height may indicate that tall genotypes have more capacity to accumulate photo-assimilates, resulting in higher yields. This is of significance to breeding programs that height should be a key trait in selection for yield. The implication is that selection based on these high positively correlated traits could maximize yield in groundnut.
Grain yield showed strong negative correlation with rosette disease incidence, confirming previous reports that the disease has a devastating effect on groundnut productivity (Mohammed et al., Citation2018; Muitia, Citation2011; Van der Merwe et al., Citation2001). This further confirms the negative effect that the disease has on grain yield, whereby 100% yield losses can occur depending on the stage of growth at which infection occurs. Grain yield also showed weak negative correlations with days to flowering and maturity. Similar results were observed by Khan et al. (Citation2000), Meta and Monpara (Citation2010), and Rathod and Toprope (Citation2018). Differences in flowering pattern and days to 50% flowering lead to variation among genotypes, thus the possible contribution to the weak negative correlation. This agrees with previous reports that variation in pod number and ultimate yield is due to both the timing and the initial rate of flower production and genotype (Craufurd et al., Citation2000). However, weak positive correlations between yield with days to flowering and maturity were reported by Reddy et al. (Citation2017). This is particularly true among the Virginia types that flower and mature late, therefore endowed with sufficient time to accumulate photo-assimilates, resulting in higher yields. This negative and/or weak positive correlation between flowering, a phenological trait with yield make it a poor trait for selection. The number of secondary branches per plant had a weak negative correlation with yield, contradicting the previous strong positive correlations reported by Balaraju and Kenchanagoudar (Citation2016). This disparity in correlation coefficients results could be due to differences in either genotypes and/or environment used in these studies.
4.2. Conventional and sequential path analysis
The correlation analysis may not provide a clear picture of the importance of each secondary trait in determining yield (Dewey & Lu, Citation1959; Kozak & Azevedo, Citation2014). Wright (Citation1921), developed path-coefficient analysis, which partitions the correlation coefficients into direct and indirect effects, allowing the estimates of contribution of each trait to yield. Several researchers have used the conventional path analysis (all the traits used as first-order predictors) in groundnut, and the traits often highlighted in this regard were number of pods per plant (Patil et al., Citation2006; Rao et al., Citation2014), plant height (Reddy et al., Citation2017), hundred seed weight (Rao et al., Citation2014; Zaman et al., Citation2011), days to maturity and number of secondary branches (Patil et al., Citation2006). The conventional path analysis in the current study, revealed that number of pods per plant, days to maturity, plant height and hundred seed weight had high positive direct effect on grain yield agreeing with findings from earlier studies (Patil et al., Citation2006; Rao et al., Citation2014; Reddy et al., Citation2017). The number of secondary branches had high negative effect on yield, whereas that of pod width and pod length though negative was negligible. The results are contrary to earlier reports by Patil et al. (Citation2006) that these traits have positive contribution to grain yield. The difference in results between the current and previous studies, could be explained by the genotypes used and their reaction to groundnut rosette disease. For example, the Virginia (which generally produce high number of secondary branches) and Valencia (which have long pods) were low yielding, mainly due to the fact that they were susceptible. Hence, more studies should be conducted, particularly under both rosette disease and disease free-environments, to ascertain the contribution of these traits on yield across the three botanical groups. High levels of multi-collinearity were observed for some predictor traits in the conventional path analysis in the current study. Although conventional path analysis easily identifies the direct and indirect effects of secondary traits on grain yield, it usually leads to high levels of multi-collinearity, which confound the detection and interpretation of the actual contribution of each of the traits to yield (Blalock, Citation1963; Mohammadi et al., Citation2003).
Specific contribution of each trait to yield was therefore explored further through sequential path analysis, that automatically drops traits with negligible contribution to yield and/or with high multi-collinearity. The sequential path analysis, resulted in low multi-collinearity for all the predictor traits and allowed ordering of these traits into first and second-order predictors through sequential stepwise multiple regression. These provided a better understanding of the interrelationships among the traits and their relative contribution to yield (Kozak & Azevedo, Citation2014; Olivoto et al., Citation2017). The magnitude of contribution of the secondary traits to grain yield varied, and this should be considered for more efficient selection (Figure ). The results revealed that high grain yield was directly associated with taller plant types, higher number of pods per plant, yield per plant and hundred seed weight. This is further linked to higher pod width, pod length, lower rosette disease incidence and number of secondary branches. Similar to the current results of the study, the number of pods per plant and hundred seed weight have been reported consistently to have positive direct contribution to yield (Rao et al., Citation2014; Reddy et al., Citation2017; Zaman et al., Citation2011). These researchers reported positive and significant direct effects of the latter traits on grain yield. Hence, more emphasis should be given to these traits when selecting for grain yield in groundnut. Generally, path analysis is influenced by the environment and/or the genotypes used, supporting the divergence between the current and the earlier reports (Kiranmai et al., Citation2016).
4.3. Cluster and principal component analysis
Clustering genotypes based on their agro-morphological characters is useful as it assists in identification and selection of best performers and genetically diverse parents for use in breeding pipelines (Govindaraj, Citation2015; Niveditha et al., Citation2016). The study indicated the presence of diversity among the tested groundnut genotypes. Groundnut genotypes grouped in different clusters could be evaluated for combining ability to constitute a pool of elite parents. These findings are supported by previous reports by Siddiquey et al. (Citation2006) and Banerjee et al. (Citation2007), that there is high genetic diversity in groundnut. The grouping of the genotypes indicated that geographical origin had no influence on clustering pattern. Moreover, this is an indication that geographical diversity is not a measure of genotypic diversity. Similar results were reported in groundnut by Ariyo (Citation1987); and Makinde & Ariyo, Citation2010) and in maize by Subramanian and Subbaraman (Citation2010). The high Shannon-Weaver diversity indices, which indicated the existence of high diversity for the qualitative traits among the accessions, are consistent with results of the cluster analysis. The findings of the current study are also consistent with previous studies that reported high diversity indices for qualitative traits in groundnut (Gokidi, Citation2005; Upadhyaya et al., Citation2002).
The principal component analysis revealed three components with eigenvalues greater than one. Components with eigenvalues greater than one are meaningful and theoretically have more information than any single variable alone (Iezzoni & Pritts, Citation1991). The traits correlated with the three meaningful principal components are important as they contributed the most towards divergence of the groundnut accessions. The first and the second component explained most of the variation among the accessions. Similar results were reported in groundnut (Makinde & Ariyo, Citation2010) and in soybean (Aondover et al., Citation2013; El-Hashash, Citation2016). The first component had eigenvalue of 5.27 and was effective in partitioning yield and GRD related traits. This component can be called productivity and GRD response dimension, since they discriminated the genotypes according to their yield and reaction to the groundnut rosette disease. The second component was correlated with days to flowering, days to maturity, number of primary and secondary branches, and separated the accessions in such way that the Virginia types were plotted together at the positive side of the biplot. The third component had an association with pod width and pod length, suggesting that it represents the pod size. These findings are in agreement with previous studies by Niveditha et al. (Citation2016), that the first principal component is highly correlated with yield-related traits in groundnut. Moreover, the PCA biplot was effective in showing the genetic distance among the accessions with results consistent to those of the cluster analysis. For instance, ICGV-SM 99568 and ICG 12988 were clustered together in both analyses. Similar trend was reported earlier in groundnut by Niveditha et al. (Citation2016). As such the groundnut rosette disease, that highly compromise productivity should be a must have trait in breeding programs. High diversity for the qualitative traits among the genotypes was evident and this was consistent with results of the cluster analysis. Flower colour had the highest diversity index while leaf colour recorded the lowest, revealing more and less diversity for these traits, respectively. These findings are consistent with previous studies that reported high diversity indices for qualitative traits in groundnut (Gokidi, Citation2005; Upadhyaya, Citation2003; Upadhyaya et al., Citation2002). The implication is that these qualitative traits can complement quantitative traits in the selection process as a part of groundnut improvement initiative.
5. Conclusions
The sequential path analysis clearly indicated that high yield was directly associated with taller plant types, higher number of pods per plant and hundred seed weight. It is imperative that these traits should be prioritized when improving grain yield in groundnut. The cluster analysis revealed existence of diversity among the evaluated groundnut genotypes and geographical origin did not have any influence on clustering pattern. The first principal component Analysis (PCA) scores explained 40.5% of the total variation, mainly associated to genotype, yield and groundnut rosette disease incidence traits. The PCA biplot was effective in showing the genetic distance among the genotypes and their discrimination based on key traits of importance in groundnut. The latter results were consistent to those of the cluster analysis. Moreover, the Shannon-Weaver diversity indices revealed existence of high diversity among the genotypes, a key driver for groundnut improvement through selection. Genotypes ICGV-SM 99568 and ICG 12988 were the most superior among the genotypes tested and therefore could be exploited in groundnut breeding to improve on yield.
Conflicts of interest
“The authors declare no conflict of interest.”
Authors key research activities, including a note on how the research reported in this paper relates to wider projects or issues
The authors constitute the groundnut improvement team for the International Crops Research Institute (ICRISAT) in Eastern and Southern Africa Region. The groundnut research program is involved in impact-oriented research to underpin agriculture growth by unlocking productivity using highly productive, resilient groundnut varieties. The efforts are geared towards maintaining a breeding program that is efficient, effective, and has rapid and widespread impact by addressing the yield gap and low productivity of groundnut attributed to several factors. Deliberate efforts are therefore made to exploit existing opportunities, and among them is enhancement of breeding efficiency through gene pool diversification (new genetic resources; use of elite material, increased number of crosses). This has been strengthened further by modernization of operations to enhance selection accuracy including genomic-supported process. The current study thus contributes significantly to these efforts since the findings will support the gene pool diversification and defining of specific traits to progress in selection.
Acknowledgements
The technical support in execution of field experiments by field technicians at the International Crops Research Institute for the Semi-Arid Tropics is highly appreciated. The logistical support by the administrative country office contributed immensely to the success of the research
Additional information
Funding
Notes on contributors
Nelson Mubai
Nelson Mubai is a researcher and lecturer at the School of Agricultural Sciences, Save University of Mozambique. His areas of research include: Plant Breeding, Genetics and Biotechnology. Julia Sibiya is an Associate Professor in Plant Breeding and Academic Leader in the School of Agricultural, Earth and Environmental Sciences, University of KwaZulu-Natal, South Africa. Her research focuses mainly on maize and sorghum and supervision of postgraduate students. James Mwololo is a scientist working at International Crops Research Institute for the Semi-Arid Tropics as a groundnut breeder. His current research focus on development of improved groundnut varieties using modern technologies and innovations to address global challenges. Patrick Okori is a Principal scientist, at the International Crops Research Institute for the Semi-Arid Tropics and a country director of Malawi office. His research focus include legume plant breeding and genetics, coupled with extensive knowledge in allied socio-economic disciplines, needed to unlock genetics in crops.
References
- Acquaah, G. (2009). Principles of plant genetics and breeding (2 ed., pp. 758). John Wiley & Sons, Bowie State University.
- Akinwande, M. O., Dikko, H. G., & Samson, A. (2015). Variance Inflation Factor: As a Condition for the Inclusion of Suppressor Variable(s) in Regression Analysis: Open Journal of Statistics., 5, 754–22.
- Ali, F., Kanwal, N., Ahsan, M., Ali, Q., Bibi, I., & Niazi, N. K. (2015). Multivariate analysis of grain yield and its attributing traits in. different Maize Hybrids Grown under Heat and Drought Stress. Scientifica, 1–6. https://doi.org/10.1155/2015/563869
- Almeida, W. S. D., Fernandes, F. R. B., Teófilo, E. M., & Bertini, H. C. D. M. (2014). Bertini. Correlation and path analysis in components of grain yield of cowpea genotypes. . Revista Ciência Agronômica, 45(4), 726–736. https://doi.org/10.1590/S1806-66902014000400010
- Aondover, S., Lekan., B. L., & Terkimbi, V. (2013). Correlation, path coefficient and principal component analysis of seed yield in soybean genotypes. International Journal of Advance Research, 1(7), 1–5. http://www.journalijar.com/uploads/2013-10-03_105313_753.pdf
- Ariyo, O. J. (1987). Multivariate analysis and the choice of parents for hybridization in Okra (Abelmoschus esculentus (L.) Moench). Theoretical and Applied Genetics, 74(3), 361–363. https://doi.org/10.1007/BF00274718
- Balaraju, M., & Kenchanagoudar, P. (2016). Genetic variability for yield and its components traits in interpecific derivates of groundnut (Arachis hypogea L.). Journal of Farm Science, 29(2), 172–176. http://14.139.155.167/test5/index.php/kjas/article/viewFile/7965/8225
- Banerjee, P., Maity, S., Maiti, S. S., & Banerjee, N. (2007). Influence of genotype on in vitro multiplication potential of Arachis hypogaea L. Acta Botany Croat, 66(1), 15–23. https://www.researchgate.net/publication/27196504_Influence_of_genotype_on_in_vitro_multiplication_potential_of_Arachis_hypogaea_L/citations
- Belsley, D. A., Kuh, E., & Welsch, R. E. (2005). Regression diagnostics: Identifying influential data and sources of collinearity (pp. 292). John Wiley & Sons.
- Bertioli, D. J., Cannon, S. B., Froenicke, L., Huang, G., Farmer, A. D., & Cannon, E. K., Liu, X., .. ...Ozias-Akins, P. (2015). The genome sequences of Arachis duranensis and Arachis ipaensis, the diploid ancestors of cultivated peanut. Nature Genetics, 48(4), 438–446. https://doi.org/10.1038/ng.3517
- Blalock, H. M., Jr. (1963). The problem of multicollinearity. Social Forces. Correlated Independent Variables, 42(2), 233–237. https://doi.org/10.1093/sf/42.2.233
- Bryman, A., & Cramer, D. (2012). Quantitative data analysis with IBM SPSS 17, 18 & 19: A guide for social scientists (pp. 368). Routledge.
- Chala, A., Abate, B., Taye, M., AMohammed, T., Alemu, & Skinnes, H. (2014). Opportunities and constraints of groundnut production in selected drylands of Ethiopia. Drylands Coordination Group, DCG Report No. 74.
- Chikowo, R., Snapp, S., & Hoeschle-Zeledon, I. (2015). Groundnut production in Malawi: The cash’cow’and butter that nourishes families. Africa RISING Brief 36. ILRI.
- Craufurd, P. Q., Wheeler, T. R., Ellis, R. H., Summerfield, R. J., & Prasad, P. V. (2000). Escape and tolerance to high temperature at flowering in groundnut (Arachis hypogaea L.). Journal of Agricultural Science, 135(4), 371–378. Cambridge. https://doi.org/10.1017/S0021859699008394
- Dewey, D. R., & Lu, K. H. (1959). A correlation and path-coefficient analysis of components of crested wheatgrass seed production. Agronomy Journal, 51(9), 515–518. https://doi.org/10.2134/agronj1959.00021962005100090002x
- El-Hashash, E. F. (2016). Genetic diversity of soybean yield based on cluster and principal component analyses. Journal of Advances in Biology & Biotechnology, 10(3), 1–9. https://doi.org/10.9734/JABB/2016/29127
- Gan, G., Ma, C., & Wu, J. (2007). Data clustering: Theory, algorithms, and applications (pp. 466). Siam.
- Gokidi, Y. (2005). Evaluation of a mini core set of germplasm in groundnut (Arachis hypogaea L.). MSc Thesis, Dharwad University of Agricultural Sciences.
- Gomez Selvaraj, M., Narayana, M., Schubert, A. M., Ayers, J. L., Baring, M. R., & Burow, M. D. (2009). Identification of QTLs for pod and kernel traits in cultivated peanut by bulked segregant analysis. Electronics Journal of Biotechnology, 12(2), 3–4. http://www.ejbiotechnology.info/content/vol12/issue2/full/13/
- Govindaraj, M. M. (2015). Vetriventhan and M. Srinivasan. Importance of genetic diversity assessment in crop plants and its recent advances: An overview of its analytical perspectives. Genetics Research International, 1–14. https://doi.org/10.1155/2015/431487
- Hair, J., Anderson, R., Tatham, R., & Black, W. (1995). Multivariate data analysis with readings (7th ed.). Prentice-Hall International.
- Hutcheson, K. (1970). A test for comparing diversities based on the Shannon formula. Journal of Theoretical Biology, 29(1), 151–154. https://doi.org/10.1016/0022-5193(70)90124-4
- IBPGR & ICRISAT. (1992). Groundnut Descriptors (p. 23). IBPGR Secretariat.
- Iezzoni, A. F., & Pritts, M. P. (1991). Applications of principal component analysis to horticultural research. HortScience, 26(4), 334–338. https://doi.org/10.21273/HORTSCI.26.4.334
- Jolliffe, I. (2002). Principal component analysis (2 ed., pp. pp. 487). Springer.
- Khan, A., Rahim, M., Khan, M. I., & Tahir, M. (2000). Genetic variability and criterion for the selection of high yielding peanut genotypes. Pakistan Journal of Agricultur Research, 16(1), 9–12. https://www.osti.gov/etdeweb/biblio/20112383
- Kiranmai, M. S., Venkataravana, P., & Pushpa, H. (2016). Correlation and path analysis studies in groundnut under different environment. Legum Research, 6(39), 1048–1058. DOI: 10.18805/lr.v0iOF.4484
- Kozak, M., & Azevedo, R. A. (2014). Sequential path analysis: What does “sequential” mean? Scientia Agricola, 71(6), 525–527. https://doi.org/10.1590/0103-9016-2014-0186
- Lenka, D., & Misra, B. (1973). Path-coefficient analysis of yield in rice varieties. Indian Journal of Agricultureal Science, 43, 376–379. https://www.scirp.org/(S(351jmbntvnsjt1aadkposzje))/reference/ReferencesPapers.aspx?ReferenceID=2427494
- Luz, L. N. D., Santos, R. C. D., & Melo Filho, P. D. A. (2011). Correlations and path analysis of peanut traits associated with the peg. Crop Breeding and Applied Biotechnology, 11(1), 88–95. https://doi.org/10.1590/S1984-70332011000100013
- Maiti, R. (2002). About the peanut crop. The Peanut, 29, 1–12. https://www.semanticscholar.org/paper/The-peanut-(Arachis-hypogaea)-crop-Mait%C3%AD-Wesche-Ebeling/b371d6d3c6b329e8b5f225ea13c7e9d7c0d1d737
- Makinde, S. C. O., & Ariyo, O. J. (2010). Multivariate analysis of genetic divergence in twenty two genotypes of groundnut (Arachis hypogaea L.). Journal of Plant Breeding Crop Science, 2(7), 192–204. http://www.academicjournals.org/jpbcs
- Mandal, G., Das, A., Dutta, D., Mondal, B., & Bijoy, K. (2017). Genetic variability and character association studies in groundnut (Arachis hypogaea L.). Scholars Journal of Agriculture and Vetinary Science, 4(10), 424–433. DOI: 10.21276/sjavs.2017.4.10.6
- Meta, H. R., & Monpara, B. A. (2010). Genetic variation and trait relationships in summer groundnut, Arachis hypogaea L. Journal of Oilseed Research, 26, 186–187. https://www.academia.edu/2977265/Genetic_variation_and_trait_relationships_in_summer_groundnut_Arachis_hypogaea_L
- Mohammadi, S., Prasanna, B., & Singh, N. (2003). Sequential path model for determining interrelationships among grain yield and related characters in maize. Crop Science, 43(5), 1690–1697. https://doi.org/10.2135/cropsci2003.1690
- Mohammed, K. E., Afutu, E., Odong, T. L., Okello, D. K., Nuwamanya, E., Grigon, O., Rubaihayo, P., & Okori, P. (2018). Assessment of groundnut (Arachis hypogaea L.) genotypes for yield and resistance to late leaf spot and rosette diseases. . Journal of Experimental Agriculture International, 21(5), 1–13. https://doi.org/10.9734/JEAI/2018/39912
- Muitia, A. (2011). Farmer perceptions and genetic studies of rosette disease in groundnut (Arachis hypogaea L.) in northern Mozambique. PhD Thesis, University of KwaZulu-Natal.
- Mukherjee, D., Roquib, M. A., Das, N. D., & Mukherjee, S. (2016). A study on genetic variability, character association and path co-efficient analysis on morphological and yield attributing characters of Taro [Colocasia esculenta (L.) Schott]. . American Journal of Plant Sciences, 7(03), 479–488. https://doi.org/10.4236/ajps.2016.73042
- Niveditha, P. D., Sudharani, M., Rajesh, A. P., & Nirmala, P. J. (2016). Genetic diversity based on cluster and principal component analysis for yield, yield components and quality traits in peanut stem necrosis tolerant groundnut (Arachis hypogaea L.) genotypes. Journal of Research ANGRAU, 44(3&4), 6–12. https://angrau.ac.in/angrau/pdf/44(3&4)%202016%20volume.pdf
- Olivoto, T., Nardino, M., Carvalho, I. R., Follmann, D. N., Ferrari, M., Szareski, V. J., de Pelegrin, A. J., & de Souza, V. Q. (2017). REML/BLUP and sequential path analysis in estimating genotypic values and interrelationships among simple maize grain yield-related traits. . Genetics and Molecular Research, 16(1), 1–10. https://doi.org/10.4238/gmr16019525
- Patil, K. G., Kenchanagoudar, P., Parameshwarappa, K., & Salimath, P. (2006). A study of correlation and path analysis in groundnut. Karnataka Journal of Agriculture Science, 19(2), 272–277. http://eprints.icrisat.ac.in/id/eprint/14368
- Paul, R. K. (2006). Multicollinearity: Causes, effects and remedies. Indian Agricultural Statistics Research Institute.
- Payne, R. (2014). A guide to ANOVA and design in Genstat (17 ed., pp. 123). VSN International.
- Pereira, J. W., Silva, E. C. A., Luz, L. N., Nogueira, R. J. M. C., Lima, L. M., & Santos, R. C. (2015). Cluster analysis to select peanut drought tolerance lines. Australian Journal of Crop Science, 9(11), 1095–1105. http://www.cropj.com/pereira_9_11_2015_1095_1105.pdf
- Rao, V. T., Venkanna, V., Bhadru, D., & Bharathi, D. (2014). Studies on variability, character association and path analysis on groundnut (Arachis hypogaea L.). International Journal of Pure Applied Bioscience, 2(2), 194–197. http://www.ijpab.com/vol2-iss2.php
- Rathod, S. S., & Toprope, V. N. (2018). Studies on variability, character association and path analysis on groundnut (Arachis hypogaea L.). International Journal of Pure & Applied Bioscience, 6(2), 1381–1388. https://doi.org/10.18782/2320-7051.5504
- Reddy, A. T., Sekhar, M. R., Vijayabharathi, A., Pathy, T. L., Reddy, G. L., & Jayalakshmi, V. (2017). Correlation and path analysis of kernel yield and its components in groundnut (Arachis hypogaea L.). International Journal of Current Microbiology and Applied Sciences, 6(12), 10–16. https://doi.org/10.20546/ijcmas.2017.612.002
- SAS Institute. (2015). Base SAS® 9.4 procedures guide: Statistical Procedures (3rd, pp. 549). https://support.sas.com/documentation/onlinedoc/base/procstat93m1.pdf
- Siddiquey, M. N. H., Haque, M. M., Ara, M. J. F., Ahmed, M. R., & Roknuzzaman, M. (2006). Correlation and path analysis of groundnut (Arachis hypogaea L.). International Journal of Sustainable Agriculture Technology, 2(7), 6–10.
- Singh, A. K., & Nigam, S. (2016). Arachis gene pools and genetic improvement in groundnut. Gene Pool Diversity and Crop Improvement, 17–75. Cham: Springer. https://doi.org/10.1007/978-3-319-27096-8_2
- Subramanian, A., & Subbaraman, N. (2010). Hierarchical cluster analysis of genetic diversity in maize germplasm. Electronics Journal of Plant Breed, 1(4), 431–436. https://sites.google.com/site/ejplantbreeding/vol-1-4
- Talawar, S. (2004). Peanut in India: History, production, and utilization. University of Georgia.
- Upadhyaya, H. D. (2003). Phenotypic diversity in groundnut (Arachis hypogaea L.) core collection assessed by morphological and agronomical evaluations. Genetic Resources and Crop Evolution, 50(5), 539–550. https://doi.org/10.1023/A:1023980713848
- Upadhyaya, H. D., Bramel, P. J., Ortiz, R., & Singh, S. (2002). Developing a mini core of peanut for utilization of genetic resources. Crop Science, 42(6), 2150–2156. https://doi.org/10.2135/cropsci2002.2150
- Van der Merwe, P., Subrahmanyam, P., Hildebrand, G., Reddy, L., Nigam, S., & Chiyembekeza, A. (2001). Registration of groundnut cultivar ICGV-SM 90704 with resistance to groundnut rosette. International Arachis News, 21, 19–20. http://oar.icrisat.org/1089/1/RA_00360.pdf
- Vange, T., & Maga, T. J. (2014). Genetic characteristics and path coefficient analysis in ten groundnut varieties (Arachis hypogaea L.) evaluated in the Guinea Savannah agro-ecological zone. African Journal of Agricultural Research, 9(25), 1932–1937. https://doi.org/10.5897/AJAR2013.7340
- Waliyar, F., Kumar, P., Ntare, B., Monyo, E., Nigam, S., & Reddy, A. (2007). A century of research on groundnut rosette disease and its management. Information Bulletin No. 75(1). https://www.researchgate.net/publication/262449769_A_Century_of_Research_on_Groundnut_Rosette_Disease_and_its_Management_Information_Bulletin_no_75file:///C:/Users/icrisat/Downloads/J354_2007GroundnutRosette_pre-printcopy%20(1).pdf
- Wright, S. (1921). Correlation and causation. Journal of Agriculture Research, 20(7), 557–585. https://pdfs.semanticscholar.org/90bd/1ea6df6cf7ff14c392818751270b93d53d4e.pdf
- Yusuf, Z., Zeleke, H., Mohammed, W., Hussein, S., & Hugo, A. (2017). Correlation and path analysis of groundnut (Arachis hypogaea L.) genotypes in Ethiopia. International Journal of Plant Breeding and Crop Science, 4(2), 197–204. https://premierpublishers.org/ijpbcs/170220179704.pdf?view-type=inline
- Zaman, M., Tuhina-Khatun, M., Ullah, M., Moniruzzamn, M., & Alam, K. (2011). Genetic variability and path analysis of groundnut (Arachis hypogaea L.). The Agriculturists, 9(1–2), 29–36. https://doi.org/10.3329/agric.v9i1–2.9476
- Zhang, L., Yang, X., Tian, L., Chen, L., & Yu, W. (2016). Identification of peanut (Arachis hypogaea) chromosomes using a fluorescence in situ hybridization system reveals multiple hybridization events during tetraploid peanut formation. New Phytologist, 211(4), 1424–1439. https://doi.org/10.1111/nph.13999