
 ?Mathematical formulae have been encoded as MathML and are displayed in this HTML version using MathJax in order to improve their display. Uncheck the box to turn MathJax off. This feature requires Javascript. Click on a formula to zoom.
Abstract
A D-optimal mixture design was used to study the effects of blending ratio of wheat, sprouted mungbean, and maize flour on functional properties of composite flour and physico-chemical properties and sensory attributes of composite bread. A total of 13 formulations were generated using Design Expert software. The functional properties of the composite flour were significantly (p < 0.05) influenced by the blend proportion. The bulk density (BD) increased with increase in mungbean flour content and decreased with increase in wheat flour content. The loaf volume, specific volume, and loaf height increased with decrease in mungbean flour proportion. The sensory attributes were significantly (p < 0.05) affected by blend proportions. Increase in mungbean flour resulted in decreased sensory scores. Graphical optimization revealed that the best results were found between 76 and 87% of wheat, 8 and 15% maize, and 4 and 10% mungben flour. Using the criteria of maximizing all the sensory attributes, protein, volume, specific volume loaf height and minimizing BD and weight, numerical optimization revealed that best results were obtained at 10% mungbean flour, 15% maize flour, and 75% wheat flour with a desirability value of 0.515.
Keywords:
PUBLIC INTEREST STATEMENT
Besides their nutritional values, mungbeans have been reported to have huge health benefit and bioactive potential uses in foods. The enriching of wheat flour with mungbean flour would greatly improve the protein content and health benefit of bread. Despite the nutrition and health-related benefits of mungbean, there are limited reports on the level of inclusion and optimization of the proportions for an acceptable product. In order to make bread affordable by low-income earners, there is a need to use cheaper sources of food crops such as maize to partially replace wheat, which will hence contribute to lowering the cost. The study revealed that it is possible to blend wheat, maize, and sprouted mungbean flour to come up with an acceptable bread.
1. Introduction
Legumes including mungbeans are important crops because of their nutritional quality. They occupy an important place in human nutrition, especially in the dietary pattern of low-income groups of people in developing countries being cheap source of protein (Tharanathan & Mahadevamma, Citation2003; Yi-Shen et al., Citation2018). Mungbean seeds contain about 20.97–31.32% protein which is about two-fold higher than in cereals and is also reported to be a good source of minerals (Anwar et al., Citation2007; Shah et al., Citation2011; Yi-Shen et al., Citation2018). Due to their good balance of amino acid, high protein bioavailability, and relatively low levels of anti-nutritional factors, mungbean seeds have been considered a suitable source of dietary proteins.
Besides their nutritional values, mungbeans have been reported to have huge health benefits and bioactive potential uses in foods. Studies revealed that mungbean is a good source of essential fatty acids, minerals, and tocopherols and possesses a good antioxidant activity (Anwar et al., Citation2013, Citation2007; Wongsiri et al., Citation2015; Yeap et al., Citation2014; Yi-Shen et al., Citation2018). The mungbean protein hydrolysates can be useful as substitutes in hypoallergenic food formulations and population groups with specific nutritional requirements (Budseekoad et al., Citation2018). In vivo and in vitro studies also revealed that germinated mungbean extracts exhibited potential anti-inflammatory and anti-nociceptive and anti-stress effects (Ali et al., Citation2014; Yeap et al., Citation2014).
Germination/sprouting is an inexpensive and simple method of improving nutritive value. During germination of mungbeans, crude protein was found to increase due to an increase in non-protein nitrogen. Germination led to an increase in certain amino acids, especially phenylalanine and increase in antioxidative activities (Akaerue & Onwuka, Citation2010; Sangsukiam & Duangmal, Citation2017; Wongsiri et al., Citation2015). Studies also indicated that sprouting mungbeans resulted in increase in calcium, phosphorus and certain vitamins, reduced phytic acid, improved protein and ascorbic acid content and improved anti-oxidant activity (Shah et al., Citation2011; Wongsiri et al., Citation2015). Mungbeans have been used in the production of cookie, pasta, bread, cakes, and cooked vegetables and meat (Anwar et al., Citation2007; Bojňanská et al., Citation2012; Jyotsna et al., Citation2014; Tulse et al., Citation2014).
In order to make bread affordable by low-income earners, there is a need to use cheaper sources of food crops such as maize to partially replace wheat, which will hence contribute to lowering the cost of bread (Menon et al., Citation2015). The enriching of wheat flour with mungbean flour would greatly improve the protein content and health benefit of bread. Despite the nutrition and health-related benefits of mungbean, there are limited reports on the level of inclusion and optimization of the proportions for an acceptable product (Menon et al., Citation2015). The objectives of the study were to formulate wheat bread by partial substitution with sprouted mung bean flour and maize flour as a composite flour blend, to evaluate the effect of blending ratios on the physiochemical properties and on consumer acceptability and, to optimize the blend proportion that gives best results in terms of physico-chemical properties and sensory attributes.
2. Materials and methods
2.1. Raw materials
Three raw materials were used in this study included mung bean (Vigna radiata L.) flour, maize flour, and wheat flour. The wheat flour and maize flour, milled in commercial milling plant, were sourced from supermarket. The wheat flour was used as a base material for the preparation of composite flours. Additional ingredients included sugar, leavening agent, shortening, and salt which were also purchased from the local supermarket.
2.2. Processing method of mungbean flour
A pre-weighed quantity of sample was soaked in distilled water for 12 h at room temperature (~25 °C) and allowed to sprout in the dark for 36 h. The seeds were moistened with distilled water every 12 h throughout thegermination period. The sprouted mungbeans were dried at 65 °C for 9 h in convective air-oven (Labotec Eco Therm, South Africa) followed by cooling to ambient temperature. The dry seeds were then pulverized and passed through No. 30 mesh standard sieve. The flour was then stored in air-tight polyethylene (PE) bags until further analysis (Akaerue & Onwuka, Citation2010; Menon et al., Citation2015)
2.3. Determination of water absorption capacity
Water absorption capacity (WAC) of sample was determined using the method outlined by Diniz and Martin (Citation1997) with some modifications. About 0.5 g of the sample was dissolved in 10 ml of distilled water in centrifuge tubes and vortexed for 30 s. The dispersions were allowed to stand at room temperature for 30 min and centrifuged at 3000 rpm for 25 min. The supernatant was then filtered with Whatman No. 1 filter paper and the volume retrieved was accurately measured. The difference between initial volumes of distilled water added to the sample and the volume obtained after filtration was determined. The results were reported as mL of water absorbed per gram of sample.
2.4. Determination of swelling index
The swelling index (SI) of the samples was determined by putting 25 g of sample in a 210 ml measuring cylinder and 150 ml distilled water was added and allowed to stand for 4 h before observing the level of swelling. The swelling index was then calculated as follows (Ukpabi and n.d.imele (Citation1990):
2.5. Determination of oil absorption capacity
Oil absorption capacity (OAC) was determined using the method of AOAC (Citation2005). About 1 g of the sample (W0) was weighed into pre-weighed 15 ml centrifuge tubes and thoroughly mixed with 10 ml (V1) of refined palm oil using vortex mixer. Samples were allowed to stand for 30 min. The sample-oil mixture was centrifuged at 3000 rpm for 20 min. Immediately after centrifugation, the supernatant was carefully poured into a 10 ml graduated cylinder, and the volume recorded (V2). Oil absorption capacity (millilitre of oil per gram of sample) was calculated as:
2.6. Production of bread by the straight dough method
The straight dough method was used to produce the bread samples. This method involves the addition of all the ingredients (flour, salt, water, sugar, yeast, fats) at mixing stage and kneading to obtain the dough. The different dough samples were placed in baking tins and covered for the dough to ferment resulting in gas production and gluten development for about 30–40 min. The dough was then kneaded again and then baked in the oven at 180°C for 30 min(Chauhan et al., Citation1992). The baked loaves were carefully removed from the pans and allowed to cool and packaged in for analysis.
2.7. Evaluation of bread characteristics
2.7.1. Loaf volume and weight
The loaf volume of each bread sample was measured 50 min after the loaves are removed from the oven by using the rape-seed displacement method as described by Onwuka (Citation2005). Mungbean seeds were used in place of rape-seed. The loaf weight for each of the bread samples was determined by weighing directly on a weighing balance.
2.7.2. Specific loaf volume
The specific loaf volume for each sample was determined by dividing the loaf volume of each sample with the corresponding loaf weight thus;
2.7.3. Proximate composition of bread
The moisture content (MC) was determined by oven drying method. The ash content was determined by using the muffle furnace (Labcon laboratory equipment (pty) Ltd L-1200, South Africa). The fat content was determined by Soxhlet extraction method (AOAC, Citation2005). The protein content was determined using the Kjeldahl method.
2.8. Sensory evaluation
A panel of 50 panellists were selected randomly from the University of Eswatini, Luyengo campus to evaluate the product as general consumers. Each panellist was given coded samples to evaluate. A nine-point hedonic scale (1 dislike extremely and 9 Like extremely) was used to assess the appearance, color, flavor, texture, and taste of the samples.
2.9. Experimental Design and Data Analysis
A D-optimal mixture design was used to investigate the effect of blending ratios on the physico-chemical characteristics and sensory attributes of the bread produced by blending the three flours. The proportions were constrained in such a way that the mungbean flour ranged from 0 to 30%, the maize flour 0 to 15% and wheat from 60 to 100% based on literature. A total of 13 runs (formulations) were generated using Design-Expert Stat ease version 7.0 (). Quadratic and special cubic models shown below were fitted to the data and the adequacy of the model was checked by the values of R2 and adjusted-R2.
Where:
Y = the predicted variable
x1,2,3 = the proportion of the three flours in the mixture
β’s = the coefficients of the linear, quadratic, and cubic terms of the model
2.10. Optimization
Graphical optimization was used to determine the optimal combination of the mix proportions. The contour plots of different attributes were super imposed to come up with an overlay plot. The overlay plot was employed to find the optimal region based on the optimization criteria. The desirability function (Montgomery, Citation2001) was used to numerically optimize the blend proportions. For x attributes, the overall desirability D based on the desirability value (di) of each attribute is given by:
3. Results and discussion
3.1. Functional properties of composite flour blends
3.1.1. Water absorption capacity (WAC)
Blend proportion significantly (p < 0.05) affected the WAC. The WAC increased with increase in the proportion of mungbean and wheat flour whereas increase in maize flour decreased the WAC. However, further increase to wards 100% in wheat proportion exhibited a decrease in WAC (Figure )). An increase in WAC with increase in mungbean flower might be attributed to the fact that germination increased WAC. An increase in sugar content and breakdown of polysaccharide molecules due to germination increase the sites for interaction with water which in turn increases water-holding capacity (Moongngarm et al., Citation2014). The water absorption capacity of mungbean flower was reported to be 1.22 ± 0.04 g/g (Du et al., Citation2014) whereas for sprouted mungbean flour the WAC in this study was 3.27 g/g. Protein content of Mungbean flour may also have played some role in increasing the WAC (Kaur & Singh, Citation2005)
Figure 1. Ternary plots of Water absorption capacity (a) Oil absorption capacity (b) bulk density (c) and swelling index (d).
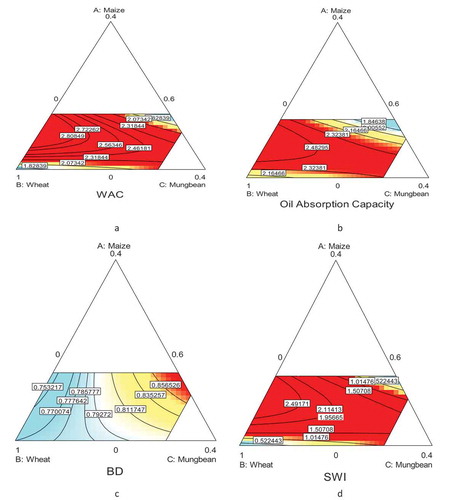
3.1.2. Oil absorption capacity (OIAC)
The OIAC of 100% mungbean and 100% wheat flour were found to be 1.95 ± 0.33 and 2.08 ± 0.23, respectively. The OIAC for mungbean was reported to be 1.05 ± 0.06 (Du et al., Citation2014) and of wheat was reported to be 2.47 ± 0.03 (Menon et al., Citation2015). The results indicated that OIAC in general increased with increase in wheat and mungbean flour content followed by a decrease. Increase in maize flour content showed a slight decrease in OIAC (Figure )). Low OIAC might be attributed to the presence of high-protein constituents and hydrophilic nature of such flours (Menon et al., Citation2015). The OIAC of flour is very important for improving the mouth texture and maintaining the flavor of food products (Du et al., Citation2014; Kaur & Singh, Citation2005; Kraithong et al., Citation2018). Thus, bread with high proportion of wheat flour would have better texture and flavor as indicated by the sensory evaluation results. The oil-absorbing mechanism involves capillarity interaction, which allows the absorbed oil to be retained. Hydrophobic proteins play the main role in oil absorption.
3.1.3. Bulk density (BD)
The bulk density of the composite flour was significantly (p < 0.05) affected by the blend proportion. The bulk density of 100% wheat flour and 100% mungbean was found to be 0.77 ± 0.01 and 1.00 ± 0.01, respectively. The BD of wheat flour was reported to be 0.9259 g/mL and of wheat, sprouted mungbean, soy flour and mango kernel composite flour ranged from 0.936 ± 0.0006 to 0.9558 ± 0.0005 g/mL (Menon et al., Citation2015). BD increased with increase in mungbean flour content and decreased with increase in wheat flour content (Figure )). The BD of mungbean flour was reported to be 0.798 ± 0.01 g/mL and for different legumes vary from 0.536 g/mL to 0.816 g/mL (Du et al., Citation2014; Kaur & Singh, Citation2005) indicating that the BD of mungbean is to the higher side. However, the results in this study are comparable with those reported in literature. The increase in BD with mungbean could be attributed to the presence of more crude fiber in the composite flour (Menon et al., Citation2015).
3.1.4. Swelling index
The swelling index was significantly (p < 0.05) affected by the blend proportions. The swelling index ranged from 0.24 ± 0.11to 1.04 ± 0.00 mL/g. Swelling index increased with increase in mungbean flour followed by a decrease with further increase in mungbean flour content (Figure )). Similar trend was reported by Menon et al. (Citation2015) where increase in proportion of soy flour and mungbean flour resulted in reduction of swelling index. The phenomenon was attributed to inhibition of starch gelatinization. The high protein results in formation of a starch protein complex resulting in reduction of swelling power. Decrease in Swelling power could laso result in loaf volume and loaf eight (Menon et al., Citation2015).
3.2. Physicochemical properties of breads
3.2.1. Loaf weight
The loaf weight values of the different treatments ranged between 900.5 ± 5 g to 1002 ± 1.41 g and the blend proportions brought a significant (p < 0.05) effect in the loaf weight. The trends in the changes of loaf weight in relation to the blend proportions are presented by the ternary mixture plot (Figure )). Weight increased with increase in the proportion of mungbean till about 20% followed by a decrease. Similar trend was observed for changes in loaf weight with respect to the proportion of maize flour. Weight also increased with a decrease in the proportion of wheat flour. The relationship between the blend proportions and the loaf weight was adequately described by a quadratic model (R2 = 0.995 and = 0.920) (Table ). The linear, and binary (maize-mungbean and wheat-mungbean flour) mixture blends affected the weight significantly (p < 0.05). Maize and wheat flour affected weight positively whereas the mungbean flour affected in a negative way resulting in heavier or denser bread. All the binary blends were antagonistic as indicated by the positive coefficients, for a minimized target response (Table ). The reduction of refined wheat flour content and incorporation of high starch maize flour and sprouted mungbean flour contributed to the bulkiness of the flour resulting in high loaf weight of the bread. Increasing the amount of non-gluten flours resulted to high gross weight of bread Menon et al., (Citation2015).
Figure 2. Ternary plots of weight (a) loaf height (b) volume (c) and specific volume (d).
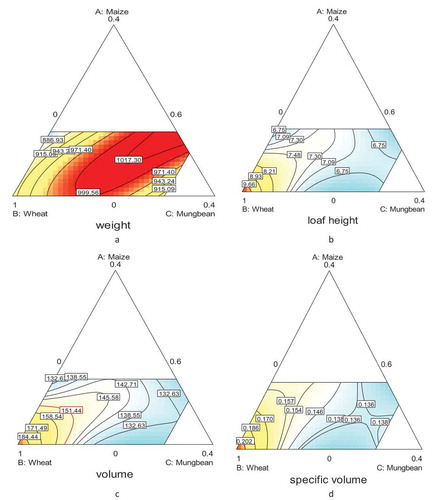
Table 1. Model coefficients and degree of fit for the different quality attributes
3.2.2. Loaf height
The loaf height values ranged from 10.80 ± 1.13 cm for the control to 6.13 ± 0.04 cm for 80:20% (wheat:mungbean flour). The blend proportions significantly (p < 0.05) affected the loaf height. The changes in the loaf height as a function of blend proportion is presented in the ternary plot (Figure )). Increase in the proportion of wheat and maize flour resulted in an increase in the loaf height whereas increase in the proportion of mungbean affected the loaf height negatively.
The control and the formulations with higher proportion of wheat or lower proportion of mungbean had higher loaf height. This could be attributed to the maximum formation of gluten which might lead to the retention of more CO2 gas resulting in higher loaf height. The results revealed that the increased proportion of mungbean and maize in the composite flour generally affected the shape and height of breads resulting in more flat bread. This is in agreement with previous findings due incorporation of breadfruit, breadnut, lentil, and chickpea in the preparation of composite flour bread (Malomo, et al., Citation2012; Bojňanská et al., Citation2012). The relationship between the blend proportions of the different flours and the loaf weight was adequately described by a special cubic model (R2 = 0.99 and = 0.97) with a non-significant lack of fit (Table ). The linear, binary (maize-mungbean and wheat-mungbean) and the ternary mixture blends affected the loaf height significantly (p < 0.05). The maize-wheat and maize-mungbean blends were antagonistic whereas the wheat-mungbean and the ternary blend coefficients were synergetic for a maximized response of loaf height as indicated by the signs of the coefficients.
3.2.3. Loaf volume
The values of the loaf volume for the different formulations ranged from 183.22 ± 84.46 cm3 (for the control) to 121.6 ± 2.69 cm3 (for the formulation with 30% mungbean flour). The results indicate that blend proportions significantly (p < 0.05) affected the loaf volume. The trend of changes in the loaf volume as affected by the blending proportions is presented by the ternary plot (Figure )). Increase in the proportion of wheat resulted in increased loaf volume whereas increase in the proportion of maize and mungbean flour resulted in decreased loaf volume. Similar results were reported where lower volumes were associated with higher proportion of legume in wheat-legume composite flour in baked products which resulted in lower gluten content (Fenn et al., Citation2010; Noorfarahzilah et al., Citation2014). Reduction in the wheat structure forming proteins and a lower ability of the dough to enclose air during proofing might have a volume depressing effect on bread (Akobundu et al., Citation1988; Bojňanská et al., Citation2012). A special cubic model adequately described (R2 = 0.95 and = 0.90) the relationship between the loaf volume and blend proportions with a non-significant (p > 0.05) lack of fit (Table ). The linear, the binary (wheat-mungbean) and ternary blends significantly affected the loaf volume. The entire binary blend was antagonistic and affected the volume negatively for a maximized response of loaf volume.
3.2.4. Specific volume
The specific volume, which is the ratio of loaf volume to loaf weight, has been generally adopted as a more reliable measure of loaf size. The specific volume of the control had the highest mean score. The blend proportion significantly (p < 0.05) affected the specific volume. Increase in the proportion of the mungbean flour resulted in a decrease in the specific volume as indicated by the ternary plot (Figure )). Similar trends have been reported with increase in soy and chickpea protein in baked products (Fenn et al., Citation2010). Lower specific volume could be attributed lack of protein gluten in the composite flour that is responsible for the enhanced dough rise in leavened wheat bread (Ukpabi, Citation2010).
3.3. Proximate Composition of Breads
3.3.1. Crude protein content
The protein content ranged from 10.03 ± 0.01 (15% maize flour: 85% wheat) to 18.67 ± 0.04 (70% wheat: 30% mungbean) where the blending ratio significantly (p < 0.05) affected the protein content. The changes in the protein content in relation to the blend proportions is presented in the ternary plot (Figure )). Increase in the proportion of mungbean flour resulted in a significant increase in protein content whereas increase in maize flour decreased the protein content. This increase in protein content in composite flour breads could be attributed to higher protein content of sprouted mungbean that were incorporated in composite flour formulation (Mubarak, Citation2005). The relationship between the protein content and blend proportions was adequately described by a quadratic model (R2 = 0.84 and = 0.72) (Table ). The linear blends significantly affected the protein content. The binary (wheat-mungbean flour) blend was synergetic and affected the volume positively for a maximized response of protein content whereas the two binary blends (wheat-maize flour and maize-mungbean flour) were antagonistic as indicated by the negative signs of the blend coefficients for a maximum target of protein content (Table ).
Figure 3. Ternary plots of protein (a) Fat(b) Ash (c) and Moisture (d).
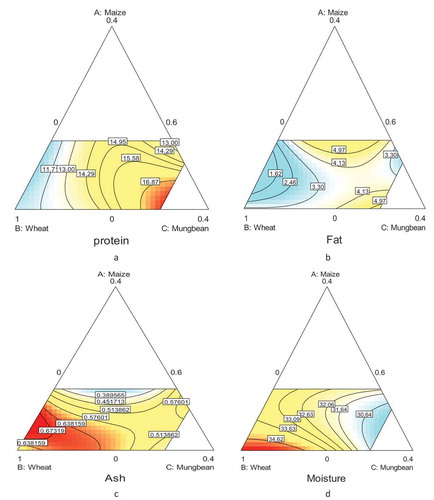
3.4. Crude fat content
The crude fat content was significantly affected by the blend proportions (p< 0.05) where the values ranged from 2.56 ± 0.04 (15% maize: 85% wheat: 0% mungbean flour) to 6.90 ± 0.14 (15% maize: 70% wheat: 15% mungbean flour). The changes in the crude fat content in relation to the proportions are presented in the ternary plot (Figure )). Increase in the proportion of mungbean and maize flour in general resulted in a significant increase in crude fat content whereas increase in wheat flour decreased the crude fat content. A quadratic model adequately described (R2 = 0.89 and = 0.77) the relationship between the crude fat content and blend proportions. The linear blends did not affect significantly (p > 0.05) the crude content. The binary maize-wheat and maize-mungbean flour) blends were synergetic and affected the crude fat positively for a minimized response of crude fat content whereas the maize-mungbean flour binary blend did not significantly (P > 0.05) affect the crude fat content (Table ).
3.4.1. Total ash
The ash content was significantly (p < 0.05) affected by the blend proportions where the maximum value was 0.69 ± 0.01 (10% maize: 60% wheat: 30% mungbean flour blend and the minimum was 0.30 ± 0.08 (15% maize: 70% wheat: 15% mungbean flour) blend. The changes in the as content as influenced by the blend proportions is presented in the ternary plot (Figure )). An increase in the proportion of wheat and mungbean flour in resulted in a significant increase in total ash content whereas increase in maize flour decreased the ash content. The values reported in this study are comparable with those in literature. Moreover, such trend of increases in ash content with increase in legumes for composite flour is reported (Bojňanská et al., Citation2012). A special cubic model described (R2 = 0.88 and = 0.76) the relationship between the crude fat content and blend proportions with a non-significant lack of fit (Table ). The linear blends did not affect significantly (p > 0.05) the ash content. The binary (maize-wheat and maize-mungbean flour) and the ternary (maize-wheat-mungbean flour blends were synergetic and affected the ash content positively for a maximized response of ash content (Table ).
3.4.2. Moisture content
Blend proportions significantly (p < 0.05) influenced the moisture content where the maximum (35.77 ± 0.25%) was for the control (100% wheat) and the minimum (29.87 ± 0.09%) was for the blend with 10% maize flour, 60% wheat, and 30% mungbean flour. Moisture content increased with increase in wheat flour content whereas the moisture content decreased with increase in maize and mungbean flour content. This trend is presented in the ternary mixture plot (Figure )). A quadratic model adequately described (R2 = 0.93 and = 0.88) the relationship between the moisture content and blend proportions where only the linear blends affected the moisture content significantly (p < 0.05) (Table ).
3.5. Sensory attributes
3.5.1. Appearance
The results indicated that there was a significant (p < 0.05) difference in the appearance score due to formulation. The maximum score was 7.06 ± 1.06 (like moderately) for the control (100% wheat) whereas the minimum was 3.70 ± 1.07 (dislike slightly) for the formulation with 70% wheat and 30 Mungbean flour. The ternary mixture plot (Figure )) indicated that the appearance score increased with an increase in wheat and maize flour content whereas an increase in the mungbean flour decreased the score. A decrease in appearance score with an increase in the proportion of sprouted mungbean, mango kernel and soy flour of the bread made with composite flour was reported in earlier study (Menon et al., Citation2015). Similar trend has been reported for sensory attributes of bread from other legumes (Bojňanská et al., Citation2012). The relationship between appearance and blend proportion was adequately (R2 = 0.97 and = 0.95) described by a quadratic model with a non-significant lack of fit (Table ). The linear blend coefficients significantly (p < 0.05) affected the score where maize flour being dominant as evident from the magnitude of the coefficient. The maize-wheat binary blend was antagonistic whereas the maize-mungbean and wheat-mungbean flour binary blend were synergetic for a maximized target of appearance score (Table ).
Figure 4. Ternary plots of appearance (a) Color (b) Flavor (c) and Texture (d).
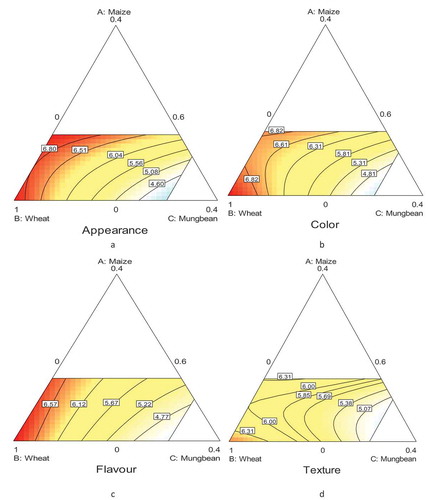
3.5.2. Color
The result indicated that there was a significant (p < 0.05) difference in the appearance score due to blend proportions. The maximum score was 7.38 ± 0.99 (like moderately) for the control (100% wheat) whereas the minimum was 3.62 ± 1.07 (dislike slightly) for the formulation with 70% wheat and 30% Mungbean flour. These trends are similar to the attribute appearance. The ternary mixture plot (Figure )) indicated that the appearance score increased with an increase in wheat and maize flour content whereas an increase in the mungbean flour decreased the score. The relationship between color and blend proportion was adequately (R2 = 0.94 and = 0.90) described by a quadratic model with a non-significant lack of fit (Table ). The linear blend coefficients significantly (<0.05) affected the score where maize flour being dominant as evident from the magnitude of the coefficient (Table ). The maize-wheat binary blend was antagonistic whereas the maize-mungbean and wheat-mungbean flour binary blend were synergetic for a maximized target of color score as indicated by the signs of the coefficients (Table ).
3.5.3. Flavor
The maximum score was 7.06 ± 0.91 (like moderately) for the control (100% wheat) whereas the minimum was 3.50 ± 1.45 (dislike slightly) for the formulation with 70% wheat and 30% Mungbean flour. The results indicated that there was significant (p < 0.05) difference in the flavor score due to the blending proportions. The ternary mixture plot (Figure )) indicated that the appearance score increased with increase in wheat and maize flour content whereas an increase in the mungbean flour decreased the score. This might be attributed to the light greenish color of mungbean flour. The relationship between flavor and blend proportion was described by a quadratic model (R2 = 0.88 and = 0.77) with a non-significant lack of fit (Table ). The linear blend coefficients significantly (p < 0.05) affected the score where maize and wheat flour being dominant as evident from the magnitude of the coefficients. The maize-wheat and wheat-mungbean binary blends were antagonistic whereas maize-mungbean binary blends were synergetic for a maximum target of flavor score (Table ).
3.5.4. Texture
The results indicated that there was significant difference (p < 0.05) in the flavor score due to the blending proportions. The ternary mixture plot (Figure )) indicates that the appearance score increased with an increase in wheat and maize flour content whereas increase in the mungbean flour decreased the score. The maximum score was 7.08 ± 0.60 (like moderately) for the control (100% wheat) whereas the minimum was 4.12 ± 1.41 (dislike slightly) for the formulation with 70% wheat and 30% Mungbean flour. The addition of the maize four and mungbean flour resulted in a dense, hard crumb texture of the bread which then caused stiffness of the bread (Menon et.al., 2014). The relationship between flavor and blend proportion was described by a quadratic model (R2 = 0.65 and = 0.40) with a non-significant lack of fit (Table ). The linear blend coefficients significantly (p < 0.05) affected the score where maize followed by wheat flour affected texture positively whereas mungbean flour affected the texture adversely as evident from the magnitude of the coefficients. The maize-wheat and maize-mungbean binary blends were antagonistic whereas wheat-mungbean binary blends were synergetic for a maximum target of texture score.
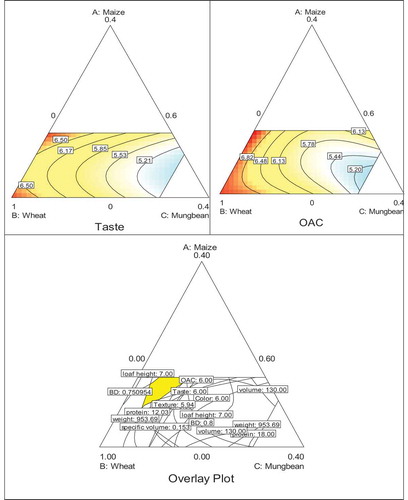
3.5.5. Taste
.The maximum score was 7.06 ± 1.38 (like moderately) for the sample with 15% maize and 85% wheat flour which was not significantly (p > 0.05) different from the control whereas the minimum was 4.62 ± 1.10 (neither like nor dislike) for the formulation with 70% wheat and 30% Mungbean flour. The results indicated that there was significant difference (p < 0.05) in the flavor score due to the blending proportions. The ternary mixture plot (Figure )) showed that the appearance score increased with an increase in wheat flour content whereas an increase in the mungbean flour decreased the score which might be attributed to legume taste in the bread as reported by Menon et al., (2014) who evaluated the effects of utilizing legume flours in the development of composite flour bread. The relationship between flavor and blend proportion was described by a quadratic model (R2 = 0.81 and = 0.60) with a non-significant lack of fit (Table ). The linear blend coefficients significantly (p < 0.05) affected the score where maize flour being dominant in positively affecting the taste and mungbean affecting negatively as evident from the magnitude of the coefficients. The maize-wheat binary blend and the ternary blends were antagonistic whereas maize-mungbean and wheat-mungbean binary blends were synergetic for a maximum target of taste score.
Figure 5. Ternary plots of Taste (a) Overall Acceptability (b) and overlay plot (c).
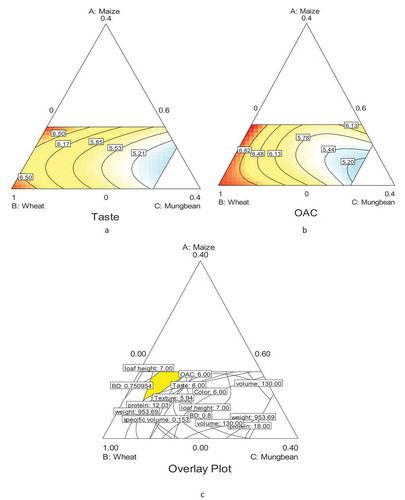
3.5.6. Overall acceptability
The results of the overall acceptability score revealed that the blend proportions significantly influence (p < 0.05) the acceptability score where the maximum score was 7.20 ± 0.70 (like moderately) for the control and the minimum score was 4.92 ± 0.97 (neither like nor dislike) for the sample with 70% wheat and 30% mungbean flour blend. The overall acceptability increased with an increase in the proportion of wheat flour and decreased with an increased proportion of the mungbean flour as indicated in the ternary plot (Figure )). The trend exhibited in the overall acceptability was consistent with the trend for the other sensory attributes. The relationship between OAC and blend proportion was described by a quadratic model (R2 = 0.94 and = 0.88) with a non-significant lack of fit (Table ). The linear blend coefficients significantly affected the score where maize and wheat flour affected the overall acceptability in a positive way whereas mungbean affected adversely as indicated by the positive and negative signs of the coefficients, respectively. The maize-wheat binary blends were antagonistic whereas maize-mungbean and wheat-mungbean binary blends were synergetic for a maximum target of OAC score.
3.6. Correlation of quality attributes
The correlation between the different attributes and the level of significance of their association is presented in Table . All the sensory attributes are significantly (p < 0.01) associated with each other. Protein content is strongly (p < 0.01) negatively associated with many of the sensory attributes. This is expected because high-protein content is associated with high density which resulted in dense product with reduced pore space and harder loaf. It also affects the appearance. The loaf height and volume are strongly positively associated with the sensory attributes. Large volume and loaf height are required attributes as they influence the texture and mouth feel of bread. Loaf height, specific volume, and volume are strongly negatively associated with protein indicating the negative influence of mungbean flour incorporation. Oil absorption capacity has no strong association with the sensory and physical properties of bread. However, water absorption capacity exhibited a strong (p < 0.01) negative association with the sensory and physical properties of bread. Water absorption is positively associated with the protein content which in turn affected the volume, specific volume, and loaf height negatively.
Table 2. Correlation between variables
3.7. Optimization
3.7.1. Graphical optimization
The region for optimal blend proportion was obtained by superimposing the response surfaces of the sensory attributes and physicochemical properties contour plots. The optimum region is depicted in the shaded region of Figure ). The criteria for the optimal region were sensory attributes greater or equal to the “like slightly” intensity, maximized specific volume, loaf height, and protein. The graphical optimization revealed that the best results were found between 76 and 87% of wheat, 8 and 15% maize, and 4 and 10% mungbean flour.
3.7.2. Numerical optimization
Using the criteria of maximizing all the sensory attributes, protein, volume, specific volume loaf height and minimize BD and weight, best results were 10% mungbean, 15% maize flour, and 75% wheat flour with a desirability value of 0.515.
4. Conclusion
Blend proportions significantly (<0.05) affected the functional properties of the composite flour. The sensory scores of the composite flour bread decreased with an increase in the proportion of mungbean flour. Specific volume and loaf height decreased significantly (<0.05) with an increase in mungbean flour. The graphical optimization revealed that the best results were found between 76 and 87% of wheat, 8 and 15% maize, and 4 and 10% mungbean flour. Using the criteria of maximizing all the sensory attributes, protein, volume, specific volume loaf height, and minimize BD and weight, numerical optimization revealed that best results were obtained at 10% mungbean, 15% maize flour, and 75% wheat flour with a desirability value of 0.515.
Additional information
Funding
Notes on contributors
Nkosephayo T. Manyatsi
Nkosephayo T. Manyatsi is a graduate in Food Science Nutrition and Technology and current working for Coca Cola Swaziland (CONCO LTD).
W. K. Solomon
W. K. Solomon is a lecturer in the Department of Food and Nutrition Sciences with Food chemistry specialization. His research area includes Food process modeling and optimization, rheological properties of food materials, product development and value addition to traditional/indigenous products.
J.S. Shelembe
J.S. Shelembe is a member of the Department of Food and Nutrition Sciences Under the Faculty of Consumer Sciences, University of Eswatini. His main research interest are food antioxidants, anti nutritional factors and poly saccharides.
References
- Akaerue, I. B., & Onwuka, I. G. (2010). Effect of processing on the proximate composition of the dehulled and undehulled mungbean [vigna radiata (l.) wilczek] flours. Pakistan Journal of Nutrition, 9(10), 1006–19. DOI: 10.3923/pjn.2010.1006.1016
- Akobundu, E. N. T., Ubbaonu, C. N., & Ndupuh, C. E. (1988). Studies on the baking potentials on non-wheat composite flours. Journal Food Science Technology, 41, 211–214.
- Ali, N. M., Yusof, H. M., Yeap, S. K., Ho, W. Y., Beh, B. K., Long, K., Koh, S. P., Abdullah, M. P., & Alitheen, N. B. (2014). Anti-inflammatory and antinociceptive activities of untreated, germinated, and fermented mungbean aqueous extract. Evidence-Based Complementary and Alternative Medicine, 2014, 1–6. https://doi.org/10.1155/2014/350507
- Anwar, F., Iqbal, Z., Sultana, B., Iqbal, S., & Saari, N. (2013). Effects of Extraction System on antioxidant attributes of mungbean [Vigna radiata (L.) Wilczek]. International Journal of Food Properties, 16(3), 527–535. https://doi.org/10.1080/10942912.2011.557797
- Anwar, F., Latifs, P. R., Sultana, B., & Ashraf, M. (2007). Chemical composition and antioxidant activity of seeds of different cultivars of mungbean. Journal of Food Science, 72(7), S503–S503. https://doi.org/10.1111/j.1750-3841.2007.00462.x
- AOAC. (2005). Official methods of analysis (18th ed.). Association of Analytical Chemist.
- Bojňanská, T., Frančáková, H., Líšková, M., & Tokár, M. (2012). Legumes – The alternative raw materials for bread production. Journal of Microbiology, Biotechnology and Food Sciences, 876–886.
- Budseekoad, S., Yupanqui, C.T., Alshi, A.M., Aluko, R.E., & Youravong, W. (2018). Anti–allergic activity of mung bean (Vigna radiata (L.) Wilczek) protein hydrolysates produced by enzymatic hydrolysis using non–gastrointestinal and gastrointestinal enzymes. Journal of Food Biochemistry, 43(1), 1–15. https://doi.org/10.1111/jfbc.12674.
- Chauhan, G. Z., Zillman, R.R., & Eskin, N. (1992). Dough mixing and bread making properties of Quinion-wheat flour blends. Journal of Food Science, 101–105. https://doi.org/10.1111/j.1365-2621.1992.tb01241.x
- Diniz, A. M., & Martin, A. M. (1997). Optimization of Nitrogen recovery in the enzymatic hydrolysis of dogfish (Squalus acanthias) protein. Composition of the hydrolysates. International Journal of Food Science Nutrition, 48(3), 191–200. https://doi.org/10.3109/09637489709012592
- Du, S. K., Jing, H., Yu, X., & Jane, J. I. (2014). Physicochemical and functional properties of whle legume flour. LWT Food Science and Technology, 55(1), 308–313.DOI: 10.1016/j.lwt.2013.06.001
- Fenn, D., Lukow, O. M., Humphreys, G., Fields, P. G., & Boye, J. I. (2010). Wheat legume composite flour quality. International Journal of Food Properties, 13(2), 381–393. https://doi.org/10.1080/10942910802571729
- Jyotsna, R., Sakhare, S. D., Inamdar, A. A., & Rao, G. V. (2014). Effect of Green Gram Semolina (P haseolus aureus) on the rheology, nutrition, microstructure and quality characteristics of high-protein pasta. Journal of Food Processing and Preservation, 38(4), 1965–1972. https://doi.org/10.1111/jfpp.12172
- Kaur, M., & Singh, N. (2005). Studies on functional, thermal and pasting properties of flour from different chickpeas (Cicer arietinum L) cultivars. Food Chemistry, 91(3), 403–411. https://doi.org/10.1016/j.foodchem.2004.06.015
- Kraithong, S., Lee, S., & Rawdkuen, S. (2018). Physicochemical and functional properties of Thai organic rice flour. Journal of Cereal Science, 79, 259–266. https://doi.org/10.1016/j.jcs.2017.10.015
- Malomo, O., Ogunmoyela, O., A., B., Adekoyeni, O., O., Jimoh, O., Oluwajoba, S., O., & Sobanwa, M., O. (2012). Rheological and functional properties of Soy-Poundo Yam flour. International Journal of Food Science Nutrition, 2(6), 101–107. DOI: 10.5923/j.food.20120206.01
- Menon, L., Majumda, R. S. D., & Ravi, U. (2015). Development and analysis of composite flour bread. Journal of Food Science Technology, 52(7), 4156–4165. https://doi.org/10.1007/s13197-014-1466-8
- Montgomery, D. C. (2001). Design and analysis of experiments (5th ed.). John and Wiley and Sons Inc..
- Moongngarm, A., Moontree, T., Deedpinrum, P., & Padtong, K. (2014). Functional properties of brown rice flour as affected by germination. APCBEE Procedia, 8, 41–46. https://doi.org/10.1016/j.apcbee.2014.01.077
- Mubarak, A. E. (2005). Nutritional composition anti nutritional factors of mung bean seeds (Phaseolus aureus) as affected by some home traditional processes. Food Chemistry, 89(4), 489–495. https://doi.org/10.1016/j.foodchem.2004.01.007
- Noorfarahzilah, M., Lee, J. S., Sharifudin, M. S., Mohd Fadzelly, A. B., & Hasmadi, M. (2014). Applications of composite flour in development of food products. International Food Research Journal, 21(6), 2061–2074.
- Onwuka, G. I. (2005). Food Analysis. Neptithalis Prints.
- Sangsukiam, T., & Duangmal, K. (2017). A comparative study of physico-chemical properties and antioxidant activity of freeze-dried mung bean (Vigna radiata) and adzuki bean (Vigna angularis) sprout hydrolysate powders. International Journal of Food Science and Technology, 52(9), 1971–1982. https://doi.org/10.1111/ijfs.13469
- Shah, S. A., Zeb, A., Masood, T., Noreen, N., Abbas, S. J., Samiullah, M., Alim, M. A., & Muhammad, A. (2011). Effects of sprouting time on biochemical and nutritional qualities of mungbean varieties. African Journal of Agricultural Research, 6(22), 5091–5098.
- Tharanathan, R. N., & Mahadevamma, S. (2003). Grain legumes – Boon to human nutrition. Trends in Food Science and Technology, 14(12), 507–518. https://doi.org/10.1016/j.tifs.2003.07.002
- Tulse, S. B., Reshma, V., Rajiv, J., & Sakhare, S. D. (2014). Effect of co-milled wheat, green gram and barley on the rheological and quality characteristics of cookies. Food Science and Technology International, 21(7), 592–602. DOI: 10.117/1082013214550112
- Ukpabi, U. J. (2010). Farmstead bread making potential of lesser yam (Dioscorea esculenta) flour in Nigeria. African Journal of Crop Science, 4(2), 68–73.
- Ukpabi, U. J., & Ndimele, C. (1990). Evaluation of the quality of gari produced in Imo state. Nigerian Journal of Food and Technology, 8(1), 105–109.
- Wongsiri, S., Ohshima, T., & Duangmal, K. (2015). Chemical composition, amino acid profile and antioxidant activities of germinated mung beans (V igna radiata). Journal of Food Processing and Preservation, 39(6), 1956–1964. https://doi.org/10.1111/jfpp.12434
- Yeap, S. K., Beh, B. K., Ali, N. M., Yusof, H. M., Ho, W. Y., Koh, S. P., Alitheen, N. B., & Long, K. (2014). In vivo antistress and antioxidant effects of fermented and germinated mung bean. BioMed Research International, 2014, 1–7. https://doi.org/10.1155/2014/694842
- Yi-Shen, Z., Shuai, S., & Gerald, R. E. (2018). Mungbean proteins and peptides: Nutritional, functional and bioactive properties. Food and Nutrition Research, 62, 1–5. http://dx.doi.org/10.1155/2014/694842