
 ?Mathematical formulae have been encoded as MathML and are displayed in this HTML version using MathJax in order to improve their display. Uncheck the box to turn MathJax off. This feature requires Javascript. Click on a formula to zoom.
Abstract
A field experiment was conducted during the spring season of 2019 to determine the effects of various weed management practices on weed dynamics and productivity of wet direct-seeded spring rice at Baniyani, Jhapa. The experiment was laid out in a Randomized complete block design (RCBD) with five treatments and four replications. The treatments consisted of Pretilachlor 50% EC (dose: 900 ml a.i. ha−1) as a pre-emergence herbicide, Bispyribac sodium 10% SC (dose: 240 ml a.i. ha−1) as a post-emergence herbicide, hand weeding (at 30 DAS and 60 DAS), weed-free (weeding at every 15 days interval) and weedy check as control. The rice variety used in the experiment was Hardinath-1. The plot treated with Bispyribac sodium recorded a significantly higher number of effective tillers per meter square and grains per panicle at 90 DAS while it recorded the lowest weed density (9.17 weeds m−2) at 60 DAS. Sedges were dominant as compared to broadleaf and grasses. Sterility percentage and 1000-grain weight were not affected by various weed management techniques. Bispyibac sodium was found statistically superior in terms of grain yield (6.97 tons ha−1), straw yield (7.78 tons ha−1) and harvest index (47.29%). The experiment concluded that there was a reduction in yield by 67.9 percent due to the presence of weed as compared to weed-free. The economic analysis revealed that the post-emergence herbicide Bispyribac sodium was beneficial as compared to other weed management practices in terms of gross returns, net returns and BC ratio.
PUBLIC INTEREST STATEMENT
Rice (Oryza sativa L.) is a member of poaceae family and is consumed as staple food by majority of world’s population. Rice can generally be cultivated as transplanted, wet-seeded, and dry-seeded. In wet-seeded rice, pre-germinated seeds are broadcasted or sown into the puddled soil surface. Weeds are the major constraint in direct-seeded rice production. In this study, the effect of various weed management techniques were analyzed to check the growth and yield of wet-seeded direct rice. Therefore, the results from this research study imply local farmers to create effective weed management practices in their land use. Furthermore, it is necessary to integrate many weed management approaches as possible to acquire effective, sustainable, and long-term weed control in direct-seeded rice.
Competing interests
The authors declares no competing interests.
1. Introduction
Rice is the world’s most important staple food crop for more than half of the world’s population (Kumar & Ladha, Citation2011). The world’s total rice areais 167 million ha and production is about 782 million tons with productivity of 4.67 Mt ha−1. The productivity of rice in Southeast Asia is 4.41 tons ha−1 and China is the largest producer (FAOSTAT, Citation2018). In Nepal, rice is the chief staple food followed by maize and wheat (Pradhanang et al., Citation2015). It is grown on 1,469,545 ha (around 47.5% of the total cultivated area) and despite being on the first position among all cereal crops in Nepal the production and productivity of rice is 5,151,925 tons and 3505 kg ha−1 respectively which is considered very low (FAOSTAT, Citation2018). Jhapa district ranked second in terms of the area of production (87,500 ha) and productivity (3.86 Mt ha−1) (Ministry of Agricultural Development [MOAD], Citation2017).
Rice is generally cultivated as transplanted, wet-seeded, and dry-seeded. Dry direct-seeded rice is sown directly into a prepared seedbed on dry soil or under zero-till condition. In wet-seeded rice, pre-germinated seeds are broadcasted or sown into the puddled soil surface. In contrast, wet‐seeding involves sowing pre-germinated seed, with a radicle varying in size from 1 to 3 cm, on or into puddled soil (Kumar & Ladha, Citation2011; Rao et al., Citation2007). Low wages and adequate availability of water favour transplanting, whereas high wages and low water availability favour DSR (Pandey & Velasco, Citation2005). High yielding and improved varieties, proper nutrient and weed management techniques drew the farmers towards DSR culture instead of the traditional transplanting system. DSR requires less labour, energy, time, irrigation water, reduces the emission of greenhouse gasses and ensures the proper growth of succeeding crops as well (Kaur & Singh, Citation2017; Kumar & Ladha, Citation2011). Puddling and transplanting operations consume a significant quantity of water; in some cases, up to 30% of the total rice requirement (Chauhan, Citation2012) and puddled soil creates a hardpan below the plough layer and reduces soil permeability and soil structure. This triggers the farmers to be shifted from manual transplanting to the DSR system (Hossain et al., Citation2016). When motorized broadcasting was used, the pre-germination period was shortened to ensure short radicles for ease of handling and to minimize damage, as was the case when drum‐seeders for row‐seeding are employed (Balasubramanian & Hill, Citation2002).
The weeds pose to be more cumbersome in direct-seeded rice (DSR) than in puddled transplanting because the emerging weeds are more competitive as compared to simultaneously emerging DSR seedlings and lack of water in wet and dry direct-seeded rice make these crops more prone to initial weed infestation which lacks otherwise in transplanting (Kashiwar et al., Citation2016). Herbicide-based weed management in large-scale rice farming has become the smartest and most viable option. Therefore, it is must to use herbicide judiciously (Anwar et al., Citation2012). Other herbicides that were found effective in DSR were pyrazosulfuron and oxadiargyl as pre-emergence and azimsulfuron, penoxsulam, cyhalopfop-butyl, and ethoxysulfuron as post-emergence (Rao et al., Citation2007). Herbicides may be a viable alternative to hand weeding (Chauhan & Johnson, Citation2011). Traditionally, weeds were controlled through manual weeding. Manual weeding, though effective, is getting increasingly difficult due to labour scarcity and rising wages rates (Rao & Ladha, Citation2013).
Chemical weed control is being recommended instead of manual weeding as it is cost-effective and less labour dependent. With the availability of herbicides and associated weed management technology, it is possible to improve the yield of direct-seeded rice through chemical weed control (Mishra & Singh, Citation2008). It mustn’t be overlooked that all pesticides are venomous; they must be handled safely so as to avoid excessive and costly wastes, environmental concerns, crop damage, and damage to adjacent crops by spray drift, injury to the applicator, excessive contamination and residues, and injury to beneficial organisms. It is advisable to rotate the herbicide combination in each year for delaying the development of herbicide resistance in weeds (V. P. Singh et al., Citation2016). This study is meant to determine the most suitable weed management practices to control weeds in the direct-seeded spring rice and to work out their economics. The study is also carried out to compare the performance and yield of spring rice under various weed management techniques.
2. Materials and methods
2.1. Experimental site
The experiment was conducted in the command area of Prime Minister Agriculture Modernization Project (PMAMP), Project Implementation Unit (PIU), Rice zone, Jhapa at Baniyani-6, Kechanakawal Rural Municipality. The site was situated at 16.093 km south-west of Bhadrapur, headquarter of Jhapa district. The experimental field was 61 meters above the mean sea level and located geographically at 27° 36.22ʹN latitude and 84° 19.073ʹE longitude.
2.2. Physio-chemical properties of soil
The soil texture of the research plot was found to be loam. The soil was acidic (pH: 4.6) in nature. The soil contains medium (0.17%) amount of nitrogen, low amount of phosphorus (21.98 Kg ha−1) and a low amount of potassium (103.2 Kg ha−1). The organic matter content of the soil was medium (3.50%) (Table ). The experimental field was only used to plant the rice and kept follow rest of the year.
Figure 1. Weather condition of the research site from February to June 2019.
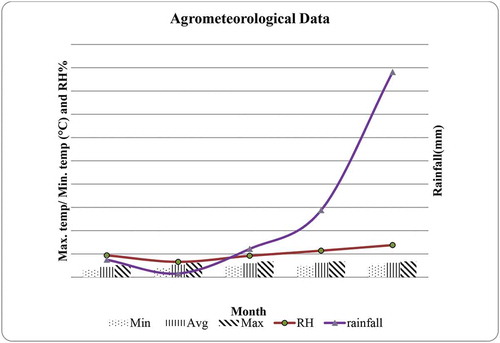
Table 1. Physio-chemical properties of experimental soil
2.3. Agro-meteorological features
The experiment site was located in the sub-tropical humid climatic belt of Nepal where summer was very hot and winter was cool. It received most of the rainfall during monsoon season. The maximum temperature recorded within the study period was 34°C at the time of harvesting, while the minimum temperature was 16°C in February. The maximum relative humidity recorded was 69% in June while the minimum relative humidity record was 33% in March (Figure ).
2.4. Variety used in the experiment
Hardinath-1 was the most popular spring rice in Jhapa. It was originated in Srilanka and was released in Nepal in 2004 recommended for Terai and Inner Terai. It matures in 120 days and had an average yield potential of 4.03 Mt ha−1. It had long and smooth grain with good cooking and eating quality that depends on its soft to medium gel consistency, intermediate amylose content and good kernel elongation.
2.5. Machinery used
Drum seeder was used to sow the pre-germinated seeds in the puddled field. It was an agricultural implement used for sowing the seeds directly in the wet-land field which was pulled manually and sowed 8 rows at one draw. The sprouted seeds thus need to be dried in the shade prior to sowing for easy allocation from the holes of drum seeder.
2.6. Experimental design
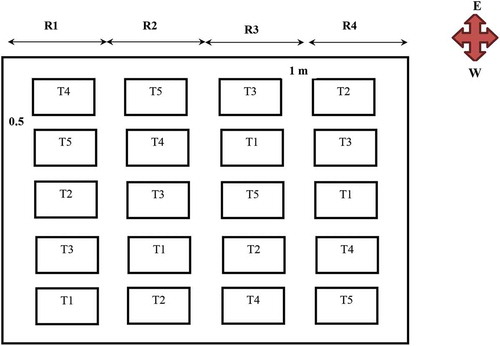
The experiment was carried out on randomized complete block design (RCBD) with five treatments including control and each treatment was replicated four times. The individual plot size was 4 × 3.2 m2 maintaining the row spacing of 20 cm. The spacing between replications was 1 m and between treatments was 50 cm. The total field experimental area was 347.6 m2 (Figure ).
Figure 2. Figurative representations of treatments and replications used in the research.
2.7. Treatment details
The treatments consisted of Pretilachlor 50% EC (dose: 900 ml a.i. ha −1) as pre-emergence herbicide, Bispyribac sodium 10% SC (dose: 240 ml a.i. ha −1) as post-emergence herbicide, hand weeding (at 30 DAS and 60 DAS), weed-free (weeding at every 15 days interval) and weedy check as control (Table ).
Table 2. Details of treatment used in the research
2.8. Cultivation practices
2.8.1. Field preparation
To get good tilth of the soil for sowing, the field was puddled with the help of tractor-drawn paddy puddler, followed by one planking before sowing.
2.8.2. Fertilizer application
Nitrogen, Phosphorus and Potassium were applied at the dose of 100:30:30 kg NPK per hectares, respectively, in the form of urea, diammonium phosphate and muriate of potash. One-third of nitrogen, the full dose of phosphorus and potassium was applied as basal dose in all treatments. Remaining two-third dose of Nitrogen was applied on standing crop by top dressing into two equal splits at the tillering stage and panicle initiation stage of the crop.
2.8.3. Seed rate and sowing
The rice seeds were sown on 23rd Magh 2075 (6 February 2019) by direct seeding in line, 20 cm apart continuously at the rate of 30 kg ha−1. The seeds were first treated with salt (250 gm salt in one-litre water) and rice was directly planted with drum seeder.
2.8.4. Irrigation
In all the treatments, water was available all the time. Irrigation was applied from the first week of Falgun to Jestha (mid-February to mid-June) in such a manner that field remained wet all the time in these treatments.
2.8.5. Weeding and inter-cultural operation
Weed control was done through different herbicide and hand-weeding as per treatments. Weeds were allowed to grow along with the rice crop throughout the crop cycle without any management in weedy check plots (control). The two hand weedings were done at 30 and 60 DAS as in farmers practice, application of Bispyribac sodium at 24DAS, Pretilachlor at 3 DAS and weeding in every 15 days interval in weedy free plots (Table ).
2.9. Observation recorded on weed
2.9.1. Weed identification
Weed sampling was done in every 15 days interval starting from 30 DAS up to 75 DAS. Weeds from sampling area (i.e. from 20 × 30 cm2) were observed, identified and recorded with their categories as broadleaf weeds, grasses and sedges according to their morphology. Photos taken from the internet and weed catalogue were used for the identification of weeds.
2.9.2. Weed density
The number of weeds emerged was counted from 0.06 m2 (20 cm × 30 cm) at 30, 45 and 60 DAS. The total number of weeds was calculated by summation of total broadleaf weeds, sedges and grasses.
2.9.3. Weed index (WI)
It was defined as the reduction in yield due to the presence of weeds in comparison with no weed plot.
Where,
X = Yield from minimum weed competition plot (weed-free plot)
Y = Yield from the treatment for which WI was to be worked out (treated plot)
2.10. Observation recorded in rice
2.10.1. Phenological observations
It was taken from the fixed 10 plants (5 plants in the 6th and 5 plants in the 12th rows of each plot). The phenological observation was recorded at panicle initiation, booting, flowering, heading, milking, soft and hard dough and physiological maturity. Approximately 75% development of each of the stage was treated as completion of that particular stage and the data were expressed as days after sowing (DAS).
2.10.2. Biometrical observations
2.10.2.1. Plant height (cm)
Randomly selected and tagged 10 plants from different alternate rows i.e. one plant from 2nd, another from 4th row and so on except border row and the destructive row was used for the measurement of plant height. Plant height was measured at 15 days interval from 35 DAS up to 90 DAS. The average of 10 plants was expressed as plant height. It was measured from base to tip of the upper leaves of the main stem.
2.10.2.2. Number of tillers per square meter
Tiller per square meter was counted from the plants taken from destructive sampling rows at 15-day intervals from 30DAS up to 90DAS and mean was recorded. One meter row length was marked in the third row of each plot for counting the number of tillers.
2.10.2.3. Leaf area index (LAI)
Leaf area (cm2) of green leaves was obtained at the 15-days interval from 30DAS to 90DAS. The plants of 25 cm row length were selected from destructive row samples in each plot.
2.11. Yield attributing characters of rice
2.11.1. Number of effective tillers per square meter
The observation regarding the effective tillers per square meter was recorded within each plot from one full length of rows just before harvesting the crop and the average values were used to obtain the effective tillers per square meter.
2.11.2. Length of panicle (cm)
The randomly selected 20 panicles were taken from sixth and seventh rows outside from the net plot to measure the length of the panicle. This was done just before harvesting and the mean was calculated.
2.11.3. Number of filled grains per panicle and sterility percentage
It was counted and weighted in electronic balance by taking the grains from 20 panicles just before harvesting (panicles which were selected for length measurement). At the same time, the number of filled and unfilled grains was counted to determine the number of filled grains per panicle and sterility percentage. Sterility percentage was calculated using the following formula.
2.11.4. 1000-grain weight (TGW) (g)
Thousand grains were counted from the randomly selected grain yield of net plot of 1m−2 and weighed with the help of electronic balance at exact moisture content and mean was calculated and expressed in gram at 14% moisture level.
2.11.5. Grain and straw yield (Kg ha−1)
The crop from the net plot was harvested to record the grain yield. Grain yield and straw yield were taken at harvest of the crop from each net plot. The crop was dried, threshed, cleaned and again sun-dried and final weight was taken. Moisture was measured with the help of moisture meter at 14% moisture using the formula
Where,
MC is the moisture content percentage of the grains
The straw yield was obtained by deducting grain yield from total biomass yield of the net plot.
2.11.6. Harvest index
Harvest index (HI) was computed by dividing grain yield at 0% moisture with the total dry matter yield (grain yield at 0% moisture and straw dry weight) as per the formula.
2.12. Economic analysis
2.12.1. Cost of cultivation, gross return and net return
The cost of cultivation for each treatment was calculated based on local charges and prevailing market prices for different agri-inputs like labour, seed, fertilizer, machines and other necessary materials. Economic yield (grain + straw) was converted into the gross return (NRs. ha−1) based on local market prices of different commodities. Net return was calculated by deducting the cost of cultivation from the gross return.
2.12.2. Benefit-cost (BC) ratio
It was calculated by using the following formula.
2.13. Statistical analysis
The recorded data on various observed parameters were compiled and arranged treatment-wise systematically in four replications. MS-Excel was used for simple statistical analysis, construction of graphs and tables. Compiled data were subjected to analysis of variance (ANOVA) and data related to weed species was transformed by square root transformation before analysis of variance. Gen-Stat package was used for data analysis.
3. Results and discussion
3.1. Plant height
The study revealed that the plant height was significantly influenced by weed management practices. The average plant height varied from 20.50 cm (30 DAS) to 82.9 cm (90 DAS) and increasing up to 90 DAS. Plant height in each date of observations was not significantly influenced by weed management practices up to 75 DAS but was found statistically significantly at 90 DAS at 5% level. At 90 DAS, the plant height was statistically similar in all the treatments except weedy check. The plot treated with Bispyribac sodium had the longest plant height (87.9 cm) as compared to others and it was statistically similar to other treatments except for weedy check. Shorter plant height (74 cm) was recorded on weedy check plots (Table ).
Table 3. Plant height influenced by different weed management practices at Baniyani, Jhapa, 2019
3.2. Number of effective tillers per unit area
The number of tillers per square meter was significantly influenced by different weed management practices at 60 DAS, 75 DAS and 90 DAS. The number of tillers per square meter increased from 30 DAS to 60 DAS and then decreased towards maturity. At 60, 75 and 90 DAS, the number of tillers per square meter was highest in Bispyribac treated plots as compared to other treatments and was significantly higher than other treatments. The weedy check had a significantly lower number of tillers in all dates of observation. At 90 DAS, the number of tillers at farmers’ practice was statistically similar with all the treatments except in weedy check (Table ). Reduced weed competition at critical crop growth stages results in increased availability of nutrients, water and light to the crops result in higher effective tillers per square meter (Bhurer et al., Citation2013).
Table 4. Number of tillers per square meter influenced by different weed management practices at Baniyani, Jhapa, 2019
3.3. Leaf area index (LAI)
The average leaf area index increased from 30 DAS (0.289) to 75 DAS (3.26) and decreased toward maturity at 90DAS (3.15) mainly due to leaf senescence. The increased number of tillers or leaves on each tiller along with the increment in the size of the leaf was the main cause to increase leaf area index. At 45 DAS, LAI of the Bispyribac sodium treated plot (1.730) was significantly higher which was statistically par with pretilachlor treated plots (1.474). LAI of the weedy check (0.603) was lowest which was statistically similar with two hand weeding (0.819) and weedy free (1.179). At 75 DAS and 90 DAS, the plots treated with Bispyribac sodium had the highest LAI which was statistically par with pretilachlor treated plots. LAI of weedy free at both dates of observation were intermediate and statistically similar with two hand weeding. Maximum leaf area index was found at 75 DAS (Table ). Vergara et al. (Citation1966) stated that in the growing period of the plant there comes the point when leaf area starts to decrease because no leaves are formed and senescence of older leaves start.
Table 5. Leaf area index influenced by different weed management practices at Baniyani, Jhapa, 2019
3.4. Yield attributing characters
3.4.1. Panicle length, number of grains per panicle, 1000-grain weight and sterility percentage
The weed management practices had a significant effect on panicle length where the average panicle length was 19.79 cm. The weedy-free plot has longer panicle length (21.11 cm) as compared to others and was statistically similar with all the treatments except weedy check. Shorter panicle length (16.02 cm) was recorded on the weedy check plot which might be due to draining of nutrients by weeds (Table ). A similar result was obtained by Dubey et al. (Citation2017).
Table 6. Yield attributes influenced by different weed management practices at Baniyani, Jhapa, 2019
The number of grains per panicle ranged from 54.5 in control plot to 108.2 in Bispyribac sodium with an average of 88.3. The weed management practices had a significant effect on the number of grains per panicle at 1% level. There had been the statistically similar pattern for the number of grains per panicle in all weed management practices except in weedy check. Weedy check produced a lower number of grains per panicle due to presence of weeds throughout the crop cycle which caused the depletion and less absorption of nutrients by the crop, especially during grain filling period. The highest number of grains per panicle in Bispyribac sodium treated plots might be due to the effective suppression of weeds (Table ).
The mean 1000-grain weight in the experiment was 21.24 g. The effect of weed management practices was non-significant on 1000-grain weight. Among the weed management practices, two hand weeding produced the highest (21.86) 1000-grain weight and Pretilachlor produced the lowest 1000-grain weight (20.84) (Table ). Singh and Singh (Citation2005) conducted an experiment in Faizabad during 2002 and 2003 and observed that yield attributes viz. panicle m−2, length of panicle, grains per panicle and 1000-grain weight increased significantly by all weed control treatments compared to weedy check.
The average sterility percentage during the experiment was observed to be 11.49% ranged from 10.27% in weedy check to 12.71% in Bispyribac sodium treated plots. Weed management practices had no significant effect on sterility percentage (Table ).
3.4.2. Weed flora of wet direct-seeded rice (WDSR)
The dominant weeds of observed at different growth stages of WDSR are listed in Tables . Fourteen weed species belonging to seven families were observed in the experimental plots. All the grassy weeds observed belong to the Poaceae family. Similarly, all the sedges were from the Cyperaceae family. The broad-leaved weeds were from five different families and mostly dicotyledonous. Changes in rankings of dominant weeds were observed by Y. Singh et al. (Citation2005) in response to both dry‐ and wet‐seeding of rice in the Indo‐Gangetic plains.
Table 7. Grasses observed in wet-seeded rice at Baniyani, Jhapa
Table 8. Grasses observed in wet-seeded rice at Baniyani, Jhapa
Table 9. Broadleaf weeds observed in wet-seeded rice at Baniyani, Jhapa
3.4.3. Weed density at 30 DAS, 45 DAS and 60 DAS
The grand mean of weed density at 30 DAS showed higher sedges density (130.62 m−2) followed by grasses (69.16 m−2) and broad leaves (27.49 m−2). Weed density at 30 DAS differed significantly due to weed management practices at 5% level (Table ). The weed density was significantly lower in the treatments applied with Bispyribac as compared to the weedy check. The result clearly showed a significant reduction of weed densities due to Bispyribac sodium application as a post-emergence application. Yaduraju and Mishra (Citation2005) reported that sedges such as Cyperus iria and Cyperus difformis were common under both wet‐ and dry‐seeded conditions. Sen et al. (Citation2002) stated that the flooded condition in the field reduces the weed population and reduction in broadleaf was significant.
Table 10. Weed density as influenced by weed management practices at 30 DAS in DSR at Baniyani, Jhapa
Weed density of wet DSR as influenced by weed management practices at 45 DAS was presented in Table . The grand mean of weed density at 45 DAS showed higher sedges density (147.47 m−2) followed by grasses (54.16 m−2) and broad leaves (21.65 m−2). Weed density of dicotyledons was significantly lower than the grasses and sedges. Grasses, broad leaves and sedges weed density was not significantly influenced by weed management practices and was highest in weedy check (Table ).
Table 11. Weed density as influenced by weed management practices at 45 DAS in DSR at Baniyani, Jhapa
Weed density at 60 DAS showed higher sedges density (123.33 m−2) followed by broad-leaved weeds (43.33 m−2) and grasses (15.83 m−2). Grasses and sedges weed density was not significantly influenced by weed management practices and were highest in weedy check. Broad-leaved and sedges weed density was found significantly influenced by weed management practices. Broad-leaf weed density in two hand weeding (66.6 m−2) was highest and statistical similar with Pretilachlor, weedy free and weedy check at 5% level of significance (Table ). Khaliq et al. (Citation2012) stated that the tank mixture application of post-emergence herbicide reduced weed density and tank mixture application of Bispyribac sodium and ethoxysulfuron had the lowest weed density.
Table 12. Weed density as influenced by weed management practices at 60 DAS in DSR at Baniyani, Jhapa
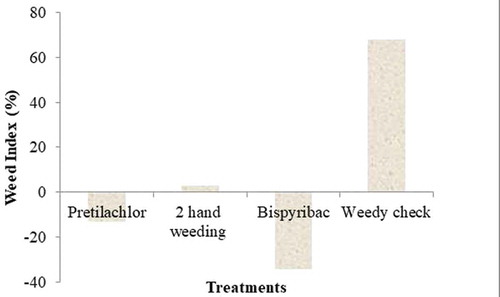
3.4.4. Weed index (WI)
Among the weed management practices, there was 67.9% yield reduction in weedy check which was significantly higher than other weed management practices. Weed index of the plot treated with Bispyribac was significantly lowest (−34.4) and was statistically superior. Weed index of pretilachlor treated plots (−13) was intermediate and statistically par with hand weeding (2.9) (Figure ). The negative weed index in the plot treated with herbicides indicates a higher yield than that of control. Sharma (Citation2013) also reported the 65% yield reduction due to weed in direct-seeded rice in Chitwan, Nepal condition.
Figure 3. Weed index influenced by different weed management practices.
3.5. Yield
3.5.1. Grain yield, Straw yield and Harvest index
The mean grain yield of the experiment was found to be 4.97Mt ha−1. The grain yield was significantly influenced by weed management practices at 1% level. The grain yield is the function of some yield attributing characters like effective tillers, grains per panicle, test weight, panicle length, panicle weight etc. The highest grain yield (6.97Mt ha−1) was observed in Bispyribac sodium treated plots as compared to other treatments followed by Pretilachlor, hand weeding and weedy free conditions which were significantly similar. The lower yield (1.68Mt ha−1) in weedy check might be due to competition from weeds which reduced Leaf area index and allowed less light transmission producing less biosynthate (Table ).
Table 13. Grain yield (Mt ha−1), straw yield (kg ha−1) and harvest index as influenced by different weed management practices at Baniyani, Jhapa, 2019
The straw yield was significantly influenced by weed management at 1% level where the mean straw yield was 6.05 Mt ha−1. The highest straw yield (7.78 t ha−1) was recorded with Bispyribac treated plots which were statistically par with all other treatments except weedy check. The weedy check produced the lowest straw yield (2.08 Mt ha−1) which was due to the lower number of plant population caused by weed infestation(Table ).
The average harvest index in the experiment was 0.4566. It was not significantly influenced by weed management practices (Table ).
3.5.2. Benefit-cost ratio
The application of Bispyribac sodium (1.41) had the highest BC ratio which was statistically superior to other treatments at 1% level. The lowest BC ratio was observed in the weedy check (0.376) (Table ).
Table 14. Total cost of production, gross return, net return and BC ratio influenced by different weed management practices at Baniyani, Jhapa, 2019
4. Conclusion
Weeds are the major constraints to direct-seeded rice production and its management is the most. Improper management cause severe losses in yield and economic return. Weed density was reduced by weed management practices in wet direct-seeded rice. There was a reduction in yield by 67.9% due to presence of weed as compared to weed-free. Bispyribac sodium was superior compared to other weed management practices for wet-seeded spring rice. All the weed management practices significantly improved grain yield of wet-seeded spring rice. The economic analysis revealed that the post-emergence herbicide Bispyribac sodium was beneficial as compared to other weed management practices in terms of gross returns, net returns and BC ratio. It is necessary to integrate many weed management approaches as possible to acquire effective, sustainable, and long-term weed control in DSR. In Nepal, future research in DSR systems should focus on the integration of appropriate weed management practices with suitable cultivars and appropriate herbicide application timing and combinations. Proper study on weed biology and ecology in DSR systems in different rice ecosystems can contribute in high economic return.
Authors contribution
RD, SRP and NB designed the experiment. RD and SRP were involved in the data collection. RD and NB were involved in data entry. All the authors were involved in data analysis and interpretation. RD, SRP and NB prepared the manuscript. BS and DBTM edited and finalized the manuscript. BS and DBTM provided constructive feedback and monitored during the entire research period. RD was involved in the final editing and publication.
Cover Image
Source: Author.
Acknowledgements
Foremost, I would like to express my sincere gratitude to the entire staff of Prime Minister Agriculture Modernization Project, Project Implementation Unit, Rice Zone, Jhapa for the continuous support during the entire research period. I am very thankful to the farmers of the study area for granting their field to conduct the research work.
Disclosure statement
The authors declare that there is no conflict of interest regarding the publication of this article.
Additional information
Funding
Notes on contributors
Rashmi Dangol
Rashmi Dangol is an agriculture graduate from Agriculture and Forestry University, Chitwan, Nepal. Currently, she is studying Masters degree in agriculture in Rural Sociology from the same university. She is presently working as an agricultural instructor, a department head of plant science at Shree Janata Secondary School. She is teaching several practical courses in Plant Science and involved in research and community tasks. Her area of interest includes research and innovation, agriculture extension, social science and statistics.
References
- Anwar, M. P., Juraimi, A. S., Puteh, A., Man, A., & Rahman, M. M. (2012). Efficacy, phytotoxicity and economics of different herbicides in aerobic rice. Acta Agriculturae Scandinavica, Section B-Soil and Plant Science, 62(7), 604–18. https://doi.org/10.1080/09064710.2012.681060
- Balasubramanian, V., & Hill, J. E. (2002). Direct seeding of rice in Asia: Emerging issues and strategic research needs for the 21st century. In S. Pandey, M. Mortimer, L. Wade, T. P. Tuong, K. Lopez, & B. Hardy (Eds.), Direct seeding: Research strategies and opportunities (pp. 15–39). International Rice Research Institute.
- Bhurer, K. P., Yadav, D. N., Ladha, J. K., Thapa, R. B., & Pandey, K. R. (2013). Efficacy of various herbicides to control weeds in direct-seeded rice (Oryza sativa L.). Global Journal of Biotechnology, Agriculture and Health Science, 2(4), 205–212. https://doi.org/10.3126/ajn.v3i0.9006
- Chauhan, B. S. (2012). Weed management in direct-seeded rice systems. International Rice Research Institute, Metro Manila, Philippines. http://books.irri.org/9789712202940_content.pdf
- Chauhan, B. S., & Johnson, D. E. (2011). Growth response of direct seeded rice to oxadiazon and Bispyribac sodium in aerobic and saturated soils. Weed Science, 59(1), 119–122. https://doi.org/10.1614/WS-D-10-00075.1
- Dubey, R., Singh, D., & Mishra, A. (2017). Effect of weed management practices and establishment methods on growth, productivity and economics of rice. International Journal of Current Microbiology and Applied Sciences, 6(3), 65–72. https://doi.org/10.20546/ijcmas.2017.603.006
- FAOSTAT. (2018). FAOSTAT database. Food and Agriculture Organization of the United Nations (FAO). http://www.fao.org/faostat/en/#data/QC
- Hossain, M. M., Begum, M., Rahman, M. M., & Akanda, M. M. (2016). Weed management on direct-seeded rice system - A review. Progressive Agriculture, 27(1), 1–8. https://doi.org/10.3329/pa.v27i1.27526
- Kashiwar, S. R., Kumar, D., Dongarwar, U. R., Mondal, B., & Nath, T. (2016). Experiences, challenges and opportunities of direct seeded rice in Bhandara district of Maharastra. Journal of Energy Research and Environmental Technology, 3(2), 141–145.
- Kaur, J., & Singh, A. (2017). Direct seeded rice: Prospects, problems/constraints and researchable issues in India. Current Agriculture Research Journal, 5(1), 13–32. https://doi.org/10.12944/CARJ.5.1.03
- Khaliq, A., Matloob, A., Mahmood, S., Abbas, R. N., & Khan, M. B. (2012). Seeding density and herbicide tank mixture furnish better weed control and improve growth, yield and quality of direct of direct seeded fine rice. International Journal of Agriculture & Biology, 14(4), 499–508. http://www.fspublishers.org/published_papers/76200_.pdf
- Kumar, V., & Ladha, J. K. (2011). Direct seeding of rice: Recent developments and future research needs. Advances in Agronomy, 111, 297–413. https://doi.org/10.1016/B978-0-12-387689-8.00001-1
- Mishra, J. S., & Singh, V. P. (2008). Integrated weed management in dry-direct seeded irrigated rice (Oryza sativa). Indian Journal of Agronomy, 53(4), 299–305. http://www.indianjournals.com/ijor.aspx?target=ijor:ija&volume=53&issue=4&article=010
- Ministry of Agricultural Development (MOAD). (2017) . Statistical information on nepalese agriculture. Ministry of Agriculture and Livestock Development, Government of Nepal.
- Pandey, S., & Velasco, L. (2005). Trends in crop establishment methods in Asia and research issues. In K. L. Heong, B. Hardy, & K. Toriyama (Eds.), Rice is life: Scientific perspectives for the 21st century (pp. 178–181). International Rice Research Institute andInternational Research Center for Agricultural Sciences.
- Pradhanang, U. B., Pradhanang, S. M., Sthapit, A., Krakauer, N. Y., Jha, A., & Lakhankar, T. (2015). Nepal Portfolio Performance Review (NPPR). Ministry of Agricultural Development (MOAD).
- Rao, A. N., Johnson, D. E., Sivaprasad, B., Ladha, J. K., & Mortimer, A. M. (2007). Weed management in direct-seeded rice. Advances in Agronomy, 93, 153–255. https://doi.org/http://doi.10.1016/S0065-2113(06)93004-1
- Rao, A. N., & Ladha, J. K. (2013, October 22–25). Economic weed management approaches for rice in Asia. Proceeding 24th Asian-Pacific weed science society conference, Bandung, Indonesia.
- Sen, L. T., Ranamukhaarachchi, S. L., Zoebisch, M. A., Hasan, M. M., & Meskuntavon, W. (2002). Effects of early-inundation and water depth on weed competition and grain yield of rice in the central plains of Thailand. Conference on international agricultural research for development (pp. 9–11).
- Sharma, M. (2013). Weed dynamics and yield of dry direct seeded rice under different weed management practices at Rampur, Chitwan. Tribhuvan University.
- Singh, V. P., Singh, S. P., Dhyani, V. C., Banga, A., Kumar, A., Satyawali, K., & Pant, G. B. (2016). Weed management in direct-seeded rice. Indian Journal of Weed Science, 48(3), 233–246. https://doi.org/10.5958/0974-8164.2016.00059.9
- Singh, Y., & Singh, G. (2005). Cropping systems and weed flora of rice and wheat in the Indo-Gangetic plains. In Y. Singh, V. P. Singh, B. Chauhan, A. Orr, A. M. Mortimer, D. E. Johnson, & B. Hardy (Eds.), Direct seeding of rice and weed management in the irrigated rice-wheat cropping system of the Indo-Gangetic plains (pp. 33–43). International Rice Research Institute.
- Singh, Y., Singh, G., Johnson, D., & Mortimer, M. (2005). Changing from transplanted rice to direct seeding in the rice-wheat cropping system in India. In K. Toriyama, K. L. Heong, & B. Hardy, (eds.), Rice is life: Scientific perspectives for the 21st century (pp. 198–201).
- Vergara, B. S., Tanaka, A., Lilis, R., & Puranabhavung, S. (1966). Relationship between growth duration and grain yield of rice plants. Soil Science and Plant Nutrition, 12(1), 31–39. https://doi.org/10.1080/00380768.1966.10431180
- Yaduraju, N. T., & Mishra, J. S. (2005). Sedges in rice culture and their management. In Y. Singh, G. Singh, V. P. Singh, P. Singh, B. Hardy, D. E. Johnson, & M. Mortimer (Eds.), Direct seeding of rice and weed management in the irrigated rice‐wheat cropping system of the Indo Gangetic plains (pp. 17). Directorate of Experiment Station, G.B. Pant University of Agriculture and Technology.