
 ?Mathematical formulae have been encoded as MathML and are displayed in this HTML version using MathJax in order to improve their display. Uncheck the box to turn MathJax off. This feature requires Javascript. Click on a formula to zoom.
Abstract
Key among government strategies to promote efficient and participatory water management in Kenya is through empowering local communities to manage water resources through Water Resource Users’ Associations (WRUAs) which is a collective action initiative. However, there is contrasting empirical evidence on the welfare benefits households derive from this water governance mechanism. The study applied the endogenous switching regression to estimate the causal impact on household consumption per adult equivalent and household incomes per adult equivalent. The results indicate that WRUA membership has a positive and significant effect on household consumption per adult equivalent and household income per adult equivalent. The results show that non-members would have significant welfare improvements in their household consumption and incomes if they undertook WRUA membership.
PUBLIC INTEREST STATEMENT
Water demand in Kenya, like in most developing countries, has risen sharply in recent years due to increased users and uses. Kenya has five water catchments including; Tana, Athi, Rift Valley, Ewaso Ng’iro and Lake Victoria catchments. As a result, all the five catchments are facing degradation as a result of manmade and natural factors including climate change, making water risk a reality. Water risk is associated with physical water availability and water quality. To mitigate the water risk, grassroots water governance institutions have been targeted. We therefore assess the impact of these local water governance institutions on household welfare, since, households as a decision-making unit are rational and will choose pareto efficient outcomes of investments before participating. The empirical results show that community-based water governance institutions can achieve the two desired ends of sustainability in water use for ecological benefits and household welfare improvements.
1. Introduction
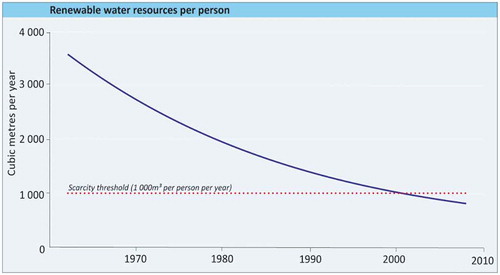
Despite water being a constitutional right to every Kenyan, per capita rechargeable freshwater resources, have been declining over time and currently stand at an average of 650 cubic meters, far below the recommended threshold of 1000 cubic meters per capita annually as shown in Figure . Following this decline in per capita water resources, the United Nations (UN) has classified Kenya as a chronically “water-scarce” country (Republic of Kenya, Citation2015; Republic of Kenya, Citation2010; Ogendi & Ong’oa, Citation2009; Mogaka et al., Citation2006). The main water-related challenges facing the country include; growing population, water scarcity, climate variability, sporadic water resource conflicts and water catchment degradation (Chepyegon & Kamiya, Citation2018; Kiteme & Wiesmann, Citation2015; Nyanchaga, Citation2016; Ogendi & Ong’oa, Citation2009; Viaggi et al., Citation2014).
Figure 1. Decline in per capita renewable water resources over time
Key among government strategies to promote efficient and participatory water management is through empowering local communities to manage water resources through Water Resource Users’ Associations (WRUAs) which is a collective action initiative. This approach was adopted following the second Dublin Principle that states that water development and management should be based on a participatory approach, involving users, planners and policy makers at all levels. Informed with this knowledge, Water Resource Users’ Associations (WRUAs) were officially created in Kenya by the Water Act of 2002. The Water Act 2002 provides for establishment of WRUAs, which are community-based associations for collective management of water resources and resolution of conflicts concerning use of water resources. After the enactment of the legislation, the formation and registration of WRUAs have intensified.
Collective action is now recognized as central to addressing the water governance and management challenges (Suhardiman et al., Citation2017). This is because collective action can strengthen the bargaining power of smallholders relative to other producers of environmental services and buyers of environmental services (Swallow et al., Citation2005). Several studies have shown evidence where individual farmers prefer not to be WRUA members for different reasons especially where there is a negative relationship between elite capture and users’ satisfaction (Agrawal, Citation2002; Kadirbeyoğlu & Özertan, Citation2011; Richards & Syallow, Citation2018). Apart from elite capture, the other major problems facing WRUAs include; dependency on donor support; the management structure; power issues within the management; finally some community members believe that WRUAs have no right to enforce cooperation over water resources, due to the belief that water is God given and one should use his/her share of water without restriction and therefore will self-select into non-membership (Richards & Syallow, Citation2018; Aarts, Citation2012; Kadirbeyoğlu & Özertan, Citation2011; Agrawal, Citation2002). The highlighted problems facing WRUAs, especially elite-capture and the management structure may pose a problem of self-selection bias, where non-members’ decision to join membership will be influenced by observable and non-observable characteristics.
Several studies have assessed the Impacts of Water User Associations (WUAs) on household welfare (i.e. food security; income; poverty reduction, assets, farm productivity), the findings have shown contrasting findings, whereby, several studies showed positive welfare impacts (Balasubramanya et al., Citation2016; Gebrekidan, Citation2013; Leuveld et al., Citation2010; McCarthy & Essam, Citation2009), while other studies found no welfare impacts associated with WUA participation (Chun, Citation2014 & Shiferaw et al., Citation2008). According to Chun (Citation2014) participation in water collective action is found to increase sufficiency of water in the canal, but not land productivity or per capita incomes. According to Shiferaw et al. (Citation2008) collective action has a positive and highly significant effect on natural resource investments, but no evidence of its effects on household assets and poverty reduction outcomes. In conclusion Chun (Citation2014) shows that a major challenge with water collective action is that, it may provide greater equality in water access but insufficient incentives to participate, if collective action does not improve household utility (the bundle of welfare goods such as income, poverty alleviation, and productivity). From the literature it is clear that water collective action has different impacts and more evidence is needed to further bridge this knowledge gap.
The most direct and popular measures of welfare are income and consumption expenditure (Kabubo-Mariara et al., Citation2006). According to Deaton and Grosh (Citation2000) for developing countries, a strong case can be made for preferring consumption, based on both conceptual and practical considerations. Since, income is only received intermittently, whereas consumption is “smoothed” over time. Consumption is conventionally viewed as the preferred welfare indicator, for practical reasons of reliability and because consumption better captures long-run welfare levels than current income. Economic theory suggests that current consumption more directly measures the material well-being of the family than current income (Cutler & Katz, Citation1991). We, however, proceed our analysis using household consumption per adult equivalent and household income per adult equivalent.
The main objective of the study was to assess the factors that influence smallholder farmers to participate in WRUAs and its impact on household consumption per adult equivalent and household income per adult equivalent in Kenya.
The study tested the following hypothesis:
There is no relationship between WRUA membership and household consumption per adult equivalent.
There is no relationship between WRUA membership and household income per adult equivalent.
2. Theoretical framework
This study was grounded on the following theories, Hardin’s Theory of Common Pool Resources (CPRs) and Olson’s Theory of Collective Action.
2.1. Tragedy of the commons theory/Hardin’s theory/theory of common pool resources
The theory of the Commons or Tragedy of the commons emanated from Hardin (Citation1968). According to Ostrom (Citation1990), “the tragedy of the commons” has been used as a metaphor for the problems of overuse and degradation of natural resources including water catchments and ecosystems. According to Hardin (Citation1968) the tragedy of the commons develops in this way. Picture a pasture open to all. It is expected that each herdsman will try to keep as many cattle as possible in the commons. Such an arrangement may work reasonably satisfactorily for centuries because tribal wars, poaching and diseases keep the numbers of both man and beast well below the carrying capacity of the land. Finally, however, comes the day of reckoning, that is, the day when the long-desired goal of social stability becomes a reality. At this point, the inherent logic of the commons remorselessly generates a tragedy.
A common pool resource is a resource that benefits a group of people, but which provides diminished benefits to everyone if each individual pursues his or her own self-interest. The value of a common pool resource can be reduced through overuse because the supply of the resource is not unlimited and using more than can be replenished can result in scarcity. Overuse of a common pool resource can lead to the tragedy of the commons problem (Hardin, Citation1968). Hardin argued that without a proper “governance structure” the resource, upon which users depend, is destined to be over-used, over-exploited and consequently to deteriorate until finally it collapses.
Water resources in the catchment area exhibit all the characteristics of CPRs and if not well governed would be over-exploited having dire consequences on households, institutions and wildlife. According to WRMA (Water Resources and Management Authority) and WSTF (The Water Sector Trust Fund) (WRMA and WSTF, Citation2009), the key objectives and reasons why WRUAs were formed in Kenya include; promotion of controlled and legal water use activities; good management practices that make efficient and sustainable use of water resources; the safeguarding of environmental flows for downstream ecological demands and basic human needs; the reduction of water use conflicts; and catchment conservation measures to improve water quantity and quality. These objectives demonstrate the need to avert the tragedy of commons through community-led collective action.
2.2. Olson’s theory of collective action
The foundation of the theory of collective action is based on the work by Olson (Citation1971). According to Olson a group should be treated as an assembly of rational individuals, not as an entity itself. Olson suggested that there are two premises worth of consideration: the size of a group and the mechanism of selective incentives. Small groups are able to provide collective goods only through voluntary action of their members. The incentives to free-ride or shirk are limited here by social control or by transparent effects of group action. Then there are intermediate groups, in which no member of the group is able to gain benefits large enough to bear all the costs of acting, but the number of members is small enough to be successfully monitored. Thus it is hard to predict whether a successful collective action will take place. However, a system of incentives and effective organization make it possible that such a group will act and obtain privileges.
Olson also points to huge groups, which he calls latent ones that face the most severe difficulties to take up collective action. These groups face three problems to successfully organize themselves. First, the larger the group is, the lesser individual benefits are. Second, large groups create incentives to freeriding and face difficulties with regard to just and effective distribution of costs. Finally, in large groups the collective good will be supplied less optimally than in small ones.
There is one more condition that Olson points to when it comes to the supply of collective good and that is coercion. He emphasizes that in order to eliminate the situation of free-riding and with low possibility to apply selected incentives, coercion becomes the ultimate alternative if we wish to have the good supplied. Thus the supply of public goods and services is possible only because people are coerced to pay taxes or other public levies. Similarly, it is often the coercion to become member of labour union and to financially contribute to its activities that brought the political successes of unions. Coercion may thus be the key to successful collective action although one can easily imagine that often it may not suffice. In the case of this study individuals will join WRUAs if the benefits of cooperation outweigh the benefits of exclusion.
3. Materials and methods
The study was undertaken in the Upper Ewaso Ng’iro North Catchment Area (ENNCA), which is the catchment area for the Ewaso N’giro River basin. The Ewaso N’giro River basin is the largest basin in Kenya (ENNDA, Citation2019). The upper catchment area is highly utilized for agricultural production due to favourable weather conditions, fertile soils and irrigation water availability through river abstractions. The main economic activity in Upper Ewaso Ng’iro North Catchment, is small-scale farming (rain-fed and irrigation), small-scale fishery and pastoralism. The area ranges from high potential high altitude to low potential arid and semi-arid zones. Due to the arid nature of most parts of the basin, the atmospheric demand for water is very high (Ericksen et al., Citation2012; Mutiga et al., Citation2010).
Data were collected in the period between September 2019 and December 2019 by trained enumerators who could speak the main local languages; Swahili, Kikuyu, and Kimeru. A multistage sampling technique was used to select the respondents. In the first stage, eight sub-catchments were sampled randomly out of the 21 sub-catchments of the Upper ENNCA; as a result the following sub-catchments were sampled; Ewaso Narok, Pesi, Rongai, Naromoru, Likii, Timau, Sirimon and Ngare Ndare. In the second stage, stratified sampling was done disproportionately to population size of these eight sub-catchments, where the sub-catchments formed the strata. From these eight strata, a list of WRUA members was obtained from WRUAs, from, which we randomly sampled an equal number of 42 member households and a similar number of 42 non-member households from each strata sampled using the nearest neighbor approach to obtain the counterfactual group. The proposed sample size was therefore, 672 households, however, 20 households were dropped due to large sections of missing data and inconsistencies detected during data cleaning, making the effective sample size for the study 652 households.
We utilized primary data collected from households using a semi-structured questionnaire administered to the small-scale farmers by trained enumerators, using the World Bank’s Computer Aided Personal Interview (CAPI) Program, through face to face interviews. The questionnaire included information on household socioeconomic characteristics, farm characteristics, dwelling characteristics, water-related characteristics, cropping systems, livestock systems, income and consumption data. Data for the study were analyzed using STATA version 15.0 statistical software.
Finally, during data collection we observed all necessary ethical considerations, whereby, all respondents were informed about the study objectives and procedures. At the same time respondents were assured of their anonymity and confidentiality. Respondents were also informed that participation in the study was voluntary. The respondents who agreed to the terms and conditions signed a consent form. Skipping questions and withdrawing from the study were allowed at any time during the interview. We also obtained a research license from the research-governing body, i.e., National Commission for Science Technology and Innovation (NACOSTI) to permit this research project. The variables of the study are captured in Table in the appendix where we define the variables of the study and their units of measurements.
4. Analytical framework
Two approaches are used widely to assess impacts of interventions on welfare, i.e. experimental and quasi-experimental methods (Thomas & Chindarkar, Citation2019). Experimental methods are far superior to quasi-experimental methods due to the following three reasons; first randomized trials are considered robust in the assessment of policy interventions; secondly, randomized trials estimate the impact of an intervention through direct comparison with a randomly allocated control group that receives either no intervention or an alternative intervention. Finally, the randomization process ensures that, all else being equal, both known and unknown biases are distributed evenly between trial groups (Grimshaw et al., Citation2000; Thomas & Chindarkar, Citation2019). However, where randomization is not possible due time and budget constraints like in the case of this study, application of quasi-experimental approaches is recommended.
According to Dehejia and Wahba (Citation2002), when dealing with experimental data in which the counterfactual situation is known, the problem of causal inference is not an issue, as compared to, when dealing with a cross-sectional survey data like in the case of this study, where the counterfactual situation is not known, the aspect of causal inference becomes a major concern. Despite the problem of causal inference, Dehejia and Wahba (Citation2002) posit that this problem can be solved by investigating the impact of participation by analyzing the differences in outcomes among participating households and non-participating households using econometric models.
Some of the quasi-experimental econometric models used in impact evaluation include the propensity score matching (PSM) and the endogenous switching regression models (ESR). The propensity score matching model was proposed by Rosenbaum and Rubin (Citation1983). The PSM model estimates the treatment effects using several assumptions including; the Conditional Independence Assumption (CIA); the ignorability assumption; and the common-support/overlap assumption. While PSM has been widely applied to examine welfare impacts, particularly where self-selection is an issue, the weakness of PSM stems from trying to balance the observed distribution of covariates across the groups of participants and non-participants. Hence, the probit or logit estimates obtained in the estimation cannot be considered as determinants of adoption (Bidzakin et al., Citation2019). Further, PSM can produce biased results due to misspecification (Robins et al., Citation2007; Wooldridge, Citation2007). Finally, according to Wossen et al. (Citation2017), matching techniques, regardless of adjustments for miss-specification bias can overcome only the selection bias caused by observables. When the cause of endogeneity bias is unobservable heterogeneity, for example, farmer’s inherent skill, results based on matching techniques would be biased.
The Endogenous Switching Regression model was developed by Lee (Citation1982) as a general model of the Heckman’s selection correction model. To account for heterogeneity bias, the ESR model accounts for both observed and unobserved sources of bias (Lokshin & Sajaia, Citation2004). The ESR approach addresses this endogeneity problem by estimating the selection and outcome equation simultaneously using the full information maximum likelihood (FIML). We therefore applied the endogenous switching regression model following Di Falco et al. (Citation2011).
For the model to be identified it is important to use exclusion restrictions as selection instruments, not only those automatically generated by the nonlinearity of the selection model of WRUA membership but also other variables that directly affect the selection variable but not the outcome variable (Di Falco et al., Citation2011). In our case, we used instrumental variables related to the household main water sources (piped water-tap in the compound, borehole water and river water) and the occurrence of water-related conflicts (water conflicts). We established the admissibility of these instruments by performing a simple falsification test: if a variable is a valid selection instrument, it will affect the participation decision but it will not affect the household consumption per adult equivalent or the household income per adult equivalent among farm households that did not participate. Table of the appendix shows that the main water sources (MWS) and water conflicts can be considered as valid selection instruments, since they are jointly statistically significant drivers of the decision to participate or not in WRUAs as shown in Model 1 (χ2 = 344.23, p = 0.000); but not statistically significant for the consumption per adult equivalent and income per adult equivalent for the households that did not participate in WRUAs as shown in Model 2 (F-stat. = 3.54, p = 0.0000) and Model 3 (F-stat. = 2.35, p = 0.0001).
4.1. Specification of the endogenous switching regression
WRUA membership and participation are modelled as per the random utility theory, whereby farmers will choose between WRUA membership and non-membership based on the expected utility of participation. As such farmers will choose to be WRUA members depending on the expected benefits of participation. The perceived benefits of membership can be represented by a latent variable, which can be expressed as a function of the observed characteristics and attributes, denoted as Z, in a latent variable model as follows;
is a dummy variable that equals 1 for members and zero otherwise;
is the parameter to be estimated. A farmer will only participate in WRUA only if the perceived benefits are positive. The error term ε captures the unobserved effects. Variable Z captures the factors that influence WRUA membership, including household and farm characteristics.
To account for selection biases we adopt an endogenous switching regression model where farmers face two regimes (1) to become WRUA members and regime 0 not to become WRUA members defined as follows:
Regime 0 (Non-member): (2)
Regime 1 (member): (3)
Where and
are the outcome variable (consumption per adult equivalent/income per adult equivalent) for WRUA members and non-members respectively and XJ is a vector of household and farm level characteristics. The vectors β in equations 2 and 3 are the parameters to be estimated.
For easy identification of the covariates of equations 2 and 3 it is suggested that at least one variable in Z does not appear in X. Self-selection occurs in the WRUA participation decisions and may lead to non-zero covariance between the error terms of the WRUA participation decision and the outcome equations. The three error terms in EquationEquations 1(1)
(1) , 2 and 3, i.e.,
,
, ε respectively and are therefore assumed to have a trivariate normal distribution with mean vector zero, with the following covariance matrix:
(4)
Where; M = WRUA membership; N = non-membership
For this reason the error terms in equation 4, conditional the sample selection criterion, have non-zero expected values and ordinary least squares estimates of coefficients and
also will suffer from sample selection bias. According to Johnson and Kotz (Citation1970) the values of the truncated error term
and
are then given as;
And
Where and
are the probability density functions and cumulative distribution function of the standard normal distribution respectively. The ratio of
and
evaluated at
is referred to as the inverse mills ratio represented in EquationEquations 5
(5)
(5) and Equation6
(6)
(6) as
and
respectively, these are called selectivity terms and are incorporated into EquationEquations 5
(5)
(5) and Equation6
(6)
(6) to account for selection bias. Estimation of this model proceeds in two stages, where the first stage involves a probit model to determine the determinants of participation and it generates the inverse mills ratio used in the outcome equation. This two-step technique has a limitation since it generates heteroskedastic residuals and as such cannot be used to obtain consistent standard errors (Lokshin & Sajaia, Citation2004). In order to overcome this limitation, the study used the Full Information Maximum Likelihood estimation (FIML) method developed by Lokshin and Sajaia (Citation2004). This method estimates both participation and outcome equations in simultaneous manner overcoming the problem of the two-step procedure.
The important issues during estimation are the sign and significance levels of the correlation coefficients (p) from the estimates, i.e., correlations of the error terms of the outcome and treatment equations (corr (ε, u) = p. there is endogenous switching if, either or
is significantly different from zero, which would result in selection bias. If p > 0, (positive) this would mean negative selection bias, implying that farmers with below average consumption expenditure are more likely to be members. On the other hand, if p < 0 (negative) it means that there is positive selection bias, suggesting that farmers with more or above average consumption are more likely to be members.
4.2. Conditional expectations, treatment and heterogeneity effects
The FIML was used to estimate the treatment and heterogeneity effects of treatment to obtain the parameters of the Endogenous Switching Regression (ESR) model using the movestay STATA command developed by Lokshin and Sajaia (Citation2004).
Using a counterfactual approach, the ESR model can be used to compare the household consumption expenditure and household income of members and non-members as shown in Equationequations 5(5)
(5) and Equation6
(6)
(6) .
Therefore the observed expected household consumption and counterfactual scenarios will be represented by equations 7 to 10 for members and non-members respectively as follows;
(7)
(8)
(9)
(10)
ATT is the difference between the expected value of the outcome variable from equations 7 and 9. It is the difference between the expected value of the dependent variable for members and if they had become members. ATU is the difference between equations 8 and 10 estimating the difference between the expected value of the outcome variable for non-members and if they had opted to become WRUA members. The conditional expectations, treatment and heterogeneity effects are summarized in Table .
Where:
D = 1 if farm households were WRUA members; D = 0 if farm households were non-members
Quantity of household consumption/income per adult equivalent for member households
Quantity of household consumption/income per adult equivalent for non-member households
TT the effect of treatment on the treated
TU The effect of the treatment on the untreated
BH1 the effect of base heterogeneity for farm households who became WRUA members (participants).
BH2 the effect of base heterogeneity for farm households who did not become WRUA members (non-participants).
TH = (TT-TU), transitional heterogeneity.
5. Results and discussions
5.1. Descriptive statistics
The descriptive statistics are shown in Table . Members and non-members are similar with respect to age of the household head, number of male adults, number of female adults, livestock ownership, credit access, reliance on firewood as the main source of cooking fuel and primary occupation. The two groups are however different with regard to all the other variables. The results show that non-members are highly dependent on rain-fed cropping, with their primary water sources for household needs being, borehole and river water sources. On the contrary, members are more reliant on irrigation cropping, with their primary water source being water tap through piped connection. Finally members seem to have better welfare in terms of household consumption per adult equivalent and household income per adult equivalent than non-members.
Table 1. Treatment effects and heterogeneity effects
Table 2. Household and farm characteristics
5.2. Endogenous switching regression parameter estimates of consumption per adult equivalent, income per adult equivalent and the determinants of WRUA membership
The factors that influence WRUA membership, consumption per adult equivalent and income per adult equivalent are shown in Tables and . The negative and significant rho coefficients in Table show evidence of selection bias in the consumption per adult equivalent model. The negative sign is a sign of positive selection bias implying that farmers with higher consumption expenditure are more likely to self-select into WRUA membership. However, the rho coefficients of the income per adult equivalent model were negative but not significant, implying that farmers were not likely to self-select into WRUA membership on the basis of income. The likelihood ratio test of independent equations is significant for both models, showing that the selection and outcome equations are dependent on each other.
Table 3. Endogenous switching regression estimates on household consumption expenditure per adult equivalent
Table 4. Endogenous switching regression estimates on household income per adult equivalent
5.2.1. Determinants of WRUA membership
The results in Tables and show that the positive and significant determinants of WRUA membership include experience farming, title, firewood being the predominant cooking fuel, having electricity connection, improved crops, irrigation cropping, main water source being piped water through a tap and water conflicts. The negative and significant determinants of WRUA membership included the main water source being borehole water and river water. From the results, farmers with more farming experience are found to be more like to be WRUA members. This finding was consistent with the findings by Gyau et al. (Citation2016) that farmers with more farming experience had a higher probability of engaging in collective action. This implies that farmers with more experience understand the crucial role of water in their farming enterprises and therefore opt to be WRUA members.
Farmers who held a title deed to their farm were more likely to become WRUA members than farmers without. This finding implies two things; first is that farmers understand the importance of land property rights and secondly is that joining a WRUA and getting a water connection is a long-term household investment. This finding is consistent with the arguments by Meinzen-Dick et al. (Citation2002) that collective action and property rights have a major influence on the adoption of agricultural technologies and natural resource management practices for land, water and forest management. Further, according to Meinzen-Dick et al. (Citation2002), tenure security (defined as the extent of people’s rights and how confident they are that their rights will be respected over time) affects people’s long-term investments in technologies for managing their resources. This finding implies that households with a land title perceive their tenure to be secure as compared to those without therefore opt for WRUA membership.
Households connected to the national electricity grid are more likely to be WRUA members. While there is no theoretical underpinning as to why, this can be explained by the fact that most rural collective action initiatives are geared towards provision of social amenities mostly water and electric power. Previous studies have demonstrated the role of rural collective action in rural electricity connection (Gollwitzer & Cloke, Citation2018; Oda & Tsujita, Citation2010; Sanchez & Tozicka, Citation2013; Scott & Seth, Citation2013). While, we did not try to assess collective action for rural electricity connection, the finding points to that direction (albeit with caution), that WRUA members maybe organized collectively to get connected to the national grid.
Households that grew improved crop varieties were more likely to be WRUA members. This implies that households understand the risks associated with crop failure and the potential loss of farm investments and therefore opt to join WRUAs to gain access to irrigation water, to overcome the underlying risk of crop failure due to drought. Previous studies have demonstrated the significant potential of smallholder irrigation in reducing agricultural production risks in developing countries (Nikolaou et al., Citation2020; Salazar & Rand, Citation2016) including Kenya (Nakawuka et al., Citation2018; Scheltema, Citation2002).
Household main water sources were found to be a key driver of WRUA membership. Whereby, households whose main water source was piped water through a tap in the compound were more likely to be WRUA members. This finding was expected since part of the WRUA’s job is to allocate, distribute and maintain the water distribution network as defined in previous studies (Richards & Syallow, Citation2018; WRMA and WSTF, Citation2009). On the contrary, households whose main water source were borehole water and river water were less likely to be WRUA members. This finding was expected since, households with alternative water sources would not have the need to become WRUA members. This finding is consistent with WRMA and WSTF (Citation2009) that WRUA membership is voluntary. This voluntary membership implies that intuitively households join membership out of their free-will without coercion.
Finally, households which experienced water-related conflicts were more likely to be WRUA members. This finding is consistent with previous studies, where the main reasons for the formation of WRUAs were the reduction of water use conflicts (WRMA and WSTF, Citation2009). This finding shows that water-related conflicts are still persistent in the catchment area. It is important to note that resource-based conflicts represent the indirect demand of a commodity (David & Gagné, Citation2006). Therefore, households perceive that participating in WRUAs helps in minimizing water-related conflicts. This finding is consistent with the findings by Baldwin et al. (Citation2018), that regulations and formal conflict resolution mechanisms provide incentives for water users to cooperate, while shared membership in WRUAs facilitates informal opportunities for users to share information and build trust over time in the Upper Ewaso Ng’iro North Catchment Area. Further, Wangombe (Citation2013), in his findings showed that the strategies and approaches used by WRUAs in conflict management are helpful in reducing water resource conflicts in the Upper Ewaso Ng’iro North Catchment Area. Other studies have demonstrated the important role of collective action in conflict resolution (Adano et al., Citation2012; Linke et al., Citation2018; Ratner et al., Citation2017).
5.2.2. Determinants of household consumption per adult equivalent
The positive and significant determinants of household consumption per adult equivalent for members and non-members are shown in Table . The results show that the age of the household head has a positive and significant influence on household consumption per adult equivalent while the age squared has a negative and significant influence on non-members. The positive sign of the age of the household head and the negative sign of its squared term suggests that the age of the household head has a diminishing impact on household consumption per adult equivalent for non-members. The results reveal that older farmers were likely to have lower consumption as compared to young farmers. This is because older farmers are risk averse and prefer conventional ways of farming using less risky technologies, with the outcome being less productivity and less household consumption.
The results show that land size has a positive influence on consumption implying that households with more land have a higher level of consumption. This may be due to the fact that most income-generating activities in the study area are land-based, i.e., farming making land a high return resource. This finding was consistent with the findings by Noack and Larsen (Citation2019), who found that while output per unit decreases with increase in land size, agricultural incomes increase with farm size. Further, farmers benefit from larger farms, earning higher and more stable incomes. These stable incomes can be used to increase household consumption and welfare.
Credit access has a welfare-improving influence since it has a positive influence on household consumption expenditure for both members and non-members. This finding reinforces the importance of rural credit access and welfare improvement. This finding was consistent with the findings by Teka and Lee (Citation2020) who found that access to credit had a positive influence on household consumption per adult equivalent. Electricity connection had a positive and significant influence on household consumption per adult equivalent for WRUA members. Previous studies have documented the negative households impacts of energy poverty on household welfare (Njiru & Letema, Citation2018; Rao & Shonali, Citation2017). According to Sanchez and Tozicka (Citation2013) access to energy has direct impact on health, education, life expectancy, child mortality and contributes to income generation and employment.
Owning a smartphone also has a positive influence on household consumption per adult equivalent for both members and non-members, smartphones offer a wide range of applications that offer essential information through apps (e.g., farming apps, weather information apps, e.g.,, accuweather, etc.), radio, text (SMS, WhatsApp), call, mobile money (sending money and borrowing loans), and internet (email, social media, etc.). Households with smartphones therefore have access to a variety of information that can be utilized to improve farm productivity and therefore have a consumption-increasing effect. This finding concurs with findings by Teka and Lee (Citation2020), who found that households with a mobile phone subscription had more household consumption per adult equivalent than households without. Baumüller (Citation2012) argued that information regarding the existence of (new) agricultural technologies is of course a prerequisite for technology adoption. Such information can be obtained from various external sources, such as extension agents, fellow farmers or different media such as mobile phones, TV or radio.
From the findings, households with more males, females and children had less consumption per adult equivalent, for both members and non-members, although the number of males for members was not significant, but the sign was negative. This generally means that large households are likely to have reduced consumption. What this simply implies is that as household size increases, the welfare of a family decreases. On the other hand, this finding shows that use of the household size as a proxy for household labour may be misleading since as revealed by the results, large households have a lower welfare implying that some of the members do not engage in welfare-improving activities, for example, men could be engaged in drinking and idling instead of farming or off-farm work. These findings are consistent with the findings of previous studies that have shown the negative influence of the household size on per capita household consumption (Gounder, Citation2012; Mukherjee & Benson, Citation2003; Nicklaus, Citation2015; Teka & Lee, Citation2020).
Finally, firewood negatively influenced household consumption per capita for both members and non-members, this is because it is mostly the poor that rely on firewood and other unimproved energy sources such as cow dung for cooking fuel. This finding was consistent with Morrissey (Citation2017) who found that energy poverty is a stark problem in sub-Saharan Africa, whereby, 633 million people are estimated to lack access to electricity, and 792 million people are forced to cook with traditional biomass on unimproved cook stoves. Further, energy-poor households suffer from a wide range of impacts, from increased risk of premature death due to indoor pollution to forgone productivity gains and lower quality of life. On top of these impacts, energy-poor households must spend a greater proportion of their income to meet their basic energy needs. They also spend more time engaging in energy-intensive tasks than do wealthier households who have access to modern energy sources (Morrissey, Citation2017). Finally, group membership was found to have a negative influence on the household expenditure per adult equivalent for non-members. This finding was not expected, however, it could be due to group inefficiencies or maybe the groups that the non-members participate in do not carry out welfare-enhancing activities such as training, collective marketing or value addition, which could improve member welfare.
5.2.3. Determinants of household income per adult equivalent
The determinants of household income per adult equivalent are shown in Table . The positive and significant drivers of household income per adult equivalent for members included; age squared, land size, access to extension, and smartphone. The negative and significant drivers of household income per adult equivalent for members included; the age of the household head, number of female adults and children, firewood being the main source of cooking fuel and the primary occupation of the head being farming. On the other hand the positive and significant determinants of household income per adult equivalent for non-members included; gender of the household head, access to credit, and smartphone. The negative and significant determinants of household income per adult equivalent for non-members included; number of male adults and female adults, group membership, firewood as the main source of cooking fuel and the primary occupation. These findings show that some of the variables have a similar influence to those of household consumption per adult equivalent and in order to avoid repetition we will discuss those unique to household income per adult equivalent.
The results show that the age of the household head has a negative and significant influence on household income per adult equivalent while the age squared has a positive and significant influence on member households. The negative sign of the age of the household head and the positive sign of its squared term suggest that the age of the household head has an increasing impact on household income per adult equivalent for members. This could be attributed to the fact that old age comes with more experience and therefore older farmers are able to generate more incomes than young less experienced farmers. The results show that households headed by a male household head were likely to have more income per adult equivalent for both members and non-members. However, this finding was significant for non-member households only. FHHs are likely to be poor as compared to MHHs (Cho & Kim, Citation2017). Further, previous studies have documented women’s lesser access to critical resources (land, cash and labor), often undermining their ability to attain considerable food expenditure for household farming needs (Aura, Citation2016; Henao & Baanante, Citation2006). Households whose main occupation was farming were likely to have less income per adult equivalent. This finding is consistent with economic theory and previous studies (see, Cho & Kim, Citation2017).
5.3. Average treatment effects on the treated (ATT) and the average treatment effects on the untreated (ATU)
The results of the FIML Endogenous switching regression estimates of the average treatment effects on the treated (ATT), the average treatment effects on the untreated (ATU), the heterogeneity effects and the transitional heterogeneity are shown in Table . The causal effects of household expenditure per adult equivalent for WRUA members are about KES 34,270 and about KES 35,620 for non-members if they opted to become members. With regard to income per adult equivalent, the causal effects of income per adult equivalent for WRUA members are about KES 28,700 and about KES 14,600 for non-members if they opted to become members.
Table 5. Average treatment effects on the treated (ATT) and the average treatment effects on the untreated (ATU)
The results show the expected consumption and income under actual and counterfactual conditions. Cells (a) and (b) represent the expected consumption and incomes observed in the sample. The expected household consumption per adult equivalent and household income per adult equivalent by households that were WRUA members were about KES 97,990 and KES 64,780, respectively, while it was about KES 53,600 and KES 42,700 respectively for households that did not adopt WRUA membership. This simple comparison can be misleading since it may lead one to conclude that households that adopted WRUA membership had KES 44,390 (51%) more consumption per adult equivalent and KES 22,080 (52%) more household income per adult equivalent than non-member households.
The treatment effect column (second last column) presents the treatment effects of WRUA membership on consumption per adult equivalent and income per adult equivalent. In the counterfactual case, (c), shows that households that are WRUA members would have consumed about KES 64,000 which is about 35% less if they were not WRUA members. On the other hand for the case of income, WRUA members would have about KES 36,000, which is about 44% less if they were not WRUA members. Further in the counterfactual case of consumption per adult equivalent (d) shows that if households who were non-members became members, they would have consumed about KES 90,000 that is about 66% more consumption if they became members. Finally, in the counterfactual case of household income per adult equivalent (d) shows that if households who were non-members became members, they would have about KES 57,390 that is about 34% more income per adult equivalent if they became members. The results imply that WRUA membership significantly increases household consumption per adult equivalent and household income per adult equivalent.
From these findings, we therefore reject the first null hypothesis that there is no relationship between WRUA participation and household consumption expenditure per adult equivalent. We therefore accept the alternative hypothesis that there is a positive relationship between WRUA participation and household consumption expenditure per adult equivalent. We also reject the second null hypothesis that there is no relationship between WRUA participation and household income per adult equivalent. We therefore accept the alternative hypothesis that there is a positive relationship between WRUA participation and household income per adult equivalent. These findings are similar to the findings of Speranza et al. (Citation2016) who found that community water projects in the Ewaso Ng’iro North Catchment area largely met the goals of water provision, in addition to improving local livelihoods through improved crop and livestock production not to mention improved health and sanitation. The findings are also similar to the findings by McCarthy and Essam (Citation2009), who found that WRUA membership has a significant influence on household welfare through increased household income.
6. Conclusions
The results show that the significant drivers of WRUA membership include experience farming, title, firewood as the main source of cooking fuel, electricity connection, growing improved crop varieties, irrigation cropping, MWS-tap, MWS-borehole, MWS-river and water-related conflicts. On the other hand the significant drivers of household consumption per adult equivalent for members include: number of female adults and children, land size, credit access main source of cooking energy being firewood, electricity, smart phone, irrigation cropping and rain-fed cropping. The significant drivers of household consumption per adult equivalent for non-members include; age of the household head, age squared male adults, female adults, children, access to credit, group, firewood as the main source of cooking energy, and owning a smartphone. Finally, the significant drivers of household income per adult equivalent for members included: age of the household head, age squared, female adults, children, land size, access to extension, firewood, smartphone, and primary occupation. Finally, the significant drivers of household income per adult equivalent for non-members included: male adults, female adults, credit access, smartphone, and primary occupation.
The study has demonstrated that there is a positive relationship between WRUA membership and household welfare as indicated by the positive impact of WRUA membership and household consumption per adult equivalent and household income per adult equivalent. The results have also revealed that non-members would have significant welfare improvements in their household consumption and household incomes if they undertook WRUA membership. The results have shown that the causal effects of household expenditure per adult equivalent for WRUA members are about KES 34,270 and about KES 35,620 for non-members if they opted to become members. With regard to household income per adult equivalent, the causal effects of household income per adult equivalent for WRUA members are about KES 28,700 and about KES 14,600 for non-members if they opted to become members. The results further showed that WRUA members would have had about 35% less consumption expenditure per adult equivalent, and about 44% less household income per adult equivalent if they were not WRUA members. On the other hand if non-members joined membership, they would have achieved an increase of about 66% more consumption per adult equivalent and an increase of about 34% more household income per adult equivalent if they opted to become members.
6.1. Policy recommendations
The results have shown that communities can collectively allocate and manage water resources sufficiently and generate welfare improving outcomes. Therefore, the following policy recommendations are prescribed for policy makers. While the results have demonstrated that land size is associated with higher consumption expenditure per adult equivalent, households with less land should be taught on intensive farming techniques to leverage on their small landholding. Access to credit needs to be boosted and therefore county governments should negotiate with financing institutions on agreeable financing terms and provide a guarantee scheme so as to increase access to credit. Counties can also take the initiative to popularize and provide incentives for the growth of the village table banking into a powerful source of the much needed credit. Extension service provision still remains a tool for improved productivity and increased rural incomes. Irrigation cropping has great potential to improve rural welfare, therefore more investments should be targeted to encourage households undertake irrigation cropping. The household size still remains a major impediment to household rural welfare, family planning initiatives should be up-scaled. Mobile phones network coverage, affordability of services, and farmer-friendly content should be rolled out, since the results have demonstrated that mobile phones can have welfare improving outcomes. Finally the key policy driver to the uptake of water-related collective action is provision of land title so that farmers get secure property rights and be confident to make long-term welfare improving land-based investments.
6.2. Recommendations for future study
Whereas, the current study has focused on the impact of WRUAs on household welfare using consumption and household income per adult equivalent, we recommend that future studies touch on food security and poverty since these are pressing matters in Kenya’s economy. The study focused on one side of the demand side, which is the smallholder farmers, future studies could focus on the other players in both demand side and supply side to fill this gap in knowledge. Finally to be able to measure water use efficiency, we recommend future studies to evaluate the impacts of WRUAs through efficiency and productivity measures like allocative and technical efficiency.
Conflicts of Interests
The authors declare no conflict of interest.
Acknowledgements
The authors would like to thank the Editor and the two anonymous reviewers for the useful and constructive comments. We also wish to thank the team of enumerators who were involved to collect data for this study. Finally, we wish to thank all the respondents for creating time to take part in this survey.
Additional information
Funding
Notes on contributors

Simon Ng’ang’a Mwaura
Simon Mwaura is a lecturer in the Department of Economics in the School of Business and Economics, Maasai Mara University, Kenya. He is a PhD candidate in Agricultural Economics at Egerton University, Kenya, specializing in natural resource economics. He graduated with MSc. Agricultural and Applied Economics from Egerton University in 2012. He is an innovator and founder of Trendy Animal Feeds a social enterprise aimed at exploring the commercial viability of alternative animal feed protein sources, using the insects-for-feed approach. His research areas encompass, collective action, gender, natural resource management, impact evaluation, water governance, land governance, welfare, smallholder irrigation, and agricultural marketing.
References
- Aarts, J. (2012). Will Community-Based Water Management Solve Africa’s Water Problems? The Performance of Water Resource User Associations in the Upper Ewaso Ng’iro River Basin, Kenya. [Master’s Thesis, University of Nijmegen]
- Adano, W. R., Dietz, T., Witsenburg, K., & Zaal, F. (2012). Climate change, violent conflict and local institutions in Kenya’s drylands. Journal of Peace Research, 49(1), 65–22. https://doi.org/10.1177/0022343311427344
- Agrawal, A. (2002). Common resources and institutional sustainability. In E. Ostrom (Ed.), The drama of the commons (pp. 41–85). National Academy Press.
- Aura, S. (2016). Determinants of the adoption of integrated soil fertility management technologies in Mbale Division, Kenya. African Journal of Food, Agriculture, Nutrition and Development, 16(1), 10697–10710. https://doi.org/10.18697/ajfand.73.15735
- Balasubramanya, S., Buisson, M.-C., Saikia, P., MacDonald, K., Aslamy, S., Horbulyk, T., Hannah, C., Yakubov, M., & Platonov, A. (2016). Impact of water user associations on water and land productivity, equity and food security in Tajikistan. Baseline report, prepared for the United States Agency for International Development (USAID) (pp. 1–127). International Water Management Institute.
- Baldwin, E., McCord, P., Dell’Angelo, J., & Evans, T. (2018). Collective action in a polycentric water governance system. Environmental Policy and Governance, 28(4), 212–222. https://doi.org/10.1002/eet.1810
- Baumüller, H. (2012). Facilitating agricultural technology adoption among the poor: The role of service delivery through mobile phones. ZEF Working Paper Series, No. 93. University of Bonn, Center for Development Research (ZEF).
- Bidzakin, J. K., Fialor, S. C., Awunyo-Vitor, D., & Yahaya, I. (2019). Impact of contract farming on rice farm performance: Endogenous switching regression. Cogent Economics & Finance, 7(1), 1618229. https://doi.org/10.1080/23322039.2019.1618229
- Chepyegon, C., & Kamiya, D. (2018). Challenges faced by the Kenya water sector management in improving water supply coverage. Journal of Water Resource and Protection, 10(1), 85–105. https://doi.org/10.4236/jwarp.2018.101006
- Cho, S., & Kim, T. (2017). Determinants of poverty status in Rwanda. African Development Review, 29(2), 337–349. https://doi.org/10.1111/1467-8268.12260
- Chun, N. (2014). The challenge of collective action for irrigation management in India. Asian Economic Papers, 13(2), 88–111. https://doi.org/10.1162/ASEP_a_00271
- Cutler, D. M., & Katz, L. F. (1991). Macroeconomic performance and the disadvantaged. Brookings Papers on Economic Activity, 2(2), 1–74. https://doi.org/10.2307/2534589
- David, C., & Gagné, J. (2006). Natural resources: A source of conflict? International Journal, 62(1), 5–17. https://doi.org/10.2307/40204241
- Deaton, A., & Grosh, M. (2000). Consumption, in designing household survey questionnaires for developing countries: Lessons from 15 years of the living standards measurement study. The World Bank.
- Dehejia, H. R., & Wahba, S. (2002). Propensity score matching methods for non-experimental causal studies. Review of Economics and Statistics, 84(1), 151–161. https://doi.org/10.1162/003465302317331982
- Di Falco, S., Veronesi, M., & Yesuf, M. (2011). Does adaptation to climate change provide food security? A micro perspective from Ethiopia. American Journal of Agricultural Economics, 93(3), 829–846. https://doi.org/10.1093/ajae/aar006
- ENNDA. (2019). Areas of coverage. Retrieved May 1, 2020, from http://www.ennda.go.ke/area-of-coverage/
- Ericksen, P., Leeuw, J., Said, M., Silvestri, S., & Zaibet, L. (2012). Mapping ecosystem services in the Ewaso Ng’iro catchment. International Journal of Biodiversity Science, Ecosystem Services & Management, 8(1–2), 122–134. https://doi.org/10.1080/21513732.2011.651487
- Gebrekidan, S. H. (2013). The impact of community managed irrigation on household income and poverty reduction [The Case of Sehartisamre Wereda, Tigray, Ethiopia, Thesis]. MU.
- Gollwitzer, L., & Cloke, J. (2018). Lessons from collective action for the local governance of mini-grids for pro-poor electricity access. LCEDN Briefing Paper 1. LCEDN.
- Gounder, N. (2012). The determinants of household consumption and poverty in Fiji. Discussion Papers: Economics No. 2012-05. Griffith Business School, Griffith University.
- Grimshaw, J., Campbell, M., Eccles, M., & Steen, N. (2000). Experimental and quasi-experimental designs for evaluating guideline implementation strategies. Family Practice, 17(90001), S11–S18. https://doi.org/10.1093/fampra/17.suppl_1.S11
- Gyau, A., Mbugua, M., & Oduol, J. (2016). Determinants of participation in collective action: Evidence from small-holder avocado farmers in Kenya. Journal on Chain and Network Science, 16(2), 147–156. https://doi.org/10.3920/JCNS2015.0011
- Hardin, G. (1968). The tragedy of the commons. Science, 162(3859), 1243–1248.
- Henao, J., & Baanante, C. A. (2006). Agricultural production and soil nutrient mining in Africa. Summary of IFDC Technical Bulletin.
- Johnson, N. L., & Kotz, S. (1970). Distributions in statistics: Continuos univariate distributions (pp. 1).
- Kabubo-Mariara, J., Kirii, D. M., Ndenge, G. K., Kirimi, J., & Gesami, R. K. (2006). Regional and institutional determinants of poverty: The case of Kenya PREM (Poverty Reduction and Environmental Management) Working Paper 06/06. PREM Amsterdam.
- Kadirbeyoğlu, Z., & Özertan, G. (2011). Users’ perceptions of water user associations: Evidence from three cases in Turkey.
- Kiteme, B., & Wiesmann, U. (2015). A grass-roots solution for water governance in Kenya. In A. Ehrensperger, C. Ott, & U. Wiesmann (Eds.), Eastern and South Africa partnership programme: Highlights from 15 years of joint action for sustainable development (pp. 31–34). Center for Development and Environment (CDE), University of Bern, with Bern Open Publishing (BOP).
- Lee, L. F. (1982). Some approaches to the correction of selectivity bias. The Review of Economic Studies, 49(3), 355–372. https://doi.org/10.2307/2297361
- Leuveld, K., Heerink, N. B., & Qu, W. (2010). Does participatory water management contribute to smallholder incomes? Evidence from Minle County, Gansu Province, P.R. China [MSc. Thesis]. Wagningen UR.
- Linke, A. M., Witmer, F. D. W., O’Loughlin, J., McCabe, J. T., & Tir, J. (2018). Drought, local institutional contexts, and support for violence in Kenya. Journal of Conflict Resolution, 62(7), 1544–1578. https://doi.org/10.1177/0022002717698018
- Lokshin, M., & Sajaia, Z. (2004). Maximum likelihood estimation of endogenous switching regression models. The Stata Journal: Promoting Communications on Statistics and Stata, 4(3), 282–289. https://doi.org/10.1177/1536867X0400400306
- McCarthy, N., & Essam, T. (2009). Impact of water user associations on agricultural productivity in chile. Discussion Paper No. 892. IFPRI.
- Meinzen-Dick, R., Knox, A., Place, F., & Swallow, B. (2002). Innovation in natural resource management: The role of property rights and collective action in developing countries. International Food Policy Research Institute, The Johns Hopkins University Press.
- Mogaka, H., Gichere, S., Davis, R., & Hirji, R. (2006). Climate variability and water resources degradation in Kenya: Improving water resources development and management. World Bank Working Paper No. 69.
- Morrissey, J. (2017). The energy challenge in sub-Saharan Africa: A guide for advocates and policy makers: Part 2: Addressing energy poverty. Oxfam Research Backgrounder Series.
- Mukherjee, S., & Benson, T. (2003). The determinants of poverty in Malawi, 1998. World Development, 31(2), 339–358. https://doi.org/10.1016/S0305-750X(02)00191–2
- Mutiga, J. K., Mavengano, S. T., Ahongbo, S., Woldai, T., & Becht, R. (2010). Water allocation as a planning tool to minimize water use conflicts in the Upper Ewaso Ng’iro north basin, Kenya. Water Resources Management, 24(14), 3939–3959. https://doi.org/10.1007/s11269-010-9641-9
- Nakawuka, P., Langan, S., Schmitter, P., & Barron, J. (2018). A review of trends, constraints and opportunities of smallholder irrigation in East Africa. Global Food Security, 17(2018), 196–212. https://doi.org/10.1016/j.gfs.2017.10.003
- Nicklaus, C. (2015). The effect of household income on household consumption in China [Master’s thesis]. Lund University.
- Nikolaou, G., Neocleous, D., Christou, A., Kitta, E., & Katsoulas, N. (2020). Implementing sustainable irrigation in water-scarce regions under the impact of climate change. Agronomy, 10(1120), 1–33. https://doi.org/10.3390/agronomy10081120
- Njiru, C. W., & Letema, S. C. (2018). Energy poverty and its implication on standard of living in Kirinyaga, Kenya. Journal of Energy, 3196567, 1–12. https://doi.org/10.1155/2018/3196567
- Noack, F., & Larsen, A. (2019). The contrasting effects of farm size on farm incomes and food production. Environmental Research Letters, 14(8), 084024. https://doi.org/10.1088/1748-9326/ab2dbf
- Nyanchaga, E. N. (2016). History of water supply and governance in Kenya (1895–2005) lessons and futures. Tampere University Press.
- Oda, H., & Tsujita, Y. (2010). The determinants of rural electrification in Bihar, India. Discussion Paper 254. IDE.
- Ogendi, G. M., & Ong’oa, I. M. (2009). Water policy, accessibility and water ethics in Kenya. Santa Clara Journal of International Law, 7(1), 177–196.
- Olson, M. (1971). The logic of collective action: Public goods and the theory of groups. Harvard University Press.
- Ostrom, E. (1990). Governing the commons: The evolution of institutions for collective action. Cambridge University Press.
- Rao, N. D., & Shonali, P. (2017). Energy access and living standards: Some observations on recent trends. Environmental Research Letters, 12.
- Ratner, B. D., Meinzen-Dick, R., Hellin, J., Mapedza, E., Unruh, J., Veening, W., … Bruch, C. (2017). Addressing conflict through collective action in natural resource management. International Journal of the Commons, 11(2), 877–906. https://doi.org/http://doi.10.18352/ijc.768
- Republic of Kenya. (2010). The constitution of Kenya, 2010.
- Republic of Kenya Ministry of Water and Irrigation The National Water Services Strategy (NWSS). (2015). September, 2007 (pp. 1–38).
- Richards, N., & Syallow, D. (2018). Water resources users associations in the Mara Basin, Kenya: Pitfalls and opportunities for community based natural resources management. Frontiers in Environmental Science, 6, 138. https://doi.org/10.3389/fenvs.2018.00138
- Robins, J., Sued, M., Lei-Gomez, Q., & Rotnitzky, A. (2007). Comment: Performance of double robust estimators when “inverse probability” weights are highly variable. Statistical Science, 544e559.
- Rosenbaum, P. R., & Rubin, D. B. (1983). The central role of the propensity score in observational studies for causal effects. Biometrika, 70(1), 41–55. https://doi.org/10.1093/biomet/70.1.41
- Salazar, C., & Rand, J. (2016). Production risk and adoption of irrigation technology: Evidence from small-scale farmers in Chile. Latin American Economic Review, 25(1), 2. https://doi.org/10.1007/s40503-016-0032-3
- Sanchez, T., & Tozicka, T. (2013). Rural electrification: The role of the public sector and collective action on electricity access for the poor. Energy for all 2030. Practical Action and the European Commission External Cooperation Programmes.
- Scheltema, W. (2002). Smallholder management of irrigation in Kenya. In H. G. Blank, C. M. Mutero, & H. Murray-Rust (Eds.), The changing face of irrigation in Kenya: Opportunities for anticipating change in Eastern and Southern Africa (pp. 171–189). International Water Management Institute.
- Scott, A., & Seth, P. (2013). The political economy of electricity distribution in developing countries: A review of literature. UKAID, Politics and Governance.
- Shiferaw, B., Kebede, T., & Reddy, V. R. (2008, June). Community watershed management in semi-arid India. The state of collective action and its effects on natural resources and livelihoods. CAPRi Working Paper No. 85.
- Speranza, C. I., Kiteme, B., Wiesmann, U., & Jörin, J. (2016). Community-based water development projects, their effectiveness, and options for improvement: Lessons from Laikipia, Kenya. African Geographical Review.
- Suhardiman, D., Nicol, A., & Mapedza, E. (2017). Water governance and collective action. Multi scale challenges. Routledge & GSE Research. Retrieved April 02, 2018, from https://doi.org/10.9774/GLEAF.9781315174938_16
- Swallow, B., Meinzen-Dick, R., & van Noordwijk, M. (2005). Localizing demand and supply of environmental services: Interactions with property rights, collective action and the welfare of the poor. CAPRI Working Paper 42. International Food Policy Research Institute
- Teka, A., & Lee, S. K. (2020). Do agricultural package programs improve the welfare of rural people? Evidence from smallholder farmers in Ethiopia. Agriculture, 10(5), 190. https://doi.org/10.3390/agriculture10050190
- Thomas, V., & Chindarkar, N. (2019). The spectrum of impact evaluations. In Economic evaluation of sustainable development. Palgrave Macmillan.
- Viaggi, D., Zanni, G., & Raggi, M. (2014). Changing perspectives on the economics of water. Water (Switzerland), 6(10), 2969–2977.
- Wangombe, S. W. (2013). Influence of Water Resource Users’ Associations (WRUAs) in water conflict resolution among the communities of Subcatchment 5BE in Meru-Laikipia Counties, Kenya [Masters Thesis]. University of Nairobi.
- Wooldridge, J. M. (2007). Inverse probability weighted estimation for general missing data problems. Journal of Econometrics, 141(2), 1281e1301. https://doi.org/10.1016/j.jeconom.2007.02.002
- Wossen, T., Abdoulaye, T., Alene, A., Haile, M. G., Feleke, S., Olanrewaju, A., & Manyong, V. (2017). Impacts of extension access and cooperative membership on technology adoption and household welfare. Journal of Rural Studies, 54(2017), 223–233. https://doi.org/10.1016/j.jrurstud.2017.06.022
- WRMA and WSTF. (2009). Water resource users association development cycle (WDC). Published by The Water Trust Fund 2009.
Appendix
Table A1. Definition of variables used in the models
Table A2. Falsification test on the validity of the selection instruments