
 ?Mathematical formulae have been encoded as MathML and are displayed in this HTML version using MathJax in order to improve their display. Uncheck the box to turn MathJax off. This feature requires Javascript. Click on a formula to zoom.
Abstract
Crop diversification is a predominantly important coping mechanism for income, production and marketing risks in agriculture. This paper examines the determinants of crop diversification and their gross margins. The study drew a sample of 72 smallholder farmers’ through a multistage sampling technique. The primary data were collected using semi-structured questionnaires and analyzed using descriptive, gross margin, and logistic regression. Gross margin results revealed a significantly higher value of revenues for diversified cropping systems of farming (KES.54, 583.33) compared to non-diversified (KES.37, 250). The factors that influenced crop diversification were age, education of household head, type of crops, cropping system, amount of credit, and irrigation facilities. Based on our findings, the study suggests the need for the Government to promote the development of agricultural policy that supports the shift from non-diversification to crop diversification through developing guaranteed access to inputs and subsidies on farming input resources with priority given to smallholder farmers. Incorporation of both short and long duration crops. Strengthening of extension services with more training services focusing on cropping systems, viable crop enterprises, return from the different types of crops, needs and access to credit and irrigation facilities, and linking farmers to the market through farmers’ group formation.
PUBLIC INTEREST STATEMENT
Crop diversification is a predominantly important coping mechanism for income, production and marketing risks in agriculture. However, there is death of knowledge about the status of crop diversification in Kenya. This study therefore, provides empirical evidence and strategies for strengthening crop diversification amongst the smallholder farmers.
Competing interests
The authors declare no competing interests.
1. Introduction
Kenya is largely an agricultural country. About 80 per cent of Kenya’s population lives in rural areas and depend on agriculture for their livelihoods. Estimations are that 75 per cent of this population are engaged in agricultural activities. The sector contributes up to 26 per cent of the Gross Domestic Product (GDP) (FAO, Citation2020), and it is dominated by smallholders who account for about 75 per cent. Although agriculture is the most important in terms of economic contribution and livelihood generation, its productivity is largely declining in Kenya (FAO, Citation2018). The smallholder farmers continue to suffer largely owing to production and marketing risks. Declining crop productivity impairs societal goals of improving food, income and nutrition security especially in rural areas of Kenya. Such impediments call for immediate measures to ameliorate the situation. Diversification of cropping system is one of the potential strategies in sustaining agricultural productivity, and copping with marketing risks. It is also a transitional step from subsistence to commercial agriculture (Rehima et al., Citation2013). It reduces uncertainties in agricultural productivity and income among smallholder farmers (Feliciano, Citation2019; Joshi et al., Citation2007), production stability and marketing (Makate et al., Citation2016). Empirical findings reveal that those engaged in diversified cropping systems are more likely to experience increased agricultural productivity (FAO, Citation2018), yield stability, nutrition diversity and food security (Mango et al., Citation2018). Behera et al. (Citation2007) and Mehta (Citation2005) observed that crop diversification leads to comparatively high net return from crops, optimization of resource use and high land utilization efficiency. Li et al. (Citation2009) observed that farmers with diversified cropping realized increased yields between 33.2% and 84.7% in Yunnan province of China.
Crop diversification is increasing across the world in favour of more competitive and high-value crops. It has enabled farmers to spread production and income risk; and therefore, reduced livelihood vulnerability to weather or market shocks (FAO, Citation2018; Mango et al., Citation2018). Nguyen (Citation2014) defines crop diversification as the strategy of shifting from less profitable crops, changing of variety and cropping system, increasing exports and competitiveness in both domestic and international markets. Clements et al. (Citation2011) and Feliciano (Citation2019) relates crop diversification to the replacement of low-value commodities by high-value commodities, usually fruits and vegetables for the export market.
The government of Kenya has emphasized on crop diversification and value addition in agriculture. Key areas of policy concern and strategy highlighted in Kenya Vision 2030 include catalyzing enhanced agricultural productivity, food security and income growth through crop diversification. In line with government policy, the county has developed a strategic plan on promoting high-value crop and livestock enterprise (EMC (Elgeyo Marakwet County), Citation2019). In the North Rift region particularly Kamariny Ward, passion fruit, Passiflora edulis has been identified as one of the high-valued fruits (Njeru, Citation2013). The fruit has a lot of potential in income value, it grows well up to 2000 m altitude with an annual rainfall of 900–2000 mm and requires an optimum temperature of 16°C to 30°C and light to heavy loams of medium texture with pH ranging from 5.5 to 6.5 (Farmlink, Citation2017). There is need for smallholder farmers to incorporate passion farming as one of the crops in diversified farming. In spite of the potential benefits of crop diversification as a whole, smallholder farmer participation remains low in Elgeyo Marakwet County.
Sichoongwe et al. (Citation2014), Rehima et al. (Citation2013), Windle and Rolfe (Citation2005), Pitipunya (Citation1995), and Valera et al. (Citation1989), are examples of studies which have made efforts to identify factors influencing diversification in agriculture. Most of these studies identified the role of socioeconomic, demographic and institutional factors in crops diversification. For example, Pitipunya (Citation1995) used the Logit model and found out that education, trade experience, level of information influence farmers cropping pattern in Thailand. In Central Queensland of Australia, Windle and Rolfe (Citation2005) used a multinomial Logit model to analyze determinants of agricultural diversification. The model revealed that age, education level, number of children, off-farm income, farm size, start-up cost, net income, other crops grown and risk time influence agricultural diversification. Using Heckman’s Two-stage model, Rehima et al. (Citation2013) found that age, gender, education and trade experience, extension services and transaction costs influence farmer participation in Southern Nations, Nationalities, and Peoples’ Region (SNNPR), in Ethiopia. A study by Valera et al. (Citation1989) also revealed four determinants influencing crop diversification. They include dry season rainfall, availability of irrigation water, limited irrigation management and inappropriate on-farm irrigation and drainage facilities. In Zambia, Sichoongwe et al. (Citation2014) employed a double-hurdle model to analyze the determinants of crop diversification. The study revealed that the size of landholding, fertilizer quantity, distance to market, and tillage using a plough significantly influence farmers’ probabilities to practice crop diversification. Besides, the extent of crop diversification is significantly influenced by the fertilizer quantity and distance to the market.
There are a number of studies; Mugendi Njeru (Citation2013) and Kiprono (Citation2012) on diversification across Kenya. However, most of them focused much on-farm and off-farm diversification and impacts of crop diversification on food security. There is scarcity of studies focusing on diversification of the cropping system in Kenya. Hence there is death of knowledge about the status of crop diversification, the income differentials as well factors influencing it. This study, therefore, seeks to examine factors influencing farmer participation in diversified cropping system and their gross margins. The results from the study would inform policymakers on the importance of crop diversification in agricultural productivity. The study would also determine factors influencing their participation in diversified cropping system.
2. Methodology
2.1. Theoretical framework
The Binary logistical regression model was used to determine the factors influencing participation in a diversified cropping system. It is preferred to a linear probabilities model because it has more density mass than the Probit model. Additionally, the Logit model is consistent with parameter estimation with the assumption that the error term has a logistic distribution. In this study the dependent variable was the participation in a diversified cropping system where “pi” = 1 if there is participation and 0 otherwise.
Thus the logit model was specified as:
Pi (Yi = 1) is the probability of a smallholder farmer participating in diversified cropping system of farming (dependent variable) and “Zit” are independent variables influencing participation in a diversified cropping system.
2.2. Specification of the empirical model
2.2.1. Binary logit model
The dependent variable was the participation of smallholder farmers in a diversified crop system of farming (Dummy variable takes values of 0 for farmers growing <2 crops and 1 for farmers growing more than 3 crops) while the number of independent explanatory variables were specified as below.
Where is a constant, while
are parameters for independent variables; the age of the farmer, gender, level of education, gender, labour available, cropping systems, crop types, irrigation facilities, farm size and credit facilities, and
represents error term. The study variables and their description are summarized in Table
Table 1. Definition of the study variables and their expected signs
2.2.1.1. Age
In this study, it is expected that elderly farmers have accumulated experience and might participate in diversified farming. Similarly younger farmers will strive to diversify because they are more dynamic and active enough to engage in fruitful farming. Therefore, it is believed that the variable will be positively or negatively associated with crop diversification.
2.2.1.2. Gender
Gender here means either Male or female-headed household. This variable is expected to vary either positively or negatively influencing the participation of crop diversification amongst smallholder farmers due to decisions and preferences of the head of the family. The inequality that exists in accessing and having resources between males and females determines how each household will respond to diversification (Sichoongwe et al., Citation2014).
2.2.1.3. Education
This is a variable which is taken in terms of years of schooling. An educated farmer is more likely to understand the market condition and benefits of different cropping systems (Shahbaz et al., Citation2017). An increase in education level of the farmers is likely to influence their decisions to participate in diversified cropping system positively.
2.2.1.4. Type of crop
The type of crop a farmer will produce is expected to change the probability of participation in crop diversification. More diverse systems are likely to enable farmers capture a combination of agronomic benefits in the soil, such as through phosphorus enhancement and nitrogen fixation. From a range of crops, which contribute to improved yields of maize (Maggio et al., Citation2018). Thus farmers growing one type of crop through mono-cropping will prevent them from participating in crop diversification rather than specialization.
2.2.1.5. Cropping system
This is a dummy variable that takes a value of 1 if the farmer is practising in mono-cropping system and 0 if otherwise. The cropping practice adopted will influence participation in crop diversification considering that a farmer is doing other cropping systems apart from mono-cropping. Hence the farmer will be compelled to grow more than one crop as opposed to specialization.
2.2.1.6. Labour
This is the amount of time designated for carrying out cultivation of crops in the field by the farmer. It is a continuous variable measured in hours or per day. Availability of more family labour induces the farmers to diversify in favour of high-value crops (Kumar et al., Citation2012). In this study, it is expected that the more the labour available the more a farmer will diversify. Hence the variable will positively associate with crop diversification.
2.2.1.7. Land size
Land size refers to a piece of land a farmer holds or allocates for the cultivation of his/her crops. Households with large landholdings are more willing and able to grow a diverse set of crops (Mitchler & Josephson, Citation2017)
2.2.1.8. Irrigation access
Access to irrigation will expedite a farmer to continuously do cultivation throughout the year and consequently engaging in crop diversification. This variable is expected to influence diversification positively.
2.2.1.9. Access to credit
This variable is an attribute of the ability of the farmer to secure financial services, including credit, crop insurance and other management services for better production. The more the farmer gets easier access to credit facilities the more he will put this into productive crop enterprises hence influencing crop diversification. Access to credit promotes the farmer’s potential to acquire more inputs for crop production.
2.2.2. Gross margin analysis
Farm gross margin model is a simple method of comparing the performance of enterprises that have similar requirements for capital and labour. It provides information with an additional planning tool to help evaluate options between different farm activities. Gross margin is the difference between total revenue and variable cost specified as:
GMi is the gross margin, TR is the total revenue (gross output) and TVC is the total variable cost. The gross margin of smallholder farmers participating in a diversified cropping system in Kamariny ward was compared to non-participants to determine the more profitable system in the short run. The use of Gross Margin analysis depends on some assumptions; in this case, all prices used were those prevailing during the production season for each of the crops grown by the farmer.
2.3. Data and sample size
This study adopted a cross-sectional survey design targeting smallholder farmers in Kamariny ward, Elgeyo Marakwet County. Primary data were collected on demographics, socioeconomic characteristics and crops production through structured survey questionnaire and key informant interviews from December 2016 to January 2017. A multistage stratified sampling technique was utilized to choose the study area and collection of data. In the first stage, Keiyo North sub-county was selected purposively as the region is centrally situated in a highland terrain of Elgeyo-Marakwet with a potential for passion fruits cultivation. In the second stage, Kamariny Ward was selected purposively due to its characteristics for mixed cropping systems. In the third step, three locations (Mutei, Irongo and Sergoit) were chosen purposively due to their heterogeneity and crop type variation. Lastly, from each location, three sub-locations were chosen purposively equaling to nine strata for the study area and eight farmers were selected randomly from each stratum. The cumulative sample size for this study area was 72 smallholder farmers.
2.4. Study area
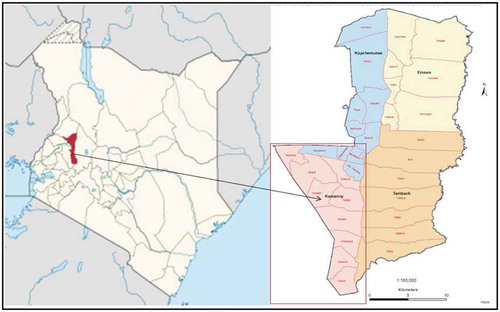
Kamariny ward of Elgeyo Marakwet (Figure ) is located in the highland region of the North Rift valley. It is situated at a latitude and longitude between 0.5248°N to 0.6437°N and 35.5057°E to 35.5924°E respectively. The altitude ranges between 1500 and 2000 meters above the sea level and is characterized by distinct ecological zones of highland, the escarpment and a valley with an annual mean temperature of 18–22oC on the highland and 25–28oC down in the valley. The area receives an annual rainfall of between 700 and 1700 mm. Furthermore, it is agriculturally rich and suitable for the production of potatoes, horticultural crops and cereals. Figure shows the Locations of Kamariny ward.
3. Results and discussion
The socio-economic characteristics of the farmers are presented in Table . The proportion of male (52.8%) farmers was higher than female (47.2%) farmers. On average, 8.3% of the farmers had attained tertiary education, 37.5% secondary school education and 44.4% primary school education while 9.7% did not attend any formal schooling. A considerable percentage of the famers interviewed were over 50 years and it constituted 50% of the sample. Farmers aged between 35 and 50 years were 30.1% of the sample, while below 35 years were relatively few (19.9%). This implies that majority of the farmers have long period of farming, while the relatively few youths are not engaged in agriculture since most of them seek employment in other sectors of the economy.
Table 2. Demographic characteristics of the respondents
Results in Table showed that, majority of the farmers grow maize (36.1%), others grow wheat (16.7%), potatoes (15.3%), beans (12.5%), passion fruits (6.9%), millet (5.6%) and cabbages (4.2%) while 2.8% of the surveyed farmers grow other crops. It was observed that a small percentage (6.9%) of farmers in the study location practice passion fruit farming even though it is one of the high-valued fruits in the region.
Table 3. Types of crops grown by smallholder farmers
Farmers growing one or two types of crops were characterized as non-participants in crop diversification. Those who grow more than three crops deemed to practice crop diversification as shown in Table
Table 4. Characteristics of diversified crop farming and non-diversified crop farming
Approximately 48.3% and 25.6% of the farmers practising diversified and non-diversified owns less than 5 acres of land. The results further showed that 17.2% and 39.5% of the farmers practising diversified and non-diversified farming respectively own above 9 acres of land. These results imply that farmers with relatively small piece of land participate in crops diversification. These findings lend support to earlier studies by Dorsey (Citation1999) who argued out that crop diversification is highly profound in farmers with smaller sizes of the land. Limited access to credit facilities and, poor infrastructure are among the challenges faced by farmers. On average (51.7%) of diversifying farmers accessed credit facilities while the majority (81.4%) of non-diversify farmers had no access to credit facilities.
The study further sought to compare gross-margins between crops grown by smallholder farmers in Kamariny Ward. Table shows the gross margin analysis for different types of crops. Passion fruit farming generates maximum returns of KES 135,700 per acre per season while cabbage, potatoes, beans, wheat, maize and millet enterprises generate a return of KES. 64,150, KES.59, 600, KES.40, 000, KES.36, 550, KES.34, 500 and KES.11, 700 per acre respectively.
Table 5. Gross margins analysis for different types of crops
Passion farming generated higher returns (KES.135, 700 per acre). The millet crop enterprise had the lowest gross-margin (KES.11, 700).This observation was attributed to the use traditional and non-certified seed for planting instead of certified seed which results to low production. One approach to improve the situation is to increase farmers’ awareness on the benefits of using certified seeds and provision of capital access for certified varieties.
Return to capital and labour was also used to determine various aspects of profitability generated from each type of crops grown by farmers. Returns to labour was calculated by dividing the gross margin by the labour costs per acre for each type of crop farming while Return to capital was calculated by dividing gross margin by total variable cost (TVC) per acre. Results are summarized in Table , return to farmers’ capital in cabbage (1.79) was higher than other types of crops grown by farmers while beans, potatoes, passion fruit, maize, wheat, and millet had a return on capital of 1.67, 1.59, 1.52, 1.50, 1.24 and 0.41 respectively. Passion fruit had a lower return on capital (1.52) than cabbage, beans, and potatoes yet it had the highest gross margin (KES. 135,700). High return on capital experience with cabbage, beans, and potatoes farming is due to their low total variable costs as compared to passion fruit (KES. 89,300). Furthermore, these three crops are short season crops while passion is a long season crop. Therefore, total variable costs within the short production season in cabbage, beans, and potatoes were expected to be lower.
Table 6. Returns to capital and labour
Return to labour in cabbage production was (6.32), potatoes (6.14), passion fruits (4.51), wheat (4.46), maize (3.08), beans (2.56) and millet (0.62). Millet was ranked last in both cases of return to capital and labour. This was due to low gross margin (11,700) resulting from low yield through the use of traditional seed selection and also higher labour cost of KES.19, 000 per acre.
Farmers growing more than three crops received maximum returns. A combination of beans, potatoes and cabbage enterprise yielded a total gross-margin of KES.163, 750. This brings to an average gross-margin/acre of KES.54, 583.33 compared to growing one crop such as maize or wheat which generates KES.34, 500 and KES 36,550 per acre respectively (Table ). These results show that farmers can obtain maximum returns through participation in diversified system of farming. It also enables farmers to spread risk in case one of the crop enterprises fails given seasonality and variations in rainfall patterns in Kenya. Table shows the gross margin comparison for diversifying and non-diversifying farmers.
Table 7. Average gross margin comparison for diversifying and non-diversifying farmers
The study showed that non-diversifying farmers growing one or two crops generate lower returns compared to diversifying farmers growing more than three crops on their farms. Finding showed that non-diversifying farmer growing one type of crop (beans) generate (KES. 40,000 per acre) while the same category of farmer growing two types of crops (maize and beans) generate (KES. 34,500 and KES.40,000 per acre respectively, totaling to KES. 74,500 per acre and average gross margin of KES.37,250 per acre). The returns realized from growing one or two types of crops were relatively lesser compared to diversified farming. Diversified crop system of farming yielded a total of KES. 163,750 per acre for the three crops. This is an indication that crop diversification results to higher returns.
The estimated parameter coefficients in the binary logistic model are summarized in Table . The χ2 test statistic of the model was significant at 1% level. The power of prediction of the estimated model was 0.601 which suggested that approximately 60.1% of observations were predicted by the logistic regression model. The variables which significantly influenced farmer participation in crop diversification were; age, type of crops, cropping system, access to credit and irrigation facilities.
Table 8. Logistic model results on factors affecting the choice of crop diversification
The association between age and participation in crop diversification was positive and significant (p < 0.05). This means that the probability of a farmers “participation in crop diversification was more likely to increases with increase in age. It is most likely that as farmers grow old, they acquire knowledge, skills and essential benefits of crop diversifications. These findings concur with those of Gautam and Andersen (Citation2016) who found out that education positively and significantly influenced farmers” participation in crop diversification. Moreover, the estimated likelihood of crop diversification was statistically significant among diversifiers at 5% significant level.
The likelihood of farmers’ participation in crop diversification increases with an increase in farmers’ level of education. Education contributes to increased awareness of varieties of high yielding crops. Besides, it effectively improves the prospects of crop diversification by boosting the ability to absorb new information related to crop diversification and especially the complex art of management of diversified crop systems. These results correlate with previous studies done by Aheibam et al. (Citation2017), Basantaray and Nancharaiah (Citation2017), and Ibrahim et al. (Citation2010) who observed that education significantly and positively influenced farmers’ participation in diversified farming.
The coefficient of crop type was negative and significant (P < 0.05). A shift in the type of crop adopted by farmer tended to diminish the possibility of farmer’s participation in crop diversification by 3.23%. Type of crop might hinder a farmer from engaging in crop diversification. For instance, production of a wheat crop may restrict a farmer to follow specialization through the mono-cropping system hence becoming a disincentive to diversification. Access to credit was found to be negative and significant (P < 0.01). This meant that a change in access to credit facilities by farmers will likely decrease the probability of farmers’ participating in diversification. Most of the farmers in the study area used credit for other purposes other than crop production. Furthermore, the high-interest rate might intimidate farmers from taking a loan, Njuguna and Nyairo (Citation2010).
Availability of irrigation services was found to be significant (P < 0.05) and it negatively influenced farmers participation in crop diversification enterprises. Most farmers relied on rain-fed agriculture as the region receives a steady distribution of rainfall being a high elevation zone. Furthermore, the farmers regarded the expense of irrigation being huge consequently leading to more scattered farmers incapable of adopting irrigation facilities. This is in contrast to earlier findings of Kumar et al. (Citation2012) and Dube and Guveya (Citation2016). The coefficient of the cropping system was found to be statistically significant (P < 0.05) and negatively impact farmer’s participation in crop diversification. The cropping practice adopted by farmer was found to influence the likelihood of participation in crop diversification by 12.34%. The crop diversification in favour of the type of cropping system was declining with the adoption of the mono-cropping system. FAO (Citation2019) state that some alternative staple crops are particularly drought tolerant and thus support the resilience of cropping system in this case since farmers have different objectives (production for subsistence, market or both) cropping system will vary with farmers. Some might have their precise objectives such as mono-cropping practice and mainly concentrate on particular crops, which may narrow the likelihood of crop diversification.
4. Summary, conclusion and recommendation
Crop diversification is a predominantly important coping mechanism for income, production and marketing risks in agriculture. This study examined determinants of crop diversification among smallholder farmers in Kamariny Ward of Elgeyo Marakwet County. Descriptive statistics was used to characterize both diversified and non-diversified smallholder farmers. Diversifying farmers owning below 5 acres were more compared to non-diversifying farmers and farmers with a relatively small portion of land participate in crop diversification. Moreover, a considerable number of diversifying farmers had access to credit facilities and were more inclined to use both mono-cropping, intercropping, crop rotation and mixed cropping as compared to non-diversifying who probable use just the mono-cropping and intercropping practice. Results from the gross margin analysis revealed that smallholder farmers engaging in diversified cropping system have a significantly greater value of incomes as compared to non-diversifying farmers.
It was noticed that a combination of three or more type of crops in cropping generates high revenue. The study also found that farmers’ age, types of crops, cropping system, access to credit and irrigation facilities were important drivers of farmers’ participation in a diversified cropping system. Crop farming still presents a tremendous risk enterprise due to reliance on the rain-fed production system, inadequate market and limited access to irrigation practices amongst smallholder farmers. The existence of homogeneous production pattern followed by the farmers in the region cannot be denied. However, mitigation of this risk requires the incorporation of short and long duration crops, use of water harvest and storage technologies to ensure continuous production, utilization of phased disbursement of credit in form of inputs among other strategies to enhance crop diversification.
The study recommends the following strategies for strengthening crop diversification amongst the smallholder farmers. (i) Agriculture transformative policy strengthening extension services with a special focus on the following; cropping systems, viable crop enterprises, return from the different type of crops, needs and access to credit and irrigation facilities. This will aid in transfers of technology and enable the farmers to define their problems and come up with solutions on the best practical and agronomic methods on crop cultivation. Moreover, capacity building through extension services dramatically augments farmers’ skills and knowledge for performing better in crop production. (ii) Increase and guaranteed access to inputs and subsidies from the government as well as other stakeholders and the priority should be given to farmers owning a small portion of land as they were more inclined to participate in crop diversification. (iii) There is a need for farmers being in the forefront to learn from their progressive farmers. This can be achieved through small group formation amongst farmers region-wise to facilitate skills and experience sharing as well as providing a platform for the bargaining power of their produce.
Additional information
Funding
Notes on contributors
Evans Kemboi
Evans Kemboi is a postgraduate student in Agricultural Sciences, College of Post Graduate Studies in Agricultural Sciences, Umiam, Meghalaya, India. His research interest includes themes on agribusiness and enterprise development, crops diversification, rural development.
Kavoi Muendo
Kavoi Muendo (PhD) is an Associate Professor of Agriculture Economics at Department of Agricultural and Resource Economics, Jomo Kenyatta University of Agriculture and Technology. His research interest is on agriculture, food security and agriculture value chains in Arid and Semi-Arid Lands.
Collins Kiprotich
Collins Kiprotich, holds a Master of Science in Agricultural and Applied Economics with special focus on agriculture value chains in Arid and Semi-Arid Lands. His research interest includes themes on food security and food systems, productivity and efficiency of crop, agriculture value chains, technology adoption and agricultural marketing.
References
- Adjimoti, G. O., & Kwadzo, G. T. M. (2018). Crop diversification and household food security status: Evidence from rural Benin. Agriculture & Food Security, 7(1), 82. https://doi.org/10.1186/s40066-018-0233-x
- Aheibam, M., Singh, R., Feroze, S. M., Singh, N. U., Singh, R. J., & Singh, A. K. (2017). Identifying the determinants and extent of crop diversification at household level: An evidence from Ukhrul District, Manipur. Economic Affairs, 62(1), 89. https://doi.org/10.5958/0976-4666.2017.00031.6
- Basantaray, A. K., & Nancharaiah, G. (2017). Relationship between crop diversification and farm income in Odisha — An empirical analysis. Agricultural Economics Research Review, 30(conf), 45. https://doi.org/10.5958/0974-0279.2017.00021.0
- Behera, U. K., Sharma, A. R., & Mahapatra, I. C. (2007). Crop diversification for efficient resource management in India: Problems, prospects, and policy. Journal of Sustainable Agriculture, 30(3), 97–13. https://doi.org/10.1300/J064v30n03_08
- Benin, S., Smale, M., Gebremedhin, B., Pender, J., & Ehui, S. (2004). The determinants of cereal crop diversity on farms in the Ethiopian highlands. Contributed paper for the 25th International Conference of Agricultural Economists. Durban, South Africa.
- Clements, R., Haggar, J., Quezada, A., & Torres, J. (2011). Technologies for climate change adaptation: Agriculturalsector. https://backend.orbit.dtu.dk/ws/portalfiles/portal/5706575/Technologies_for_Climate_Change_Adaptation_Agriculture_sector.pdf.
- Dorsey, B. (1999). Agricultural intensification diversification and commercial production among smallholder coffee growers in central Kenya. Economic Geography, 175–190.
- Dube, L., & Guveya, E. (2016). Factors influencing smallholder crop diversification: A case study of Manicaland and Masvingo Provinces in Zimbabwe. International Journal of Regional Development, 3(2), 1–25. https://doi.org/10.5296/ijrd.v3i2.9194
- EMC (Elgeyo Marakwet County). (2019). County integrated development plan (CIDP) 2018–2022. Retrieved December 20, 2019, from https://elgeyomarakwet.go.ke/wp-content/uploads/bsk-pdf
- FAO. (2018). Crop diversification increases productivity and stabilizes income of smallholders. www.fao.org/3/CA1562EN/CA1562EN.pdf
- FAO. (2019). Cropping systems diversification to enhance productivity and adaptation to climate change in Zambia. Economic and policy analysis of climate change. Agricultural Development Economics Division (ESA), FAO. Retrieved December 20, 2019 from http://www.fao.org/3/CA2572EN/ca2572en.pdf
- FAO. (2020). Kenya at a glance. Retrieved January 01, 2020, from http://www.fao.org/kenya/fao-in-kenya/kenya-at-a-glance/en/
- Farmlink. (2017). Passion fruit farming in Kenya. Retrieved November 18, 2019, from http://www.farmlinkkenya.com/passion-fruit-farming/
- Feliciano, D. (2019). A review on the contribution of crop diversification to sustainable development goal 1“no poverty” in different world regions. Sustainable Development, 27(4), 795–808. https://doi.org/10.1002/sd.1923.
- Gautam, Y., & Andersen, P. (2016). Rural livelihood diversification and household well-being: Insights from Humla, Nepal. Journal of Rural Studies, 44, 239–249. https://doi.org/10.1016/j.jrurstud.2016.02.001
- Ibrahim, H., Rahman, S., Envulus, E., & Oyewole, S. (2010). Income and crop diversification among farming households in a rural area of north central Nigeria. Agro-Science, 8(2), 84–89. https://doi.org/10.4314/as.v8i2.51102
- IEBC (Independent Electoral and Boundaries Commission). (2017). Keiyo North constituency, County assembly wards. Retrieved June 04, 2017 from https://softkenya.com/wp-content/uploads/2017/04/Keiyo-North-Contituency-Map1.png
- Joshi, P., Gulati, A., Jr, & R., C. (2007). Agricultural diversification in South Asia: Beyond food security. Agricultural Diversification and Smallholders in South Asian. 47–81. Retrieved November 18, 2019, from http://www.ifpri.org/sites/default/files/pubs/pubs/otherpubs/agdiversesach02.pdf.
- Kiprono, R. B. (2012). Contribution of on-farm diversification to incomes of smallholder farmers in Konoin District, Bomet County [PhD. Thesis submitted to Egerton University].
- Kumar, A., Kumar, P., & Sharma, A. N. (2012). Crop diversification in Eastern India: Status and determinants. Indian Journal of Agricultural Economics, 67(902–2016–66732).
- Li, C., He, X., Zhu, S., Zhou, H., Wang, Y., Li, Y., Zhu, Y., Yang, J., Wang, G., Long, Y., Xu, J., Tang, Y., Zhao, G., Yang, J., Liu, L., Sun, Y., Xie, Y., Wang, H., Zhu, Y., & Yang, J. (2009). Crop diversity for yield increase. PLoS ONE, 4(11), 0–5.: e8049. https://doi.org/doi:10.1371/journal.pone.0008049.
- Maggio, G., Sitko, N. J., & Ignaciuk, A. (2018). Cropping system diversification in Eastern and Southern Africa: Identifying policy options to enhance productivity and build resilience.
- Makate, C., Wang, R., Makate, M., & Mango, N. (2016). Crop diversification and livelihoods of smallholder farmers in Zimbabwe: Adaptive management for environmental change. SpringerPlus, 5(1), 1. https://doi.org/10.1186/s40064-016-2802-4
- Mango, N., Makate, C., Mapemba, L., & Sopo, M. (2018). The role of crop diversification in improving household food security in central Malawi. Agriculture and Food Security, 7(1), 1–10. https://doi.org/10.1186/s40066-018-0160-x
- Mehta, R. (2005, March 22-23). An analysis of crop diversification. National Conference on Agriculture for Kharif Campaign-2005.
- Mitchler, J. D., & Josephson, A. L. (2017). To specialize or diversity: Agricultural diversity and poverty dynamics in Ethiopia. World Development, 89, 214–226. https://doi.org/10.1016/j.worlddev.2016.08.011
- Mugendi Njeru, E. (2013). Crop diversification: A potential strategy to mitigate food insecurity by smallholders in sub-Saharan Africa. Journal of Agriculture, Food Systems, and Community Development, 3(4), 63–69. https://doi.org/http://dx.doi.10.5304/jafscd.2013.034.006
- Nanher, A. H., Shamin, S. A., Tyagi, S., Singh, K. A., & Yadav, S. (2015). Need of diversification of cropping system in India.
- Nguyen, H. Q. (2014). Crop diversification, economic performance and household’s behaviours: Evidence from Vietnam. SSRN Electronic Journal, 1–25.
- Njeru, J. W. W. (2013). An evaluation of access to information on passion fruit production by farmers in Keiyo North District, Kenya. M.Sc. Thesis submitted to University of Nairobi.
- Njuguna, E., & Nyairo, N. (2010). Formal conditions that affect agricultural credit supply to small-scale farmers in rural Kenya: Case study of Kiambu County. International Journal of Sciences Basic and Applied Research, 20(2), 59–66.
- Ojo, M. A., Ojo, A. O., Odine, A. I., & Ogaji, A. (2014). Determinants of crop diversification among small–scale food crop farmers in north central, Nigeria. Production Agriculture and Technology Journal, 10(2), 1–11.
- Pitipunya, R. (1995). The economics of rice farming and crop diversification in central plain.
- Rehima, M., Belay, K., Dawit, A., & Rashid, S. (2013). Factors affecting farmers ’ crops d iversification: Evidence from SNNPR, Ethiopia. Internationa Journal of Agricultural Sciences, 3(6), 558–565.
- Shahbaz, P., Boz, I., & Haq, S. U. (2017). Determinants of crop diversification in mixed cropping zone of Punjab Pakistan. Direct Research Journal Agricultural Food Science, 5(11), 360–366.
- Sichoongwe, K., Mapemba, L., Tembo, G., & Ng, D. (2014). The determinants and extent of crop diversification among smallholder farmers : A case study of Southern Province Zambia. International Food Policy Research Institute, 6(11), 150–159. https://doi.org/10.5539/jas.v6n11p150
- Valera, A., Cablayan, D., & Elegado, J. (1989). Irrigation management for diversified crops: Opportunities for learning and improvement. In Crop Diversification in Irrigated Agriculture in the Philippines: Proceedingsof a National WorKESop, 5–7 October 1988, Puerto Azul Beach and Country Club, Ternate (p. 20). Cavite, the Philippines: International Irrigation Management Institute.
- Vernooy, R. (2015). Effective implementation of crop diversification strategies for Cambodia, Lao PDR and Vietnam: Insights from past experiences and ideas for new research. In Bioversity international.
- Windle, J., & Rolfe, J. (2005). Diversification choices in agriculture: A choice modeling case study of sugarcane growers. Australian Journal of Agricultural Research Economics, 49(1), 63–74. https://doi.org/10.1111/j.1467-8489.2005.00279.x