
 ?Mathematical formulae have been encoded as MathML and are displayed in this HTML version using MathJax in order to improve their display. Uncheck the box to turn MathJax off. This feature requires Javascript. Click on a formula to zoom.
Abstract
The Ethiopian cereal, tef, is a healthy food stuff for the people, and most preferred and palatable feed stuff for livestock. Evaluation of performance of genotypes at a number of locations provides useful information to determine their adaptation and stability. The objectives of the study were to estimate the magnitude of genotype-environment interaction (G × E), to determine its effects, and to identify stable tef genotypes. In the study, twelve genotypes of tef were evaluated in seven environments in the Northeast part of Ethiopia. The result showed that effects of genotype, environment and the G × E were significant and explained 5.08%, 82.67% and 12.25% of the treatment variance signifying that environment was the predominant contributor of the variation. The AMMI analysis showed that five of the IPCAs were significant. The first two, being very important, explained 66.04% and 20.35% of the G × E variance, respectively. The AMMI2 biplot showed that genotypes 202416A, 202382A and 205958 were not affected by environmental fluctuations as they had minimum interaction. The GGE analysis showed that 50.12% and 33.47% of the GGE variance were captured by the first and the second IPCAs, respectively. Based on the stability statistics considered, the genotypes 205953 and 202416A could be recommended as desirable (high yielding and stable) genotypes on the locations (environments) under study; both can be used as parents for future tef crossing programs.
PUBLIC INTEREST STATEMENT
Tef (Eragrostis tef [Zucc.] Trotter) is a small-seeded cereal crop which is originated in Ethiopia. It is a C4 plant adapted to various climatic conditions, different altitudinal ranges and soil types. It tolerates drought, and insect attack under storage conditions. The grain is used for food and preparation of local beverages. Tef grains are rich in minerals, and are free from gluten; which makes tef preferred food stuff for celiac disease patients. Tef straw is the most preferred and palatable animal feed more than any other cereal straw.
The productivity of tef is about 1.76 t ha−1 under farmers’ condition. To select better genotypes, tef lines were evaluated on multilocation for two years in the drylands of Northeastern part of Ethiopia. As a result, stable tef genotypes were identified.
1. Introduction
Tef (Eragrostis tef [Zucc.] Trotter) is a small-seeded cereal crop which is originated and diversified in Ethiopia (Vavilov, Citation1951). It is adapted to various climatic conditions, different altitudinal ranges and soil types (Kebebew et al., Citation1999). It tolerates drought, water lodging, and insect attack under storage conditions (Ketema, Citation1993). It has a multitude of uses where the grain is used for food, and preparation of local beverages (Ebba, Citation1969). Tef grains are rich in minerals, especially iron (Abebe et al., Citation2007; Kibatu et al., Citation2017; Mengesha & Guard, Citation1966) and are free from gluten (Spaenij-Dekking et al., Citation2005); these qualities make tef preferred food stuff for celiac disease patients.
Tef straw is used as livestock feed, construction of traditional houses and granaries. The straw is the most preferred and palatable animal feed more than any other cereal straw, and has comparable nutritive value, in some cases better nutritive value, than the traditional forage crops (Miller, Citation2010). As a forage crop, in USA, tef can be grown in mixture with alfalfa (Norberg et al., Citation2005); it can also be used as a rotational crop for alfalfa (Hunter et al., Citation2007). Tef can regrow when harvested at a shorter height quicker than other grasses which allow production of additional forage (Griggs et al., Citation2008).
Being the first preference of Ethiopians for food, and livestock for feed, it fetches premium prices on market (Ketema, Citation1993). Although tef has a number of advantages, its grain yield potential is very low owing to different genetic and environmental factors. However, yield of tef has increased from 0.895 t ha−1 in 2001/02 to 1.56 t ha−1 in 2015/16 (Cochrane & Bekele, Citation2018), probably due to the use of improved varieties and management practices; currently, 1.76 t ha−1 grain yield has been reported (CSA (Central Statistical Authority), Citation2019).
Evaluation of genotypes at a number of locations provides useful information to determine their adaptation and stability (Crossa et al., Citation1990) as the performance of genotypes often varies from location to location. The basic cause of differences between genotype in their yield stability is the wide occurrence of genotype-environment interaction (Becker & Leon, Citation1988) which is dependence of the ranking of genotypes to particular environmental conditions (Becker & Leon, Citation1988; Malosetti et al., Citation2013). Identifying stable genotypes across environments can reduce the effects of G × E (Eberhart & Russell, Citation1966).
A few workers have studied G × E and stability on tef (Ashamo & Belay, Citation2012; Jifar et al., Citation2019; Nigus et al., Citation2020; Worede, Citation2020) in different parts of Ethiopia, but the information generated so far is not adequate.
Both parametric and nonparametric statistics could be employed while studying stability of genotypes across environments. Some assumptions have to be made about distribution and homogeneity of variance while using parametric stability statistics; however, nonparametric stability measures are distribution-free and are not affected by outliers (Nassar & Huehn, Citation1987).
For each genotype, static stability coefficient is defined as the variance between its means in the various environments, it provides a measure of the consistency of the genotype (Becker & Leon, Citation1988). A stability measure which is the genotype-environment interaction effects for each genotype, squared and summed across the test environments is termed as ecovalence (Wi) by Wricke (Citation1962). A low value indicates that the genotype responds in a consistent manner to changes in environment. Cultivar superiority performance measure of Lin and Binns (Citation1988) is the sum of the squares of the differences between its mean in each environment and the mean of the best genotype, divided by twice the number of environments. Non-parametric statistics of stability such as mean and variance of the ranks of each genotype across the environments, and absolute differences of pairs of ranks have also been suggested by Nassar and Huehn (Citation1987) and used by many researchers. For each genotype, this is the sum of the absolute differences between its ranks in all the pairs of environments where it occurs. The objectives of this study were to estimate the magnitude of variance associated with genotype-environment interaction and to determine its effects, and to identify stable tef genotypes in Northeast Ethiopia.
2. Materials and methods
The trials were conducted at four sites of Sirinka Agricultural Research Center: Sirinka, Kobo, Mersa and Chefa in 2002 and 2003 main cropping season. The geographic, climatic and edaphic descriptions of the experimental sites are depicted in Tables and . In 2002, the trial was planted at all sites; while in 2003, the trial at Kobo was lost as a result of moisture stress, as a result data were collected from the other three locations.
Table 1. The geographic and climatic descriptions of the study areas
Table 2. Physico-chemical properties of soils of the experimental sites
A total of 98 landrace populations of tef were brought from Ethiopian Biodiversity Institute (EBI), the then Institute of Biodiversity Conservation (IBC). All of the populations were collections of Northern part of Ethiopia, Wollo. In the area, a great deal of variability of tef landraces has been reported (Worede, Citation2017). Ten advanced pure-lines promoted from nurseries and preliminary variety trials, together with two checks were used in the study; DZ-01-1281 (Standard check) and a farmer’s variety (local check), were included for comparison. A randomized complete block design was used with three replications. Plot area was 2 m × 2 m, and 1 m and 2 m space were left between plots and blocks, respectively.
Planting was done in mid-July when the soil moisture is good enough to grow tef seeds. Seeds were broadcasted on 4 m2 plot of land at the rate of 30 kg ha−1 (12 g for each plot), as per Ketema (Citation1993), and properly pressed (trampled) to facilitate better contact of the seed with the soil. Based on the recommendation of Amhara Bureau of Agriculture, fertilizer was applied at the rate of 41 kg ha−1 N and 46 kg ha−1 P2O5 at planting. Plots were weeded thrice at different growth stages uniformly. Pesticides were not applied. Harvesting was done at physiological maturity when the straw turned yellow (after 66 days, depending on variety and location). Grain yield Data were collected on whole plot basis.
The Additive Main-effect and Multiplicative Interaction (AMMI) analysis were performed using the model suggested by Crossa et al. (Citation1990). Genotype plus genotype-environment interaction (GGE) was based on Yan et al. (2000). AMMI Stability Value (ASV) was computed using the formula developed by Purchase et al. (Citation2000). Spearman’s coefficient of rank correlation (rs) was determined as per Steel and Torrie (Citation1980). Analysis of variance for the data combined across locations and over years, AMMI, GGE and the stability analyses were computed by using GenStat (16th ed.) software.
3. Results and discussion
3.1. AMMI analysis
The AMMI analysis of variance showed that the genotypes (G), environments (E) and the interaction (G × E) were significant (Table ); implying that these three terms affect grain yield of tef. The result agrees with the previous findings of Ashamo and Belay (Citation2012) and Jifar et al. (Citation2019) in tef. The G, E and the G × E were also explained 5.08%, 82.67% and 12.25% of the treatment sum of squares (SS) signifying that environment was the predominant contributor of the variation. In agreement with the present finding, 4.3%, 79.7% and 16% variation in grain yield due to genotypes, environments and G × E effects, respectively, was reported (Jifar et al., Citation2019). Similarly, Nigus et al. (Citation2020) also reported higher contribution of the environment followed by the G × E effect.
Table 3. ANOVA table for AMMI model
The AMMI analysis showed that the best fit model was high-level AMMI in this experiment, as five of the IPCAs were significant (Table ). The G × E was partitioned into five significant IPCAs; the first two being very important and explained 66.04% and 20.35% of the G × E variance, respectively. The finding agrees with Jifar et al. (Citation2019) who reported 72.5% (IPCA1 = 53.04% and IPCA2 = 19.49%) of the total variation to be captured by the first and second IPCAs. Ashamo and Belay (Citation2012) reported 49% of the G × E variance to be captured by the first significant (p < 0.05) IPCA.
When the grand mean grain yields of the seven environments were compared, SRK02 was the highest yielding (4.142 t ha−1) environment; conversely, CHF02 was the lowest yielding (1.082 t ha−1) environment (Table ). In line with this, Jifar et al. (Citation2019) reported environmental mean grain yield ranging from 1.7 t ha−1 to 4.29 t ha−1 with a mean of 2.89 t ha−1; and Nigus et al. (Citation2020) observed environment mean of grain yield varying from 0.821 t ha−1 to 2.439 t ha−1. Genotypes 205953 and 202416A were the highest yielding genotypes at the highest and lowest yielding environments with mean yields of 4.142 and 1.292 t ha−1, respectively (Table ); these genotypes even had equal grain yield (1.417 t ha−1) at SRK03. On the other hand, genotype mean grain yield across environments ranged from 1.619 for 202424A to 2.236 t ha−1 for 205953. The range was a little bit lower than the one reported by Jifar et al. (Citation2019) but higher than that of Nigus et al. (Citation2020).
Table 4. Mean grain yield () of the 12 tef genotypes across seven environments
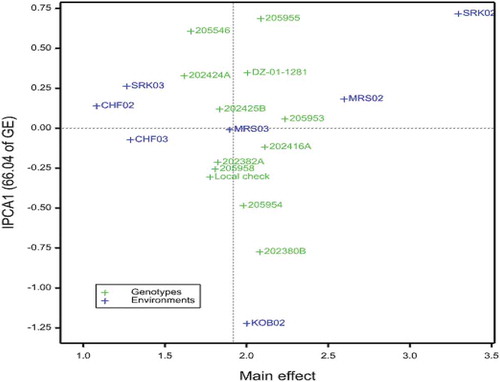
The IPCA scores of genotypes in the AMMI analysis indicate the stability or adaptation over environments (Gauch & Zobel, 1996). Minimum (near zero) IPCA scores mean that the genotypes are stable or adapted to all the environments considered. Genotypes 202380B, 205955, 205546, 205954 had higher level of interaction indicating that these genotypes are specifically adapted to some of the environments. However, 205953, 202416A and 202425B had minimum interaction signifying the wide adaptation of these genotypes to all the environments.
Likewise, environments KOB02 and SRK02 had exerted higher interaction to the GxE variance; whereas MRS03 and CHF03 had minimum interaction (Figure ).
Figure 1. AMMI biplot of main effects of tef genotypes and environments, and IPCA1. CHF02 = Chefa 2002, CHF03 = Chefa 2003, KOB02 = Kobo 2002, MRS02 = Mersa 2002, MRS03 = Mersa 2003, SRK02 = Sirinka 2002, SRK03 = Sirinka 2003
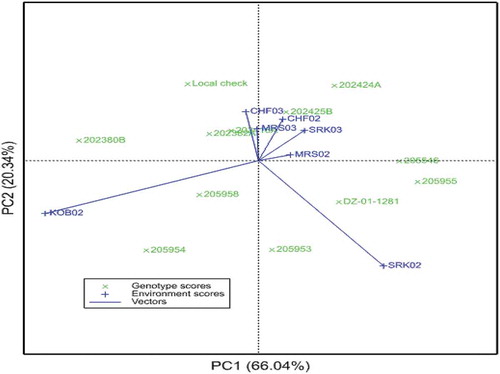
In the AMMI2 biplot (Figure ), the length of the spokes of the environments and the genotypes from the origin indicates the magnitude of interaction exerted by the environment and the responsiveness of the genotypes, respectively (Fan et al., Citation2001; Purchase et al., Citation2000). The AMMI2 biplot in the present investigation showed that the genotypes 202416A, 202382A and 205958 were not affected by environmental fluctuations as they had minimum interaction.
Figure 2. AMMI biplot of tef genotypes and environments plotted against PCA1 and PCA2. CHF02 = Chefa 2002, CHF03 = Chefa 2003, KOB02 = Kobo 2002, MRS02 = Mersa 2002, MRS03 = Mersa 2003, SRK02 = Sirinka 2002, SRK03 = Sirinka 2003
3.2. AMMI stability values
AMMI Stability Values (ASVs) were computed using the first two IPCAs. In effect the ASV is the distance from zero in a two-dimensional scattergram of IPCA1 scores against IPCA2 scores (Purchase et al., Citation2000). The genotype 205953 had the smallest IPCA1 score and the highest IPCA2 score. However, 202380B, 205955 and 205546 had higher IPCA1 score and lower IPCA2 score. Based on ASV, 202416A was the most stable genotype followed by 202425B and 205953 while 202380B was the least stable (Table ). The finding is in harmony with Jifar et al. (Citation2019) who reported ASV ranging from 0.01 to 2.73 and recommended three varieties with high grain yield and relatively more stable.
Table 5. Interaction principal component axes and AMMI Stability Values (ASV) of the tef genotypes tested under seven environments
3.3. GGE analysis
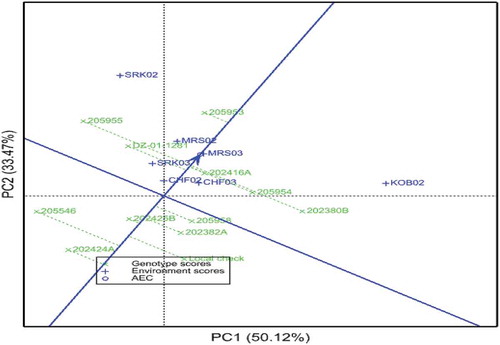
The GGE analysis showed that 50.12% and 33.47% of the GGE variance were captured by the first and the second IPSAs, respectively (Figure ), which agrees with the findings of Nigus et al. (Citation2020) who reported the first two principal components of the GGE biplot explained 82.58% (Axis1 = 44.23% and Axis2 = 38.35%) of the total variance. The average environment coordinate (AEC) abscissa (the arrowed line) points to higher mean yield, and the line perpendicular to it points to poorer stability in either direction (Yan & Tinker, Citation2006). Accordingly, 202425B was the most stable followed by 202416A and 205953; while 202380B, 205955 were unstable. Equally important, 205953 was the highest yielding genotype followed by 202416A and 205955; the genotypes 205953 and 202416A, therefore, are high-yielding and stable genotypes. Conversely, 202424A was the poorest in terms of grain yield. Nigus et al. (Citation2020) identified two high yielding and stable genotypes by using GGE analysis.
Figure 3. The average-environment coordination view showing the mean performance and stability of the 12 tef genotypes. CHF02 = Chefa 2002, CHF03 = Chefa 2003, KOB02 = Kobo 2002, MRS02 = Mersa 2002, MRS03 = Mersa 2003, SRK02 = Sirinka 2002, SRK03 = Sirinka 2003
3.4. Stability analyses
The estimates of six stability coefficients for the 12 tef genotypes computed based on seven environments (location and year combination) are displayed in Table .
Table 6. Stability coefficients of tef genotypes for grain yield on seven environments
Cultivar superiority: according to (Lin & Binns, Citation1988), genotypes with lower values are expected to be stable. Based on this stability statistic, 205953 was best genotype followed by 202416A and 205954. In contrast, 202424A and 205546 were the least stable as they had comparatively higher values (Table ).
Static stability: A desirable genotype will not react to changing environmental conditions (Becker & Leon, Citation1988). The local check was ranked first followed by 202425B and 202382A, and considered as stable as they had smaller environmental variance. However, 205955 and DZ-01-1281 were unstable.
Wricke’s ecovalence: Ecovalence (Wi) according to Wricke (Citation1962), a genotype with Wi = 0 is considered as stable. In view of that, 202416A, 202382A and 202425B ranked first, second and third, respectively. While 202380B and 205955 were least stable (Table ).
Ranks: The mean and variance of the ranks of each genotype across the environments, and the absolute differences of pairs of ranks were worked out as per Nassar and Hüehn (Citation1987); genotypes with lower values are regarded as stable and those with higher values considered otherwise. Based on mean rank stability coefficients, 205953 ranked first followed by 202416A and 205955; whereas 202424A and 205546 were unstable. According to the means absolute differences of pairs of ranks, 202424A was most stable followed by 205953 and 202416A whereas 202380B and DZ-01-1281 were the least stable genotypes. Variances of ranks identified 202424A, 205953 and 202416A as the first, second and third stable genotypes, respectively; nevertheless, 202380B was the least stable genotype (Table ).
Based on the stability statistics considered so far, the genotypes 205953 and 202416A could be regarded as desirable (high yielding and stable) genotypes on the locations (environments) under study. Similarly, Nigus et al. (Citation2020) recommended two tef genotypes by using different stability parameters.
3.5. Correlation among the stability coefficients
To see the association between the stability parameters, Spearman’s coefficient of rank-order correlation (rs) was determined. Spearman’s correlation of stability statistics showed that Wricke’s ecovalence (Wi) was positively and significantly correlated with means absolute differences of pairs of ranks (MADPR), variances of ranks, IPCA1g and ASV (Table ); these stability statistics may be similar in ranking stability of tef genotypes, and identify more or less similar stable genotypes. In line with the present finding, a number of researchers also reported positive and significant correlation of Wi with MADPR (Farshadfar et al., Citation2012), variance of ranks (Farshadfar et al., Citation2012; Noruzi & Ebadi, Citation2015; Temesgen et al., Citation2015) and ASV (Farshadfar et al., Citation2012; Temesgen et al., Citation2015). In addition, Abate et al. (Citation2015) observed positive and significant correlation of ASV with Wi (0.776**) MADPR (0.635**) and variances of ranks (0.657**). Purchase et al. (Citation2000) and Nigus et al. (Citation2020) reported significant and positive correlation of ASV with Wi in wheat and tef, respectively.
Table 7. Spearman’s rank correlation of different stability coefficients in 12 tef genotypes
Grain yield was positively and significantly correlated with cultivar superiority and mean ranks (Table ). This shows that the use of these two stability statistics in selection of tef would result in development of desirable (stable and high-yielding) tef varieties. In congruence with this result, Noruzi and Ebadi (Citation2015) and Temesgen et al. (Citation2015) observed positive and significant correlation of yield with cultivar superiority in sunflower and faba bean, respectively. In contrast, Abate et al. (Citation2015) demonstrated negative and significant correlation of grain yield with cultivar superiority (−0.965**). Non-significant pairwise rank correlations were detected for cultivar superiority and mean ranks stability measures with the other procedures indicating that these stability statistics differ in stability definition from the others which agrees with the observations of Purchase et al. (Citation2000).
Based on the stability statistics considered so far, the genotypes 205953 and 202416A could be recommended as desirable genotypes on the locations (environments) under study; both can be used as parents for future tef crossing programs. Under verification trial, conducted both on station and on-farm in 2006, farmers evaluated the genotypes and based on grain yield, biomass yield, earliness and seed color, they ranked 205953 first. The genotype 205953 was released as an improved variety by the name Mechare after the approval of the Ethiopian national variety release committee. It is still under production by farmers.
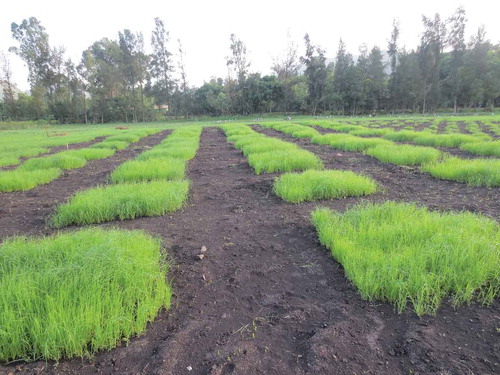
Cover Image
Source: Author.
Acknowledgements
The work was financially supported by Amhara Regional Agricultural Research Institute. The help of Tsegaye Gebremariam and Solomon Mitiku is highly acknowledged.
Additional information
Funding
Notes on contributors
Fisseha Worede
The research group is composed of researchers working on breeding of crops for dry lowland areas. The researchers are working on evaluation and selection of breeding lines adapted to terminal moisture stressed areas. The group has released a number of crop varieties adapted to Northeast part of Ethiopia. Research areas include tolerance to drought, adaptability and stability.
References
- Abate, F., Mekbib, F., & Dessalegn, Y. (2015). Association of different parametric and non parametric stability models in durum wheat (Triticum turgidum Desf.) genotypes. International Journal of Plant & Soil Science, 7(4), 192–15. https://doi.org/10.9734/IJPSS/2015/15568
- Abebe, Y., Bogale, A., Hambidge, K. M., Stoecker, B. J., Bailey, K., & Gibson, R. S. (2007). Phytate, zinc, iron and calcium content of selected raw and prepared foods consumed in rural Sidama, Southern Ethiopia, and implications for bioavailability. Journal of Food Composition and Analysis, 20(3), 161–168. https://doi.org/10.1016/j.jfca.2006.09.003
- Ashamo, M., & Belay, G. (2012). Genotype x environment interaction analysis of tef grown in southern Ethiopia using additive main effects and multiplicative interaction model. Journal of Biology, Agriculture and Healthcare, 2(1), 66–72.
- Assefa, K., Ketema, S., Tefera, H., Nguyen, H. T., Blum, A., Ayele, M., Bai, G., Simane, B., & Kefyalew, T. (1999). Diversity among germplasm lines of the Ethiopian cereal tef [Eragrostis tef (Zucc.) Trotter]. Euphytica, 106(1), 78–97. https://doi.org/10.1023/a:1003582431039
- Becker, H. C., & Leon, J. (1988). Stability analysis in plant breeding. Plant Breeding, 101(1), 11–23. https://doi.org/10.1111/j.1439-0523.1988.tb00261.x
- Black, C. A. (1965). Methods of soil analysis. Part I, American Society of Agronomy.
- Bouyoucous, G. J. (1962). Hydrometer method improved for making particle size analyses of soils 1. Agronomy Journal, 54(5), 464. https://doi.org/10.2134/agronj1962.00021962005400050028x
- Cochrane, L., & Bekele, Y. W. (2018). Average crop yield (2001–2017) in Ethiopia: Trends at national, regional and zonal levels. Data in Brief, 16, 1025–1033. https://doi.org/10.1016/j.dib.2017.12.039
- Crossa, J., Gauch, H. G., Jr., & Zobel, R. W. (1990). Additive main effects and multiplicative interaction analysis of two international maize cultivar trials. Crop Science, 30(3), 493–500. https://doi.org/10.2135/cropsci1990.0011183X003000030003x
- CSA (Central Statistical Authority). (2019). Agricultural Sample Survey 2018/19, Volume I: Report on area and production for major crops (Statistical bulletin 589). Addis Ababa.
- Ebba, T. (1969). Tef (Eragrostis tef) (The Cultivation, usage and some of its known diseases and insect pests. Part I. Expt. Stat. Bull. No. 60). HSIU, College of Agriculture.
- Eberhart, S. A., & Russell, W. A. (1966). Stability parameters for comparing varieties. Crop Science, 6(1), 36–40. https://doi.org/10.2135/cropsci1966.0011183X000600010011x
- Fan, L. J., Hu, B. M., Shi, C. H., & Wu, J. G. (2001). A method of choosing locations based on genotype environment interaction for regional trials of rice. Plant Breeding, 120(2), 139–142. https://doi.org/10.1046/j.1439-0523.2001.00564.x
- Farshadfar, E., Sabaghpour, S. H., & Zali, H. (2012). Comparison of parametric and non-parametric stability statistics for selecting stable chickpea (Cicer arietinum L.) genotypes under diverse environments. AJCS, 6(3), 514–524. http://www.cropj.com/farshadfar_6_3_2012_514_524.pdf
- Griggs, T. C., Drake, D. R., & Parkinson, S. (2008). Production and quality of warm season annual forage grasses. Proceedings, Idaho Alfalfa and Forage Conference, 26-27 Feb, Burley, ID, University of Idaho Cooperative Extension.
- Hunter, M., Barney, P., Kilcer, T., Cherney, J., Lawrence, J., & Ketterings, Q. (2007). Teff as emergency forage. Cornell University Cooperative Extension (Agronomy Fact Sheet Series, FS 24).
- Jifar, H., Assefa, K., Tesfaye, K., Dagne, K., & Tadele, Z. (2019). Genotype-by-environment interaction and stability analysis in grain yield of improved tef (Eragrostis tef) varieties evaluated in Ethiopia. Journal of Experimental Agriculture International, 35(5), 1–13. https://doi.org/10.9734/jeai/2019/v35i530214
- Ketema, S. (1993). Tef (Eragrostis tef): Breeding, genetic resources, agronomy, utilization and role in Ethiopian agriculture. Institute of Agricultural Research, Addis Ababa.
- Kibatu, G., Chacha, R., & Kiende, R. (2017). Determination of major, minor and trace elements in tef using portable total x-ray fluorescence (TXRF) spectrometer. EC Nutrition, 9(1), 51–59.
- Lin, C. S., & Binns, M. R. (1988). A superiority measure of cultivar performance for cultivar x location data. Canadian Journal of Plant Science, 68(1), 193–198. https://doi.org/10.4141/cjps88-018
- Malosetti, M., Ribaut, J.-M., & van Eeuwijk, F. A. (2013). The statistical analysis of multi-environment data: Modeling genotype-by-environment interaction and its genetic basis. Frontiers in Physiology, 4(44), 1–17. https://doi.org/10.3389/fphys.2013.00044
- Mengesha, M. H., & Guard, A. T. (1966). Development of the embryo sac and embryo of teff. Eragrostis Tef. Canadian Journal of Botany, 44(8), 1071–1075. https://doi.org/10.1139/b66-114
- Miller, D. (2010). Teff grass, crop overview and forage production guide, a guide for producers, extension, educators and seed marketers. Producers Choice Seed, 2nd ed. [online]. http://www.producerschoiceseed.com/documents/TeffGrassManagementGuide.pdf23
- Nassar, R., & Huehn, M. (1987). Studies on estimation of phenotypic stability: Test of significance for non-parametric measures of phenotypic stability. Biometrics, 43(1), 45–53. https://doi.org/10.2307/2531947
- Nigus, C., Mariam, Y., Kinfe, H., Melese, B., & Mekonen, A. (2020). Grain yield performance and parametric stability statistics of tef [Eragrostis tef (Zucc) Trotter] genotypes in Tigray, Ethiopia. Agricultural Science, 2(1), 70–82. https://doi.org/10.30560/as.v2n1p70
- Norberg, O. S., Shock, C., Saunders, L., Feibert, E., & Ransom, C. V. (2005). Over seeding teff (Eragrostis tef) into alfalfa (Malheur County Extension Service, Malheur Experiment Station). Oregon State University.
- Noruzi, E., & Ebadi, A. (2015). Comparison of parametric and non-parametric methods for analysing genotype × environment interactions in sunflower (Helianthus annuus L.) inbred lines. Jordan Journal of Agricultural Sciences, 11(4), 959–979.
- Olsen, S. R., Cole, C. V., Watanabe, F. S., & Dean, L. A. (1954). Estimation of available phosphorus in soil by extraction with sodium bicarbonate. USDA, Washington. Circular, 939, 1–19.
- Purchase, J. L., Hatting, H., & van Deventer, C. S. (2000). Genotype × environment interaction of winter wheat (Triticum aestivum L.) in South Africa: II. Stability analysis of yield performance. South African Journal of Plant and Soil, 17(3), 101–107. https://doi.org/10.1080/02571862.2000.10634878
- Spaenij-Dekking, L., Kooy-Winkelaar, Y., & Koning, F. (2005). The Ethiopian cereal tef in celiac disease. New England Journal of Medicine, 353(16), 1748–1749. https://doi.org/10.1056/NEJMc051492
- Steel, R. G., & Torrie, J. H. (1980). Principles and procedures of statistics. McGraw-Hill.
- Temesgen, T., Keneni, G., Sefera, T., & Jarso, M. (2015). Yield stability and relationships among stability parameters in faba bean (Vicia faba L.) genotypes. The Crop Journal, 3(3), 258–268. https://doi.org/10.1016/j.cj.2015.03.004
- Van Reeuwijk, L. P. (1992). Procedures for soil analysis (3rd ed.). International Soil Reference and Information Center (ISRIC).
- Vavilov, N. I. (1951). The origin, variation immunity and breeding of cultivated plants. Roland Press. Translated from the Russian by K. Srarrchester.
- Walkley, A., & Black, A. (1934). An examination of the Degtjareff method for determining soil organic matter and a proposed modification of the chromic acid titration method. Soil Science, 37(1), 29–38. https://doi.org/10.1097/00010694-193401000-00003
- Worede, F. (2017). Multivariate analyses of phenotypic diversity in Northeast Ethiopian tef [Eragrostis tef (Zucc.) Trotter] landrace collections. Abyssinia Journal of Science and Technology, 2(1), 17–24.
- Worede, F. (2020). Genotype-environment interaction and stability of tef [Eragrostis tef (Zucc.) Trotter] varieties in Northeast Ethiopia. Black Sea Journal of Agriculture, 3(4), 239–245.
- Wricke, G. (1962). Method of understanding the biological diversity in field research. Pfianzenzuchtg, 47, 92–146.
- Yan, W., & Tinker, N. A. (2006). Biplot analysis of multi-environment trial data: Principles and applications. Canadian Journal of Plant Science, 86(3), 623–645. https://doi.org/10.4141/P05-169