
Abstract
Genetic variation in cotton is crucial when traits are heritable and elucidation of the underlying genetic components of these helps in selecting elite genotypes. A research was done to determine broad-sense heritability of traits through variance components in different cotton genotypes. The trials were laid out in randomized complete design with three replications. Ten cotton genotypes were used in the study. The results revealed highly significant differences among genotypes on all the characteristics. The experimental lines 917–05-7 had the highest yield (1919 kg/ha), the biggest bolls (6.33 g), produced more lint (853.9 kg/ha), and had taller plants (123.9 cm). Significant genotype by environmental interactions were detected which caused low heritability values, low error variance, and low genotype by environment variances, which allowed easier selection of genotypes. Further partitioning of the genotype by environment effects revealed the most stable and highly performing genotypes and these were 907–05-9 and TN96-05-9 which were concluded to be the best performing cotton lines.
1. Introduction
Cotton (Gossypium hirsutum L.) has been widely cultivated for its fibre world over with little grown for seed (Maheshwari & Kovalchuk, Citation2016). The global production of cotton was 121.30 million bales (218 kg each) in 2019/20 season (USDA, Citation2021). The fibre is used as a raw material for the textile industry and the cotton seed is a vital source of edible oil and livestock feed. The demand of the crop has been on the increase especially with the expansion of the textile industry which has resulted in cotton consumption outstripping supply and hence the need to increase its production (Naeem et al., Citation2014; USDA, Citation2021). Development of a good variety is an important factor for yield improvement in any crop and in cotton utilizing different genetic manipulation and breeding approaches have made cotton production a success even in marginal regions. The information on pre-existing genetic variation of different polygenic characters and the development of new variation based on the known genetic constitution is useful in improving and maintaining higher crop production standard (Naeem et al., Citation2014).
Expression of traits in cotton is often affected by the interactions between the genes and environment. The information of character associations between the traits and within the traits themselves is important for selection of the proper breeding material (Iqbal et al., Citation2006). Some of these characteristics are affected by the genotypic and environmental differences (Camas & Esendal, Citation2006). An estimate of the heritability is a requirement in order to determine the effectiveness of the breeding program (Arslan, Citation2007). The benefit of the genetic differences will not be realised in the succeeding progenies resulting in no genetic gain. Genetic variation in cotton of yield and other contributing components is crucial when it is heritable and elucidation of the underlying genetic components helps in selecting elite genotypes (Sahar et al., Citation2021). According to Rehman et al. (Citation2020), heritability values ranges from medium to high for seed cotton yield and fibre traits.
The genetic variation can be elucidated by the use of variance components, which are important in estimating the contribution of each random effect to the variance of the dependent variable thereby estimating genetic gain (Mackay, Citation2016). In the absence of genotypic information in crop improvement, variance-component estimation can be used to estimate heritability of quantitative traits using trait values (Abney et al., Citation2000). Precise estimation of variance components coupled with accurate selection in cotton breeding is important and can be achieved through use of optimal estimations which will lead to the maximization of genetic gain from selections (Furlani et al., Citation2005). Yield component traits are strongly influenced by dominant effects of genes, while additive-environment interaction effects have certain contribution (Shahzad et al., Citation2019). The principal aim of the study was to determine the influence of genotype by environment interaction on heritability and estimates of variance components for plant height, number of sympodial branches, seed weight, ginning outturn (GOT), boll weight, lint yield and seed cotton yield so as to make informed decisions in selecting the best performing cotton lines under diverse conditions. In addition, the magnitude of genotype by environment interaction of the traits was also studied.
2. Materials and methods
2.1. Experimental location, germplasm, and management
The study was conducted at various testing locations around Zimbabwe from 2017/18 to 2020/21 seasons. These sites used in the study and their general description were as listed below in :
Table 1. Description of sites used in the study
Experimental lines at advanced variety evaluation stage and commercial check varieties were used in the experiment and these were as listed in :
Table 2. List of cotton lines used in the experiment
The agronomic management practices at all sites were done according to the Cotton handbook (CGA, Citation1998). A standard uniform seeding rate of 20 kg/ha was used across all the trials with a seeding depth of 20 mm. Fertilizer nutrient application involved the use of Compound L (5 N:18P2O5:10K2O:8S + 0.1B) as the basal fertilizer and ammonium nitrate (34.5%N) as the top dressing at 8 weeks after crop emergence. Weed management was done using Cotogard WG as the pre-emergence herbicide and Fusion (Fluazifop-P-butyl, Fenoxaprop-P-ethyl) as the post-emergence herbicide coupled with hand weeding where necessary. Pest management was carried out following the threshold method as indicated in the handbook.
3. Experimental design and data description
At each location, trials were established in a randomized complete block design with 10 genotypes as the treatments and replicated three times. The individual gross plot sizes which were used in the experiment were 36 m2 with net plots of 16 m2. Data collection was done on plant height, seed weight, ginning outturn (GOT), boll weight, lint yield, and seed cotton yield. Plant height was measured on 10 plants out of 56 plants in each individual net plot from the ground level to the tip of the plant and averaged to get the plant height for each variety. The number of bolls and sympodial branches of these 10 plants were also counted and averaged. One hundred boll samples were collected from each net plot and ginned with table saw gins to separate fibre and seeds. The seeds were counted and 100 seeds were weighed to get the 100 seed weight index. The ginning outturn (GOT) was calculated by dividing the weight of fibre with the total seed cotton and multiplied by 100 to get the GOT percentage. Lint yield was calculated per hectare using the fibre weight obtained in the net plots as well as the total seed cotton.
4. Data analysis and statistical methods
Analysis of variance was carried out on the collected data using GenStat 18th version statistical package (Geodhart & Thissen, Citation2016). Means that exhibited statistical differences were separated using least significant differences (Fischer’s protected LSD) test at 5% level of significance. The heritability values (H2) and variance components were calculated according to the equations suggested by Comstock and Moll (Citation1963). Heritability is expressed by H2 = Vg/Vp, where H is the heritability estimate, Vg the variation in genotype, and Vp the variation in phenotype
5. Results and discussion
5.1. Genotype mean performance
The analysis of variance showed significant differences among genotypes on all the characteristics as shown in . According to Dhivya et al. (Citation2014), this indicated considerable genetic diversity among the genotypes. The magnitude of variability available in the cotton genotypes for different characteristics is important for selecting the best candidate line. The experimental line 917–05-7 had the highest yield of 1919 kg/ha which was comparable to TN96-05-9 (1758 kg/ha) and the commercial check varieties CRI MS 1 (1752 kg/ha) and SZ9314 (1856 kg/ha). The same genotype produced the biggest bolls (6.33 g) which were statistically similar to GN96(b)-05-8 (6.32 g). 917–05-7 also produced more lint (853.9 kg/ha) which was comparable to the commercial check varieties CRI MS 1 (784.2 kg/ha) and SZ9314 (832.1 kg/ha). GOT% was comparable for all the genotypes except for CRI MS 2 which recorded a low value of 34.49%. Large seeds were obtained in the experimental line 932–05-3 which had 100-seed weight index of 10.99 g which was comparable to 938–05-3 (10.81 g) and CRI MS 1 (10.98 g). The commercial check variety CRI MS 2 had little fuzz linters (5.64) that remained on the seed after ginning compared to the rest of the genotypes. Tall plants were observed in the experimental line 917–05-7 which produced plants that 123.9 cm tall whilst 912–05-1 produced the shortest plants (114.4 cm). These results were also observed by Mukoyi et al. (Citation2018), who detected genetic variation among tested genotypes with experimental lines performing better than the commercial lines. Similarly, Raheel et al. (Citation2017), obtained similar results on field performance of cotton under irrigated conditions which were used as selection basis for high performing cotton lines.
Table 3. Combined analysis of seed cotton yield and agronomic traits of 10 cotton genotypes from 2017/18 to 2020/21 seasons (GenStat 18th version was used)
6. Combined analysis of variance across years by locations and variance components
The homogeneity of variance tests indicated homogeneous error variance for all traits in each of the location by year environments and according to Campbell and Jones (Citation2005), this allowed for a combined across environment analysis (). The analysis of variance (ANOVA) across environments indicated significant variation among genotypes for the traits tested and significant interaction for the overall genotype by environment (GE) for seed cotton yield, lint yield, seed weight index and fuzz grade which justified genotype and genotype by environment (GGE) analysis. This method was observed to be efficient for selecting stable and productive genotypes by Milioli et al. (Citation2018). This greatly influenced the heritability and variance of components of the traits that were studied in this experiment. The results pertaining to variance of components which estimated the contributions of different experimental factors made to the overall variability, as expressed by their variance based on the mean squares according to Mather and Jinks (Citation1971) are also shown in . These were genotypic variance, genotypic by environment variance, phenotypic variance, genotypic coefficient of variation, phenotypic coefficient of variation and heritability in broad sense.
Table 4. Summary of combined analysis of variance components, variance components and heritability estimates of seed cotton yield and agronomic traits of 10 cotton genotypes
Seed cotton yield recorded the highest value for genotypic variance (8146.04) and phenotypic variance (12,728.18) followed by lint yield which had a genotypic variance of 879.97 and phenotypic variance of 2218.44. Fuzz grade exhibited the lowest genotypic variance (0.0027) and phenotypic variance (0.0096). Selection of suitable cotton varieties is hindered by the existence of the large error and GE variance components which are caused by large genotype by environment interactions. In this study, low error and GE variances compared to genetic variances were observed which made selection of genotypes easier (Abbas et al. Citation2008). This situation was also observed on several studies in cotton (Maleia et al., Citation2010; Meredith et al., Citation2012). The co-efficient of genotypic variance (GCV) and phenotypic variance (PCV) were calculated for all the traits that were studied and the GCV ranged from 0.86% (fuzz grade) to 4.98% (lint yield). PCV ranged from 1.34% (plant height) to 7.74% (lint yield). In the study, there was a close similarity between all the traits except for fuzz grade between the GCV and PCV, indicating less environmental influence on these characters. In all the genotypes under study PCV was higher than the GCV for all characters showing the extent environment plays on the expression of all these traits. Similar observations in cotton was reported by Dheva and Potdukhe (Citation2002) where moderate PCV and GCV estimates that were almost close to each other were noticed for plant height, number of sympodia per plant, number of bolls per plant, lint index and seed index.
Heritability was low to moderately high for all the traits except for GOT%, seed weight index, boll weight, seed cotton yield, and plant height, which had values of 0.53,0.57, 0.63, 0.64 and 0.77, respectively. This indicated that these traits were heritable and were mainly controlled by genetic factors with little environmental influence. Lint yield had 0.41 and fuzz grade 0.28 indicating that they were greatly affected by the environment. According to Wray and Visscher (Citation2008), heritability is a tool used to estimate the degree of variation in a phenotypic trait in a population that is attributed to genetic variation among the individuals in that population. A heritability value of 1 indicates no environment effect on variation and a value of 0 mean that all variation in the population comes from differences in the environments experienced by the individuals. In this study, variation in these traits were greatly attributed to environment variations.
7. Genotype by environment interaction analysis
7.1. Ideal genotype
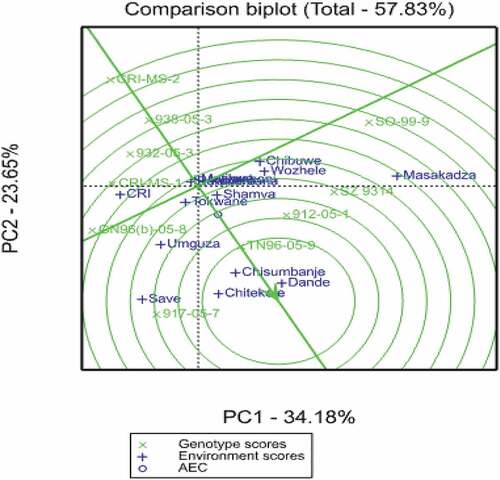
The genotype comparison biplots based on seed cotton yield and lint yield produced a similar pattern of genotype ranking, based on mean yield and stability of these two traits (). This is done to identify the ideal genotype. According to Yan (Citation2002), this genotype has both high mean yield performance with the lowest interaction with the environment. The test genotypes that include TN96-05-9, 917–05-7, SO-99-9, and 912–05-1 with the commercial check variety SZ9314 were above the average environment coordinate; while the rest were below the line (). However, the comparison biplots showed that genotypes TN96-05-9, was closer to the average environment coordinate; followed by 912–05-1 and then 917–05-7 for both seed cotton and lint yield. These were genotypes that had high means and good stability as they were closer to the centre of the concentric circles, which represents the ideal genotype.-
Figure 1. Comparison biplot showing the ideal genotype for different cotton genotypes.
8. Genotype ranking based on mean performance and stability
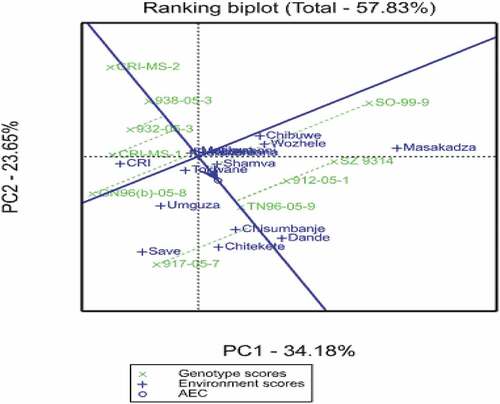
A number of genotypes were above the average environment coordinate ordinate, which included SO-99-9, 917–05-7, SZ9314, and TN96-05-9, which indicated high performance based on seed cotton yield as shown in . The high-ranking experimental genotypes which had shorter perpendicular projected lines was TN96-05-9 followed by 912–01-5 followed by 917–05-7.
Figure 2. Ranking biplot showing the ideal genotype for different cotton genotypes.
9. Which-Won-Where
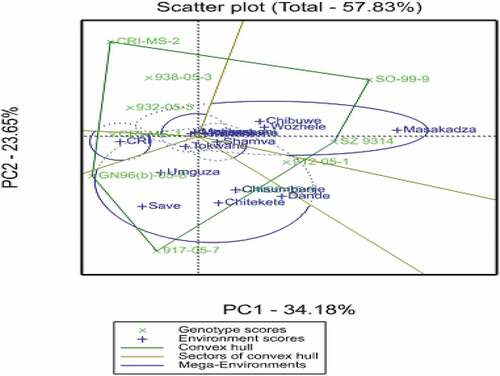
The which-won-where pattern revealed different genotypes that won in different environments (). The environments fell into five different sectors with different winning genotypes suggesting large crossover of GE interaction. Five mega environments were therefore derived by compartmentalizing the target environments. The genotypes that were on the vertices of the polygon included 917–05-7, GN96(b)-05-8, SO-99-9 and the commercial varieties CRI MS 2 and SZ9314. The genotype 917–05-7 won in the sector that was represented by Save, Umguza, Chisumbanje, Chitekete, Dande, and Tokwane whilst GN96(b)-05-8 won in the sector with CRI, Umguza, and Tokwane. The genotype SO-99-9 won in the sector with Chibuwe, Matikwa, and Wozhele. The huge GE crossover posed challenges in recommending varieties for wider adaptation because of several mega environments that were produced. Crossover type GE interaction has been suggested to cause difficulties in variety selection (Bernardo, Citation2002; Yan et al., Citation2000; Yan & Kang, Citation2002). Where a single mega-environment exists, a single breeding program focusing on the entire mega environment is recommended (Mukoyi et al., Citation2018).
Figure 3. Best performing genotypes and mega environments for different cotton genotypes.
10. Conclusion
In this study, it was concluded that genotype by environment greatly impacted on heritability as environmental effects influenced most of the variation in the cotton genotypes. The variance components were also affected by the genotype by environment interaction as low error and genetic by environment variances were observed which made selection of the best cotton genotypes easier. The magnitude of the genotype by environment was partitioned to identify the cotton genotypes, which have high performance and yield stability. These best performing genotypes that were identified in this study across the testing sites based on all the traits under study were TN96-05-9 and 917–05-7. These genotypes had good boll size, GOT%, lint yield, plant height, and seed cotton yield which made them suitable for production in the most of the cotton growing regions of Zimbabwe.
Disclosure statement
No potential conflict of interest was reported by the author(s).
Additional information
Funding
References
- Abbas, A., Ali, M. A., & Khan, T. M. (2008). Studies on gene effects of seed cotton yield and its attributes in five American cotton cultivars. Journal of Agriculture and Social Sciences, 4(4), 147–10 ISSN Print: 1813–2235.
- Abney, M., McPeek, M. S., & Ober, C. (2000). Estimation of variance components of quantitative traits in inbred populations. Ajhg, 66(2), 629–650. https://doi.org/10.1086/302759
- Arslan, B. (2007). Assessing of heritability and variance components of yield and some agronomic traits of different safflower (Carthamus tinctorius L.) cultivars. Asian Journal of Plant Sciences, 6(3), 554–557. https://doi.org/10.3923/ajps.2007.554.557
- Bernado, R. (2002). Breeding for quantitative traits in plants (2nd Edition. ed.). Stemma Press.
- Camas, N., & Esendal, E. (2006). Estimates of broad-sense heritability for seed yield and yield components of safflower (Carthamus tinctorius L.). Hereditas, 143(2006), 55–57. https://doi.org/10.1111/j.2006.0018-0661.01914.x
- Campbell, B. T., & Jones, M. A. (2005). Assessment of genotype × environment interactions for yield and fiber quality in cotton performance trials. Euphytica, 144(1–2), 69–78. https://doi.org/10.1007/s10681-005-4336-7
- CGA. (1998) Cotton . Cotton Ginners Association of Zimbabwe publication.
- Comstock, R. E., & Moll, R. H. (1963). Genotype-environmental interactions. In statistical genetics and breeding. NAS-NSR. Pub, 982, 164–196.
- Dheva, N. G., & Potdukhe, N. R. (2002). Studies on variability and correlations in upland cotton for yield and its components. Journal of Indian Society for Cotton Improvement 4 (2) , 148–152.
- Dhivya, R., Amalabalu, P., Pushpa, R., & Kavhithamani, D. (2014). Variability, heritability and genetic advance in upland cotton (Gossypium hirsutum L.). African Journal of Plant Science, 8(1), 1–5. https://doi.org/10.5897/AJPS2013.1099
- Furlani, R. C. M., de Moraes, M. L. T., de Resende, M. D. V., JuniorFurlani, E., Gonçalves, F.S., Filho, W.V.V., de Paiva, F.R. (2005). Estimation of variance components and prediction of breeding values in rubber tree breeding using the REML/BLUP procedure. Plant Genetics and Molecular Biology, 28((2), 271–276. https://doi.org/10.1590/S1415-47572005000200017
- Geodhart, P. W., & Thissen, J. T. N. M. (2016). Biometris genstat procedure library manual 18th edition. Biometris report 27.01.16. Biometris Procedure Library Manual.
- Iqbal, M., Hayat, R., Khan, R. S. A., Sadiq, A., & Islam, N. (2006). Correlation and path coefficient analysis of earliness and yield traits in cotton (G. hirsutum). Asian Journal of Plant Sciences, 5(2), 341–344. https://doi.org/10.3923/ajps.2006.341.344
- Mackay, T. F. C. (2016). Quantitative genetic variance. Encyclopedia of Evolutionary Biology, Reference Module in Life Sciences, 372–376. https://doi.org/10.1016/B978-0-12-800049-6.00041-X
- Maheshwari, P., & Kovalchuk, I. (2016). Genetic transformation of crops for oil production. Chapter 14, Industrial Oil Crops, 379–412.
- Maleia, M. P., Vidigal Filho, P. S., Kvitschal, M. V., & Vidigal, M. (2010). Stability and adaptability of commercial cotton cultivars (Gossypium hirsutum L. race latifolium H.) in Mozambique. African Journal of Agricultural Reserach, 5 (7), 539–550. .
- Mather, K., & Jinks, J. L. (1971). Biometrical genetics (2nd edn ed.). Chapman and Hall.
- Meredith, W.,sJr, Boykin, D., Bourland, F., Caldwell, W., Campbell, B., Gannaway, J., Glass, K., Phillips-Jones, A., May, L., & Smith, C. (2012). Genotype x environment interactions over seven years for yield, yield components, fiber quality, and gossypol traits in the regional high-quality tests. Journal of Cotton Science, 16 (3), 160–169. http://www.cotton.org/journal/2012-16/3/160.cfm.
- Milioli, A. S., Zdziarski, A., Woyann, L. G., Dos Santos, R., Rosa, A. C., Madureira, A., & Benin, G. (2018). Yield stability and relationships among stability parameters in soybean genotypes across years. Chilean Journal of Agricultural Research, 78(2), 299–309. http://dx.doi.org/10.4067/S0718-58392018000200299
- Mukoyi, F., Gasura, E., & Makunde, G. S. (2018). Implications of correlations and genotype by environment interaction among traits. African Crop Science Journal, 26(2), 219–235. http://dx.doi.org/10.4314/acsj.v26i2.5
- Naeem, M., Ijaz, S., Iqbal, M., Ul-Allah, S., Shareef, Z., & Rana, M. (2014). Genetics of some polygenic traits of upland cotton. Journal of Applied Environmental and Biological Sciences, 4(8S) 380–382 .
- Raheel, M., Zaynab, M., Anwar, M., Hussain, A., Kanwal, S., Bahuder, K., Alvi, A., Ashraf, M. F., Iqbal, Z., & Nadeem, M. (2017). Performance of different genotypes of Gossypium hirsutum L. under various sowing conditions on yield contributing parameters. PSM Biological Research, 2(3), 133–136, ISSN 2517-9586 (Online).
- Rehman, A., Mustafa, N., Du, X., Azhar, M.T. (2020). Heritability and correlation analysis of morphological and yield traits in genetically modified cotton. Journal of Cotton Research, 3(2020), 23. https://doi.org/10.1186/s42397-020-00067-z
- Sahar, A., Zafar, M. M., Razzaq, A., Manan, A., Haroon , M., Sajid, S., Rehman, A., Mo, H., Ashraf, M., Ren, M., Shakeel, A., Yuan, Y. (2021). Genetic variability for yield and fiber related traits in genetically modified cotton. Journal of Cotton Research, 4(19), 1–10. https://doi.org/10.1186/s42397-021-00094-4
- Shahzad, K., Li, X., Qi, T., Guo, L., Tang, H., Zhang, X., Wang, H., Zhang, M., Zhang, B., Qiao, X., Xing, C., Wu, J. (2019). Genetic analysis of yield and fiber quality traits in upland cotton (Gossypium hirsutum L.) cultivated in different ecological regions of China. Journal of Cotton Research, 2 (1) , 14. https://doi.org/10.1186/s42397-019-0031-4
- USDA. (2021). Global cotton consumption outstrips supply: USDA. https://www.graincentral.com/cropping/cotton/global-cotton-consumption-outstrips-supply-usda/
- Wray, N., & Visscher, P. (2008). Estimating trait heritability. Nature Education, 1(1), 29 http://www.nature.com/scitable/topicpage/estimating-trait-heritability-46889.
- Yan, W. (2002). Singular-value partitioning in biplot analysis of multienvironment trial data. Agronomy Journal, 94(5), 990–996. https://doi.org/10.2134/agronj2002.9900.
- Yan, W., Hunt, L. A., Sheng, Q., & Szlavnics, Z. (2000). Cultivar evaluation and mega−environment investigation based on the GGE biplot. Crop Science, 40(3), 597–605. https://doi.org/10.2135/cropsci2000.403597x
- Yan, W., & Kang, M. S. (2002). GGE biplot analysis: A graphical tool for breeders, geneticists, and agronomists. CRC press.