
 ?Mathematical formulae have been encoded as MathML and are displayed in this HTML version using MathJax in order to improve their display. Uncheck the box to turn MathJax off. This feature requires Javascript. Click on a formula to zoom.
Abstract
The rice production in Ethiopia is less than the world’s average due to the lack of varieties with high yield potential. Evaluation of genetic variability is important in the rice breeding program for the production of high yielding varieties. A study was conducted at Pawe Agricultural Research Center in July 2020/21 using 70 genotypes of upland rice (Oryza sativa L.) to evaluate the genetic variability, heritability, and genetic advance among morphological, yield-related and quality parameters. Alpha lattice experimental design with two replications and seven blocks was used. There was a highly significant difference (P < .001) and high diversity among the genotypes for both quantitative and qualitative parameters. The range of genotypic and phenotypic coefficient of variance was 6.1% to 44.51% and 6.5% to 45.81%, respectively. Broad sense heritability was high for all traits. Genetic advance as percent of the mean ranged from 11.02% to 89.07%. For stand count, plant height, productive tillers, filled grain/panicle, thousand grain weight, grain yield, biomass yield and harvest index, high heritability with high genetic advance as percent of the mean were noted. Hence, these traits could be used as selection criteria for indirect selections of genotypes for yield improvement. Based on yield performance and other relevant features, the best genotypes were determined to be G5, G7, G9, G12, G21, and G65. The findings of this study indicated the existence of sufficient variability among the genotypes; hence, there is a high possibility of obtaining promising genotypes for the next breeding programs.
1. Introduction
Rice is considered one of the most important cereals in Ethiopia for its role in achieving food security and national economy through its high yield potential in small area, short growing period, grow well in water logged areas, and served as animal feed (Hegde & Hegde, Citation2013; Negussie & Alemu, Citation2011). Based on productivity, it ranks second following maize (CSA (Central Statistical Agency), Citation2021). In 2020, rice production and area coverage in Ethiopia was 189,649 tons and 62,551 hectare, respectively (FAOSTAT, Citation2022). Ethiopian rice yield (3.34 t/ha) was higher than both Africa and east African productivity, But when compared to the world average, it was lower (FAOSTAT, 2022). Lack of adaptable varieties, stress, climate change, and poor agronomic practices are major limiting factors of rice yield (Belayneh & Tekle, Citation2017). Hence, developing rice varieties with high yield, high quality, and high resistance to stress through conventional breeding system is economically affordable and possible way of crop improvement to increase rice productivity of the country. Beside yield enhancement breeding is primarily done for upgrading of grain quality traits in order to release rice varieties with high and preferable quality. However, the success of selection of superior breeds from segregating population is entirely dependent on the presence of genetic variation, heritability, genetic advance, and selection skill of breeders (Adhikari et al., Citation2018).
Variability results when there is a difference in genetic makeup of individuals of a plant population or due to the change in environment. When there is considerable degree of genetic variation among individuals of breeding material, selection is effective (Sumanth et al., Citation2017). Heritability measures how much of a trait is passed down to subsequent generations while genetic advance demonstrate the difference between the mean genotypic values of the selected population and the original population. Heritability estimates combined with genetic advance are more accurate than heritability alone in predicting the genetic gain under selection. The availability of diverse rice varieties plays an important role in expanding rice production across various agro ecologies. Different researches have been performed to explore the genetic variation for yield and attributing traits. However variability studies for qualitative appearances is limited. Hence, this study was conducted to assess the genetic variability among rice genotypes for yield, yield attributing traits and quality traits to provide promising rice genotypes with desirable qualities for further hybridization programs.
2. Materials and methods
2.1. Description of study area
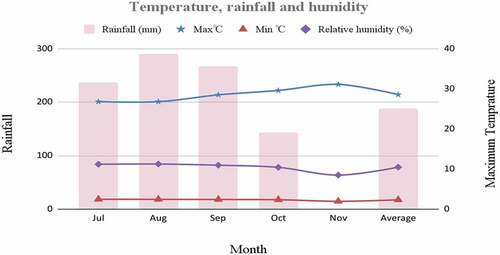
The field experiment was conducted in Pawe Agricultural Research Center (PARC) on station experimental farm (PARC) during summer (Kiremt) season from July to November 2020/21 to assess existence and range of genetic variability among 68 hybrid upland rice genotypes and two check varieties. PARC is found in the Benishangul gumuz region, Pawe woreda, Ethiopia. It has an annual maximum rainfall of 1587 mm while the temperature ranges from 16.3°C to 32.6°C. The major soil types of the station are Nitosols, Vertisols, and Luvisols, and the experiment was laid on Black clay soil (Vertisols; EIAR (Ethiopian Institute of Agricultural Research), Citation2021) as shown in .
Figure 1. Temperature, rainfall, and relative humidity of PARC for 2020/21 cropping season. Source: PARC Meteorology Department.
2.2. Experimental materials
Sixty-eight hybrid upland rice genotypes and two checks (Azemera (check 1) and Pawe-1(check 2)), all obtained from Pawe Agricultural Research Center, were evaluated to assess the genetic variability for yield and related traits in order to identify and provide best performing and potential genotypes for further breeding programs to be used as parental materials for the improvement of yield and yield-related traits (Table ). The genotypes were originally introduced by the International Rice Research Institute (IRRI), Africa Rice, and China. Azemera was used as standard check because it was recently released variety with high grain yield, high biomass yield, early maturity date, good physical quality, and resistance to both biotic and abiotic stress. Similarly, Pawe-1(check 2), even though it has lower yield potential than recently released varieties, it was selected as local check, due to its good tolerance to stress, medium maturity date, and because of the high preference rate of farmers around the study area.
Table 1. List of materials used in the study
2.3. Experimental design and cultural practices
The experiment was conducted using an alpha lattice design with two replications. Each replication contained 68 genotypes and two varieties, distributed over 7 blocks, each having 10 genotypes. The plot size was 1.5 m width × 5 m length (7.5 m2) with 6 rows. The data were collected from the middle four rows and used for data analysis. The spacing between blocks, plots, and rows were 1 m, 0.5 m, and 0.25 m, respectively. Planting was done by drilling with a seed rate of 60 kg/ha. Urea fertilizer was applied at rate of 100 kg/ha (75 g/plot) of nitrogen at three different stages (1/3 at planting time,1/3 at tillering, and1/3at panicle initiation stage). DAP was applied at a rate of 124.5 kg ha-1 (93 g/plot) of P2O5 at planting time. Hand weeding was done three times for all experimental plots, and there was no treatment for disease and pest incidences.
2.4. Data collected
Data on quantitative and qualitative traits (Stand count at emergence, Days to 50% heading, Days to 85% maturity, Plant height, Panicle length, Number of productive tillers, Number of nonproductive tillers, filled grain per panicle, unfilled grain/panicle, biomass yield, grain yield, Thousand grain weight, Harvest index, Panicle shattering, Panicles threshability, Phenotypic acceptance, Grain length, Grain width, and grain shape (mm)) were recorded based on Bioversity International, IRRI and WARDA (Citation2007) and International Rice Research Institute (Citation2013). To determine total nitrogen, the Kjeldahl digestion method (Thiex et al., Citation2002) was used, and from that the grain crude protein content was derived using protein correction factor 5.95 (Jones, Citation1941).
2.5. Data analysis
Analysis of variance (ANOVA) was performed for each measured quantitative trait using statistical analysis software SAS version 9.4 (Statistical Analysis System (SAS), Citation2014) and mean comparison was done following Tukey (HSD) test at 1% level of probability. The Shannon diversity index (Hˈ; Shannon, Citation1948) was used for the diversity analysis of qualitative traits, and the descriptive statistic was done by XL-stat 2018 (Addinsoft, Citation2018). Genotypic variance(σ2g), phenotypic variance(σ2p), phenotypic coefficient of variation (PCV), and Genotypic coefficient of variation (GCV) were calculated based on (Burton & Devane, Citation1953). Broad sense heritability was estimated and categorized following DeLacy et al. (Citation1996) and Robinson et al. (Citation1949), genetic advance and genetic advance as percent of the mean were estimated based on Johnson et al. (Citation1955).
3. Results and discussion
3.1. Analysis of variance
For all studied quantitative traits, the analysis of variance (ANOVA) revealed the presence of highly significant difference (P < .001) among 70 rice genotypes (Table & Appendix Table ), which shows the existence of high and inherent variation among the genotypes for those traits. Therefore, there is high possibility for improvement of yield, yield attributing traits, and quality traits through the selection and hybridization of better parental genotypes. In agreement with this finding, Nikhil et al. (Citation2014), Mulugeta Bitew et al. (Citation2016), Adhikari et al. (Citation2018), Tewachewu et al. (Citation2018), and Brar et al. (Citation2018) reported significant different for the above-mentioned traits.
Table 2. ANOVA Table of 14 quantitative traits of 70 rice genotypes at Pawe
3.2. Shannon diversity index (Hˈ) and Descriptive statistics of qualitative traits
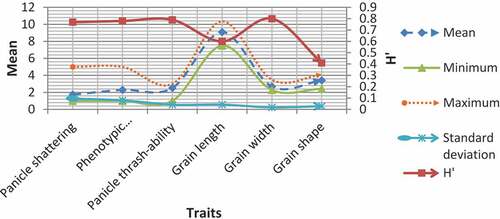
Some of the characteristics that breeders examine as rice quality traits include grain size, width, shape, panicle shattering, panicle threshability, and phenotypic acceptability (Singh et al., Citation2014). The Shannon diversity index among 70 rice genotypes ranged from 0.41 to 0.80 with mean value of 0.69. According to Jamago and Cortes (Citation2012), diversity index which is equal with one considered as maximum, values in range of 0.76 to 0.99 considered as high, values from 0.46 to 0.75 as moderate and from 0.01 to 0.45 as low diversity. From the studied traits, grain width, panicle threshability, phenotypic acceptability, and panicle shattering, recorded the highest diversity value, respectively. While grain length and shape showed moderate and low diversity values, respectively (Figure ). Therefore from this, it is possible to use genotypes as a parent material for the purpose of development of rice genotypes with preferable qualitative traits. Reports supporting this finding were also reported by Hari Ghimire et al. (Citation2020) for shattering; Wangpan et al. (Citation2018) for grain width and Lei et al. (Citation2018) for grain shape.
3.2.1. Panicle shattering and threshability
Seed shattering is a genetically determined feature; however, it could be influenced by environment, management, and their interaction (Maity et al., Citation2021). Rice seed shattering results in a yield loss of 1 to 5% (Maity et al., Citation2021). Hard threshability nature of genotypes keeps more grains on the panicle when threshing, while easy threshability causes shattering before or during harvest, resulting in yield loss in both situations, whereas moderate threshability is effective since it reduces the shattering problem and yield loss due to the attachment of grains to panicle during threshing.
In this study, there were no genotypes with high shattering problems and the range was between 1(<1%shattering) and 5(~15% shattering). While the range for threshability was from 1 (no grain removed) to 3 (>50% of grain removed). About 71.4% of the genotypes were with very low shattering problem while 20% of them were with low and 8.6% were with moderate shattering problems. While for threshability, the proportion was 55.7 %, 41.4%, and 2.9% for easy, intermediate, and difficult threshability nature. High diversity for shattering was also reported by Sow et al. (Citation2014). The degree of shattering that is regarded advantageous depends on the harvesting process; However, if the yielding capacity is great and the harvesting procedure is properly mechanized, genotypes with 3% shattering are typically acceptable. Hence, genotypes which have low shattering problems and intermediate threshability nature could be used in the improvement of high yielding varieties with high shattering and low or difficult threshability problems.
3.2.2. Phenotypic acceptability
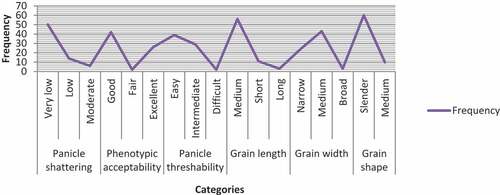
Phenotypic appearance of crops on the field dictates perception of farmers since their preference is based on field observation. The acceptability rate was in range between 1(excellent) and 5(fair). From the total proportion, 37.14% was taken by genotypes with excellent appearance while 60% and 2.9% were taken by genotypes with good and fair phenotypic appearance, respectively (Figure ).
Figure 2. Shannon index value and descriptive statistics of qualitative traits of rice genotypes.
3.2.3. Grain length, width and shape
The grain quality preference depends on the perceptions of the consumers some prefer long slender while others don’t. The grain length was 9.1 mm on average, with a range of 7.5 mm to 10.35 mm. The grain size of the genotypes was divided into three categories: 80% of the genotypes were medium (8.6 mm-10 mm), 15.7% were short (6.1 mm-8.5 mm), and 4.3% were long (>10 mm). The mean grain width was 2.69 mm, with a range of 2.28 mm (Narrow) to 3.5 mm (Broad). About 34.3 % of the genotypes were in the narrow class while, 61.4% and 4.3% were in medium and broad class, respectively. Grain shape had a mean of 3.42, with a range 2.43 mm to 4.1 mm. The ratio also revealed that the majority of the genotypes were homozygous being 85.7% of the genotypes were Slender-shaped (Figure ). Tewachewu et al. (Citation2018), Kumar Maliyappa Rajanna et al. (Citation2011), and Asante et al. (Citation2019) also reported almost similar range and diversity for the above three characteristics.
Figure 3. Categories and frequency of qualitative traits of rice genotypes.
3.3. Mean performance and range values
Looking only the performance of genotypes for yield is not effective to select genotypes which could be used as a parent material for further improvement activities since yield is influenced by different factors. Hence when performing variability activities, it is also recommended to look on the existence of variation for other yield attributing traits such as productive tiller, filled grain, maturity date, biomass yield, thousand grain weight, and plant height in order to use them as indirect selection criteria. As it is mentioned in the methodology part, all the materials were introduced. Hence, prior to this experiment, all genotypes were subjected to quarantine and nursery observation then pass to the preliminary variety trial due to their preferable physical appearance, agronomic traits, and disease and pest resistance. Therefore, in this study, beside the above-mentioned six qualitative traits and grain yield itself, best-performing genotypes were selected and promoted to the next breeding stage using the above-mentioned quantitative traits as a selection criteria.
3.3.1. Heading and maturity days
Genotypes could be classified as earliest (105 days), early (106–119 days), medium (120–135 days), or late maturing (>135 days) genotypes (Tatsushi Tsuboi, Citation1992). The longest days to head at 50% was 110 days (G7) while the earliest was 74 days (G40). Fifty two genotypes took longer days to head than Azemera (85 days) while thirteen genotypes head later than Pawe-1 (100 days). The days taken to attain 85% maturity was in range from 110 days (early maturity) (G66) to 145 days (late maturity) (G7) while the grand mean was 127.5 days. Eight genotypes fall in to late maturing class while 14 genotypes were early maturing and 48 of them were in medium maturing class. Azemera took 123.5 days while Pawe-1 took 132.5 days to reach their 85% maturation (Appendix Table ).
Variation in heading and maturity days may result due to differences in emergence dates. Genotype with the earliest emergence date might have the earliest heading and the quickest maturity duration. However, this is mostly dependent on genotype genetic behavior (some genotypes took 30 days to mature after heading, while others took up to 40 days) and environmental conditions (Harrell et al., Citation2021). In Pawe situation, genotypes with medium heading and maturity dates could be suitable for further breeding purpose and production to minimize growing period of genotypes with high yielding capacity and longest maturity date and minimize yield loss due to environmental stress. While early maturing genotypes could be used for improvement of high yield and late maturing genotypes in water deficit agro ecologies of the country.
3.3.2. Plant height and panicle length
The higher the panicle length the longer the plant height, the lower the panicle number, the lower the filled grain and grain yield. However, this depends on the rice subspecies type (Indica, Japonica, Javanica). From the studied genotypes, the longest plant height was 122 cm by G1 while the shortest was 67.4 cm by G63. There were 15 genotypes which scored higher plant height than Pawe-1 (93.3 cm) while only 3 genotypes scored higher than Azemera (105.4 cm). The range for panicle length was from lowest 16.9 cm (G64) to the longest 24.7 cm (G53). From sixty-eight genotypes, 47 genotypes were with longer panicle than both Azemera (19 cm) and Pawe-1(18.1 cm) while, 12 genotypes scored shortest panicle length than both checks (Appendix Table ). The variation that exists among the genotypes could be due to genetic variability or variation on growth behavior. Taller rice genotypes are mostly susceptible for lodging while short genotypes may submerge in highly water-logged areas and cause yield loss; hence, for the study area, genotypes with intermediate plant height could be suitable for breeding and production purpose. Gyawali et al. (Citation2018) and Wangpan et al. (Citation2018) reported range of 102.04 to 156.91 and 134.1 cm to 191 cm, respectively, for plant height while Kanushree et al. (Citation2020) reported range of panicle length from 21.5 cm to 29.95 cm.
3.3.3. Number of productive tillers
The increase in the number of productive tiller will result in the increment of grain yield (Shankar et al., Citation2021). Low number of productive tillers could be resulted due to competition for assimilates during stem extension (Ambavaram et al., Citation2014). The lowest range of productive tillers was recorded by G46 (20 stand), while the highest was scored for G50 (65 stand). Except G46, G33, and G48, all genotypes were with greater number of productive tillers than Azemera (23 stand) and Pawe-1 (22 stand) (Appendix Table ). Prakash Poudel (Citation2018) reported 97.5 to 266.5 per meter square; Brar et al. (Citation2018) reported 14 to 27 productive tillers per plant.
3.3.4. Filled grain per panicle
In rice, the process of filling the grain depends on two main sources of carbon: assimilates produced during photosynthetic activity and carbohydrates transferred from vegetative tissues to the grain during pre-anthesis (Ambavaram et al., Citation2014). The increase in the number of filled grain could be attributed to the photosynthesis-derived carbohydrates (Zing and zang, Citation2010). For number of filled grain per panicle, the lowest and highest range were 76 grain by G64 and 187 grain by G60. From the studied genotypes, 65 of them scored greater number of filled grain than Pawe-1 (94), and 16 genotypes were greater than Azemera (140). Kanushree et al. (Citation2020) reported range from 55 to 228 of filled grain among 48 germplasm accessions of rice. Osman et al. (Citation2020) found significant difference and range of 4 to 24.5 for 21 rice double haploid lines.
3.3.5. Biomass yield
The highest biomass yield was 27.5 t/ha by G44 while the lowest was 4.56 t/ha by G49. The biomass yield of Azemera was11.4 t/ha which was higher than 23 genotypes while pawe-1s was 14.1 t/ha which was greater than the value of 31 genotypes. Abebe et al. (Citation2017), reported a range biomass from 5.28 t/ha to 11.15 t/ha. The variation in biomass yield could be resulted due to the difference in plant height, panicle length, or number of tillers. The above-mentioned traits strongly influenced by distribution of rainfall, solar radiation, temperature, and relative humidity in which directly affect biomass yield as well. Based on the report of different scholars such as Abebe et al. (Citation2019) and Fentie et al. (Citation2021), biomass yield has a great positive influence in grain yield. Hence, grain yield could be indirectly improved by selection of genotypes with highest biomass yield.
3.3.6. Thousand grain weight and Harvest index
Grain weight is the measure of seed size that directly influence grain yield while harvest index is a measure of reproductive efficiency. For this trait, the lowest and highest range were 11.05 g and 32.8 g, respectively. There was no genotype that had higher grain weight than Pawe-1(32.8 g). However, comparing to Azemera (23.57 g/plot), there were 29 genotypes. Genotype 8 scored the first smallest weight 11.05 g whereas the highest weight next to Pawe-1 was recorded by G46 (28.536). Osundare et al. (Citation2017) reported significant difference and range of 31.7 to 33 among six upland rice varieties. Harvest index % was in range from the lowest 22.54% by G44 to the highest 56.35% by G49. The highest value greater than both Azemera (37%) and Pawe-1 (27.3%) was recorded by 34 genotypes. In agreement to this result, Limbani et al. (Citation2017) found significant difference and range of 6.27 to 59.28 gram per plot among 72 rice genotypes. Both grain weight and harvest index are very essential for variety breeding and indirect selection of these traits is possible alternative for the improvement of grain yield.
3.3.7. Grain yield
It is a complex trait multiplicatively influenced by the nature of genotypes, environment, and the interaction of genotype and environment. It is primarily determined by its component traits; number of panicles (productive tillers), number of grain per panicle, and grain weight (Ambavaram et al., Citation2014). The mean grain yield (kg/ha) was 4817.24 kg/ha while the range was from 2389.41 kg/ha by G48 to 6969.63 kg/ha by G12. From the genotypes included in this study, 46 of them were with higher yield potential than the two checks Azemera (4095.6 kg/ha) and Pawe-1 (3838.4 kg/ha) (Appendix Table ). The observed yield difference could be due to differences in their genetic background for yield that is some genotypes being high yielder than others. The other reason could be difference in sensitivity rate of genotypes for environmental factors. Differences in sensitivity rate cause genotypes to behave differently regarding yield or yield-related morphological traits Mackill et al., Citation1996). Additionally, the yield difference could arise due to the difference in yield-related traits that influence yield directly like filled grain per panicle, thousand grain weight, and productive tillers and/or indirectly like plant height, growing period, seed length, or panicle length (Shankar et al., Citation2021). Abebe et al. (Citation2017) reported a yield range of 2.9 t/ha to 6.8 t/ha among 34 rice genotypes. Tewachewu et al. (Citation2018) reported grain yield range from 4.28 t/ha to 6.76 t/ha among 23 rice genotypes.
3.3.8. Crude protein content
Kawakatsu and Takaiwa () suggested that percentage of protein content of rice is approximately 7%. While Juliano (Citation2016) classified the protein content for three classes: Brown rice (7.1–8.3 g), milled rice (6.3–7.1 g), and rice bran (11.3–14.9 g) of crude protein content. In this study, the grain crude protein concentration was in range between 5.95% (G7) and 8.45% (G35 and G42) while their means was 7.07%. The crude protein percentage of Azemera was 7.6%, while Pawe-1 was 6.5%. Genotypes with high crude protein content could be used for protein content improvement through conventional breeding techniques.
3.4. Estimation of variance components
Genetic diversity is crucial for selecting superior genotypes in a variety of improvement program, but environmental factors can mask real genetic variation. Phenotypic variance is the variation on the phenotypic expression of traits, and it can be determined by both genetic and environmental factors. As a result, for genotype selection, partitioning phenotypic variance into genotypic and environmental factors is crucial (Hasan et al., Citation2019). Generally, phenotypic variance was higher than genotypic variance indicating existence of both factors.
The high genotypic and phenotypic variance was recorded by grain yield followed by number of filled grain per panicle, plant height, and productive tillers per row length. This indicates that there is high possibility to perform effective selection based on phenotypic expression of these traits. While low variance component was recorded by crude protein content, nonproductive tillers, and panicle length. High genotypic and phenotypic variance component was reported by Limbani et al. (Citation2017) for filled grain, Asante et al. (Citation2019) for plant height, and Amegan et al. (Citation2020) for grain yield. Tewachewu et al. (Citation2018) reported low variance component for Panicle’s length and protein content and Hasan et al. (Citation2019) reported for panicle length.
The genotypic coefficient of variance (GCV) ranged from 6.1% to 44.51%, while the phenotypic coefficient of variance (PCV) ranged from 6.5% to 45.81%. The GCV% was slightly less than the PCV% indicating that traits were mostly controlled by genetic factor than environmental factors so the genotypes were able to express their genetic potentials. Low GCV and PCV values were observed on days to 85% maturity, panicle length, and crude protein content indicated that there was a minimum amount of genetic variation for them to be used as selection criteria for yield improvement and there is a need to create variation through techniques such as mutation and recombination, followed by selection (Srivastava et al., Citation2017). Similar results have been reported by Tadesse Girma et al. (Citation2018), Sandeep et al. (Citation2018), and Hasan et al. (Citation2019) for maturity and panicle length.
Moderate GCV and PCV were recorded by plant height, thousand grain weight, and number of filled grain/panicle. These moderate values indicated the existence of enough genetic variation among the genotypes to perform selection for improvement. In agreement with this result, Immanuel et al. (Citation2011) reported for number of filled grain per panicle and thousand grain weights, Ayenew et al. (Citation2019) reported for plant height among 36 rice genotypes. Low GCV values and moderate PCV values were recorded for days to 50% heading which in line with the findings of Tadesse Girma et al. (Citation2018) who reported moderate PCV value for days to 50% heading among thirteen rice genotypes.
High value of GCV and PCV were scored by number of unfilled grain per panicle, followed by number of nonproductive tillers, biomass, grain yield, number of productive tillers, and stand count at emergence. These higher GCV and PCV values suggested that the genotypes in this study had a diverse genetic basis and high variability, allowing for efficient genetic improvement through selection based on phenotypic expression of these traits. Similar results have been noted by Tuhina et al. (Citation2015) for grain yield, Hossain et al. (Citation2018) for unfilled grain per panicle, Brar et al. (Citation2018), Saha et al. (Citation2019) for number of productive tillers per hill. On the other hand, harvest index has moderate GCV and high PCV (19.27%, 21.05%) values. In agreement to this finding, Gyawali et al. (Citation2018) reported similar finding for phenotypic coefficient of variance but, unlike the finding on this paper, he reported high genotypic coefficient of variance for harvest index among seven lines of rice.
3.5. Estimation of heritability and genetic advance as percent of mean
Heritability is a good index of transmission of characters from parents to offspring, the estimate of heritability can be applied for genetic gain and its predictive role to indicate the reliability of the phenotypic value as a guide to breeding value (Lipi et al., Citation2020). The broad sense heritability on this study was high for all studied quantitative traits ranging from 62.16% to 98.51% which suggested that the phenotypic expression was largely determined by genotypic differences, with little effect from environmental factors. As a result, there is a good possibility of modifying the expression of those traits by progeny testing and mass selection. Supporting this finding, Mulugeta Bitew et al. (Citation2016) reported for maturity, thousand grain weight, and protein content; Roy and Shil (Citation2020) for panicle length and plant height; Tiwari et al. (Citation2019) for days to 50% heading. Similarly, (Hossain et al., Citation2018; Islam et al., Citation2015; Prasad et al., Citation2017) reported for number of productive tillers per plant, filled grain per panicle, unfilled grain per panicle, and grain yield.
The genetic advance is a valuable indicator of the progress that could be achieved as a result of selecting the relevant population (Islam et al., Citation2015). In this study, there was no trait which can be categorized as trait with low genetic advance. Moderate percentage of genetic advance as percent of the mean was recorded by crude protein content (11.02%), days to 85% maturity (11.8%), panicle length (14.65%) and days to 50% heading (19.9%). Moderate GAM indicated that moderate action of both additive and non-additive genes on the control of those characteristics. Similar findings were reported by Roy and Shil (Citation2020) for panicle length, Prasad et al. (Citation2017) for days to 85% maturity and panicle length. A result of high GAM indicated the maximum control of characters by additive gene action and the high possibility of using this trait for genetic improvement through selection. In this study, high GAM was recorded for nonproductive tillers (89.07%), unfilled grain per panicle (70.3%), above-ground biomass (68.76%), productive tillers (54.39%), grain yield (53.28%), stand count at emergence (44.91%), harvest index (36.36%), filled grain per panicle (35.39%), thousand grain weight (27.60%), and plant height (22.34%). Ajmera et al. (Citation2017); and Abebe et al. (Citation2017) reported similar result for the above-mentioned traits.
Knowledge of heritability coupled with genetic advance could be more beneficial than knowing only heritability of characters (Amegan et al., Citation2020). In this study, high heritability with high GAM was recorded for filled grain per panicle (98.51%, 35.39%), stand count at emergence (97.64%, 44.9%), productive tillers (98.42%, 54.39%), biomass (96.84%, 68.76%), unfilled grain per panicle (96.31%, 70.3%), grain yield (96.14%, 53.28%), nonproductive tillers (94.38%, 89.07%), thousand grain weight (88.40%, 27.60%), plant height (87.07%, 22.34%), and harvest index (83.88%, 36.36%). This indicated that the control of additive genes was high on those traits while, the influence of non-additive genes was low (Table ). This implies that these traits could be improved easily by simple selection. Similarly, Ajmera et al. (Citation2017) reported for plant height, productive tillers, filled grain per panicle, and grain yield. Sandeep et al. (Citation2018) reported for thousand grain weight, panicle length, Osman et al. (Citation2020) reported for number of unfilled grain/Panicles and biological yield, among 21 rice genotypes.
Table 3. Estimation of genetic parameters for yield related traits of 70 rice genotypes
4. Conclusions and recommendations
The current study found a highly significant difference (P < .001) for all quantitative parameters and a high diversity for qualitative traits. Based on their yield performance, good physical appearance, medium maturity date, high filled grain per panicle, and productive tillers G5, G7, G9, G12, G21, and G65, were selected as promising genotypes for further breeding purpose. Unfilled grain/panicle had the highest GCV and PCV values, whilst days to maturity had the lowest. All studied quantitative traits were with high heritability percentage. For stand count at emerge, plant height, productive tillers, non-productive tillers, filled grain per panicle, unfilled grain per panicle, thousand grain weight, grain yield, biomass, and harvest index were with high heritability and high genetic advance as percent of mean, indicating the presence of additive gene effects for these traits. Therefore further breeding activity for yield increment could be achieved through the indirect selection of genotypes with high biomass, high filled grain, high productive tiller, and good physical quality. Anyhow, this study was conducted in one location for only one season. Hence, the materials should be tested across locations. In addition, even though variability based on agronomic traits is crucial in Ethiopia, molecular characterization of those genotypes is required in order to discover the genetic variability and heritability of yield and yield-related traits at molecular level.
Correction
This article has been republished with minor changes. These changes do not impact the academic content of the article.
Acknowledgements
The authors would like to thank Ethiopian Institute of Agricultural Research, Pawe Agricultural Research Center for their support in funding the research, providing experimental materials and experimental fields, Bahir Dar University, and Pawe Agricultural Research Center staff for their help in the accomplishment of this research.
Disclosure statement
No potential conflict of interest was reported by the author(s).
Additional information
Funding
References
- Abebe, T., Alamerew, S., & Tulu, L. (2017). Genetic variability, heritability and genetic advance for yield and its related traits in rainfed lowland rice (Oryza sativa L.) genotypes at Fogera and Pawe, Ethiopia. Advances in Crop Science and Technology, 5(2). https://doi.org/10.4172/2329-8863.1000272
- Addinsoft. (2018). XLSTATstatistical and data analysis solution. https://www.xlstat.com
- Adhikari, B. N., Joshi, B. P., Shrestha, J., & Bhatta, N. R. (2018). Genetic variability, heritability, genetic advance and correlation among yield and yield components of rice (Oryza sativa L.). Journal of Agriculture and Natural Resources, 1(1), 149–20. https://doi.org/10.3126/janr.v1i1.22230
- Ajmera, S., Kumar, S. S., & Ravindrababu, V. (2017). Evaluation of genetic variability, heritability and genetic advance for yield and yield components in rice genotypes. International Journal of Current Microbiology and Applied Sciences, 6(10), 1657–1664. http://doi.org/10.20546/ijcmas.2017.610.200
- Ambavaram, M., Basu, S., Krishnan, A. et al. Coordinated regulation of photosynthesis in rice increases yield and tolerance to environmental stress. Nat Commun 5, 5302 (2014). https://doi.org/10.1038/ncomms6302
- Amegan, E., Efisue, A., Akoroda, M., Shittu, A., & Tonegnikes, F. (2020). Genetic diversity of korean rice (Oryza Sativa L.) germplasm for yield and yield related traits for adoption in rice farming system in nigeria. International Journal of Genetics and Genomics, 8(1), 19–28. https://doi.org/10.11648/j.ijgg.20200801.13
- Asante, M. D., Adjah, K. L., & Annan-Afful, E. (2019). Assessment of genetic diversity for grain yield and yield component traits in some genotypes of rice (Oryza sativa L.). Journal of Crop Science and Biotechnology, 22(2), 123–130. https://doi.org/10.1007/s12892-019-0008-0
- Ayenew, A., Dejene, T., & Worede, F. (2019). Traits interrelationships in lowland rice genotypes under rain-fed condition of fogera. NorthWestern Ethiopia Asian Journal of Plant Science, 9(3), 13–23. www.pelagiaresearchlibrary.com
- Belayneh, T., & Tekle, J. (2017). Review on adoption, trend, potential and constraints of rice production to livelihood in Ethiopia. International Journal of Research -GRANTHAALAYAH, 5(6), 644–658. https://doi.org/10.29121/granthaalayah.v5.i6.2017.2097
- Bioversity International, IRRI and WARDA. (2007). Descriptors for wild and cultivated rice (Oryza spp.). International Rice Research Institute. Bioversity International, Rome, Italy
- Brar, B., Chaudhary, D., Jain, R. K., & Jain, S. (2018). Agronomic characterization of rice genotypes and its relations with yield trait. International Journal of Genetics, 10(2), 349–353. https://doi.org/10.9735/0975-2862.10.2.349-353
- Burton, G. W., & Devane, D. E. (1953). Estimating Heritability in Tall Fescue (Festuca Arundinacea) from Replicated Clonal Material 1. Agronomy Journal, 45(10), 478–481. https://doi.org/10.2134/agronj1953.00021962004500100005x
- CSA (Central Statistical Agency). 2021. The federal democratic republic of Ethiopia agricultural sample survey 2010/21 (2013 e.c.) report on area and production of major crops (private peasant holdings, meher season) 1. Addise Abeba.
- DeLacy, I. H., Basford, K. E., Cooper, M., Bull, J. K., & McLaren, C. G. (1996). Analysis of multi-environment trials an historical perspective. In M. Cooper & G. L. Hammer (Eds.), Plant adaptation and crop improvement (pp. 39–124).
- EIAR (Ethiopian Institute of Agricultural Research). 2021. Pawe agricultural research center profile. http://www.eiar.gov.et/parc/index.php/about-parc/center-profile ( accessed on September/2021)
- FAOSTA statistical database, 2022 Food and livestock products. Food and Agriculture Organization of the United Nations, Rome Accessed 08 11 2022. : https://www.fao.org/faostat/en/#data/QCL.
- Fentie, D. B., Abera, B. B., & Ali, H. M. (2021). Association of agronomic traits with grain yield of lowland rice (Oryza Sativa L.) genotypes. International Journal of Research in Agricultural Sciences, 8(3), 161–175. https://ijras.org/administrator/components/com_jresearch/files/publications/IJRAS_973_FINAL.pdf
- Gyawali, S., Poudel, A., & Poudel, S. (2018). Genetic variability and association analysis in different rice genotypes in mid hill of western Nepal. Acta Scientiarum Agronomy, 2(9), 69–76. https://actascientific.com/ASAG/pdf/ASAG-02-0173.pdf
- Hari Ghimire, K., Krishna Joshi, B., Karee, A., & Nath Paudel, M.2020. morphological variation in Nepalese cold tolerant rice accessions. Nepal agricultural council. proceedings of the 29th national summer crop workshop (17-18 June, 2018).
- Harrell, D. L., Brown, S. A., Famoso, A. N., Fontenot, K. A., Groth, D. E., Levy, R., Kongchum, M., Oard, J. H., Angira, B., Wilson, B. E., Webster, E. P., & Zaunbrecher, R. E. 2021. Rice varieties and management tips. Louisiana State University Agricultural Center available at: http://www.lsuagcenter.com/topics/crops/rice ( accessed on June/2021)
- Hasan, M. J., Kulsum, M. U., Mohiuddin, S. J., & Zahid-AL-Rafiq, M. (2019). Genetic interrelationship among yield and its components in rice hybrids. Bangladesh Journal of Botany, 48(4), 1207–1213. https://doi.org/10.3329/bjb.v48i4.49077
- Hegde, S., & Hegde, V. (2013). Assessment of global rice production and export opportunity for economic development in Ethiopia. International Journal of Scientific Research, 2(6), 2319–7064.
- Hossain, S., Salim, M., Azam, M. G., & Noman, S. (2018). Variability, correlation and path analysis in drought tolerant rice (Oryza sativa L.). Journal of Bioscience and Agriculture Research, 18(2), 1521–1530. https://doi.org/10.18801/jbar.180218.187
- Immanuel, S. C., Pothiraj, N., Thiyagarajan, K., Bharathi, M., & Rabindran, R. (2011). Genetic parameters of variability, correlation and pathcoefficient studies for grain yield and other yield attributes among rice blast disease resistant genotypes of rice (Oryza sativa L.). African Journal of Biotechnology, 10(17), 3322–3334. https://doi.org/10.5897/AJB10.2575
- International Rice Research Institute. (2013).Standard evaluation system for rice (5th) Philippines. 13–21
- Islam, M. A., Raffi, S. A., Hossain, M. A., & Hasan, A. K. (2015). Analysis of genetic variability, heritability and genetic advance for yield and yield associated traits in some promising advanced lines of rice.Progress. agric, 26(1), 26–31. https://doi.org/10.3329/pa.v26i1.24511
- Jamago, J. M., & Cortes, R. V. (2012). Seed diversity and utilization of the upland rice landraces and traditional varieties from selected areas in Bukidanon. Philippines. International Journal of Animal Ecology, 4, 112–130. http://dx.doi.org/10.7718/ijec.v4i1.366
- Johnson, H. W., Robinson, H. F., & Comstock, R. E. (1955). Estimates of genetic and environmental variability in soybeans. Agronomy Journal, 47(7), 314–318. https://doi.org/10.2134/agronj1955.00021962004700070009x
- Jones, D. B. (1941). Factors of converting percentages of nitrogen in food and feeds in to percentage of protein (pp. 12). US Department of Agriculture.
- Juliano, B. O. (2016). Rice: Overview. In C. Wrigley, H. Corke, K. Seetharaman, & J. Faubion (Eds.), Encyclopedia of Food Grains (Vol. 1, pp. 125–129). Academic Press. https://doi.org/10.1016/B978-0-12-811508-4-00002-2
- Kanushree, N., Sarawgi, A. K., Mangla, P., Ritu, R. S., & Suman, R. (2020). Assessment of diversity based on agro-morphological and quality characterization of germplasm accessions of rice (Oryza sativa L.). International Journal of Current Microbiology and Applied Sciences, 9(8), 2397–2408. https://doi.org/10.20546/ijcmas.2020.908.274
- Kawakatsu, T., & Takaiwa, F. (2019). Institute of Agrobiological Sciences, National Agriculture and Food Research Organization, Tsukuba, Japan. Rice proteins and essential amino acids. In Rice (pp. 109-130). AACC International Press. https://doi.org/10.1016/B978-0-12-811508-4.00004-6
- Kumar Maliyappa Rajanna, C., Bandharlahalli Narayanswamy, R., Moon Choudhury, M., Jaime, A., da Silva, T., & Prasad, R. (2011). Characterization of Rice (Oryza sativa L.) hybrids and their parental lines based on the seed, seedling, and plant morphological traits. Seed Science and Biotechnology, 5(1), 36–41. https://www.researchgate.net/profile/Chetan-Kumar-M-R/publication/262842225_
- Lei, Q., Zhou, J., Zhang, W., Luo, J., Wu, K., & Long, C. (2018). Morphological diversity of panicle traits in Kam fragrant glutinous rice (Oryza sativa). Genetic Resources and Crop Evolution, 65(3), 775–786. https://doi.org/10.1007/s10722-017-0570-9
- Limbani, P. L., Gangani, M. K., & Pandya, M. M. (2017). Genetic Variability, heritability and genetic advance in rice (Oryza sativa L.). International Journal of Pure & Applied Bioscience, 5(6), 1364–1371. https://doi.org/10.18782/2320-7051.5395
- Lipi, L. F., Hasan, M. J., Akter, A., Quddus, M. R., Biswas, P. L., Ansari, A., & Akter, S. (2020). Genetic variation, heritability and genetic advance in some promising rice hybrids. SAARC Journal of Agriculture, 18(2), 39–49. https://doi.org/10.3329/sja.v8i2.51107
- Mackill, D. J., Coffman, W. R., & Garrity, D. P. (1996). Rainfed lowland rice improvement. International Rice Research Institute Manila, Philippines, 242. https://books.irri.org/971220071X_content.pdf
- Maity, A., Lamichaney, A., Joshi, D. C., Bajwa, A., Subramanian, N., Walsh, M., & Bagavathiannan, M. (2021). Seed shattering: A trait of evolutionary importance in plants. Frontiers in Plant Science, 12, 1180. https://doi.org/10.3389/fpls.2021.657773
- Mulugeta Bitew, J., Mekbib, F., & Assefa, A. (2016). Genetic variability among yield and yield related traits in selected upland rice (Oryza sativa L. and Oryza glaberrima Steud) genotypes in northwestern Ethiopia. World Scientific News, 2(47), 62–74. https://www.worldscientificnews.com/wp-content/uploads/2015/10/WSN-472-2016-62-74.pdf
- Negussie, T., & Alemu, D. (2011). An over view of the national rice research and development strategy and its implementation. In K. Assefa, D. Alemu, K. Shiratori, & A. Kirub (Eds.), Challenges and opportunities of rice in Ethiopia agricultural development.1pp (pp.1–16). https://www.jica.go.jp/project/ethiopia/001/materials/ku57pq00000kj6me-att/seminar_02.pdf
- Nikhil, B. S. K., Rangare, N. R., & Saidaiah, P. (2014). Heritability and genetic advance for yield and yield attributes in rice (Oryza sativa L.). Journal of Tropical Agriculture, 32(1/2), 101–104. https://serialsjournals.com/abstract/56484_19.pdf
- Osman, K. A., Kang, K. H., El-Siddg, A. A., Ahmed, Y. M., & Abdalla, S. M. (2020). Assessment of genetic variability for yield and attributed traits among rice doubled haploid (DH) lines in semi-arid zone Sudan. African Journal of Agricultural Research, 16(7), 939–946. https://doi.org/10.5897/AJAR2019.14496
- Osundare, O., Akinyele, B. O., Fayeum, L. S., & Osekita, O. S. (2017). Evaluation of qualitative and quantitative traits and correlation coefficient analysis of six upland rice varieties. Journal of Biotechnology and Bioengineering, 1(1), 17–27. https://www.researchgate.net/profile/Opeyemi-Osundare/publication/335404183_
- Prakash Poudel, A. (2018). Analysis of growth and yield attributing characteristic of direct seeded upland rice genotypes in western hills of Nepal. Acta Scientiarum Agronomy, 2. (7, 117–122. https://actascientific.com/ASAG/pdf/ASAG-02-0131.pdf
- Prasad, K. R., Radha-Krishna, K. V., Bhave, M. H. V., & Subba-Rao, L. V. (2017). Genetic variability, heritability and genetic advance in boro rice (Oryza sativa L.) germplasm. International Journal of Current Microbiology and Applied Sciences, 6(4), 1261–1266. https://doi.org/10.20546/ijcmas.2017.604.153
- Robinson, H. F., Comstock, R. E., & Harvey, P. H. (1949). Estimates of heritability and the degree of dominance in corn 1. Agronomy Journal, 41(8), 353–359. https://doi.org/10.2134/agronj1949.00021962004100080005x
- Roy, S. C., & Shil, P. (2020). Assessment of genetic heritability in rice breeding lines based on morphological traits and caryopsis ultrastructure. Scientific Reports, 10(1), 7830. https://doi.org/10.1038/s41598-020-63976-8
- Saha, S. R., Hassan, L., Haque, M. A., Islam, M. M., & Rasel, M. (2019). Genetic variability, heritability, correlation and path analyses of yield components in traditional rice (Oryza sativa L.) landraces. Journal of the Bangladesh Agricultural University, 17(1), 26–32. https://doi.org/10.3329/jbau.v17i1.40659
- Sandeep, S., Sujatha, M., Subbarao, L. V., & Neeraja, C. N. (2018). Genetic variability, heritability and genetic advance studies in rice (Oryza sativa L.). International Journal of Current Microbiology and Applied Sciences, 7, 3719–3727. https://doi.org/10.20546/ijcmas.2018.712.424
- Shankar, T., Malik, G. C., Banerjee, M., Dutta, S., Maitra, S., Praharaj, S., Sairam, M., Kumar, D. S., Dessoky, E. S., Hassan, M. M., Ismail, I. A., Saif, T., Skalicky, M., Brestic, M., & Hossain, A. (2021). Productivity and Nutrient balance of an intensive rice–rice cropping system are influenced by different nutrient management in the red and lateritic belt of west bengal, India. Plants, 10(8), 1622. https://doi.org/10.3390/plants10081622
- Shannon, C. E. (1948). A mathematical theory of communication. Bell System Technical Journal, 27(3), 379–423. https://doi.org/10.1002/j.1538-7305.1948.tb01338.x
- Singh, A., Singh, A. K., Parveen, S., & Singh, P. K. (2014). Characterization and assessment of variability in upland rice collections. Electronic Journal of Plant Breeding, 5(3), 504–510. https://www.ejplantbreeding.org/index.php/EJPB/article/view/45
- Sow, M., Sido, A., Laing, M., & Ndjiondjop, M. N. (2014). Agro-morphological variability of rice species collected from Niger. Plant Genetic Resources, 12(1), 22–34. https://doi.org/10.1017/s1479262113000221
- Srivastava, N., Babu, G. S., Singh, O. N., Verma, R., Pathak, S. K., Behra, M., Jena, D., & Chanda, M. (2017). Genetic variation, heritability and diversity analysis of exotic upland rice (Oryza sativa L.) germplasms based on quantitative traits. Journal of Pharmaceutical Innovation, 6(12), 316–320. https://www.thepharmajournal.com/archives/2017/vol6issue12/PartE/6-12-24-504.pdf
- Statistical Analysis System (SAS). (2014). SAS Institute. The SAS system for windows. Release 9.4
- Sumanth, V., Suresh, B. G., Ram, B. J., & Srujana, G. (2017). Estimation of genetic variability, heritability and genetic advance for grain yield components in rice (Oryza sativa L.). Journal Ofrmacognosy and Phytochemistry, 6(4), 1437–1439. www.phytojournal.com
- Tadesse Girma, B., Amanuel Kitil, M., Gebre Banje, D., Mengistu Biru, H., & Bayisa Serbessa, T. (2018). Genetic variability study of yield and yield related traits in rice (Oryza sativa L.) genotypes. Advances in Crop Science and Technology, 6(4). https://doi.org/10.4172/2329-8863.1000381
- Tefera, A., Sentayehu, A., & Leta, T. (2019). Traits association and path coefficient analysis of yield and related traits in rainfed lowland rice (Oryza sativa L.) genotypes in North Western Ethiopia. African Journal of Plant Science, 13(1), 1-8. https://doi.org/10.5897/AJPS2018.1693
- Tewachewu, A., Mohammed, W., & Assefa, A. (2018). Genetic Variability, Heritability and Genetic Advance Analysis in Upland Rice (Oryza sativa L.) Genotypes for Yield and Yield Related Traits in Benishangul Gumuz, Ethiopia, Ethiopian. International Journal of Plant Breeding, 5(3), 437–443. https://www.scribd.com/document/395721137
- Thiex, N. J., Manson, H., Anderson, S., Persson, J. Å., Collaborators: Anderson, S., Bogren, E., Bolek, G. B., Ellis, D., Eriksson, C., Field, S., Frankenius, G., Henderson, E., Kapphahn, C., Kapphahn, C., Lundberg, M., Manson, L., Moller, H., Russell, J., Russell, M., … Spann, M. (2002). Determination of crude protein in animal feed, forage, grain, and oilseeds by using block digestion with a copper catalyst and steam distillation into boric acid: Collaborative study. Journal of AOAC International, 85(2), 309–317. https://doi.org/10.1093/jaoac/85.2.309
- Tiwari, D. N., Tripathi, S. R., Tripathi, M. P., Khatri, N., & Bastola, B. R. (2019). Genetic variability and correlation coefficients of major traits in early maturing rice under rainfed lowland environments of Nepal. Advances in Agriculture, 2019, 9. https://doi.org/10.1155/2019/5975901
- Tsuboi, T. (1992). Handbook of tropical rice cultivation. In Association for international cooperation of Agriculture and Forestry (pp. 5–41).
- Tuhina-Khatun, M., Hanafi, M. M., Rafii Yusop, M., Wong, M. Y., Salleh, F. M., & Ferdous, J. (2015). Genetic variation, heritability, and diversity analysis of upland rice (Oryza sativa L.) genotypes based on quantitative traits. BioMed research international. https://doi.org/10.1155/2015/290861
- Wangpan, T., Taka, T., & Tangjang, S. (2018). On-farm diversity of indigenous rice (Oryza sativa L.) landraces in border of eastern Himalaya.Pertanika. Journal of Tropical Agricultural Science, 41(1), 393–410. https://www.researchgate.net/profile/Tonlong-Wangpan/publication/323445250
- Xing, Y. and Zhang, Q., 2010. Genetic and molecular bases of rice yield. Annual review of plant biology, 61(1), 421–442. https://doi.org/10.1146/annurev-arplant-042809-112209
Table A1.
Mean performance of 70 rice genotypes at Pawe for 2020/21 cropping season
Table A2.
Classifications of qualitative traits of 70 rice genotypes