
Abstract
Efficient conservation and subsequent utilization of genetic resources are primarily dependent on the strength in the assessment of variation among genotypes. An experiment was carried out aiming at determining the extent of phenotypic variability present in a panel of 320 barley genotypes and identifying candidate lines for further evaluation in improvement programs and successive utilization. It was conducted at two locations in Ethiopia, Aris Negelle and Holetta in the 2017/18 and 2018/19 cropping seasons. Among the best 30 lines for grain yield across all the environments, lines from farmers’ varieties constitute 73% and lines that mature in less than 85 days were identified. Based on the spike row number, the best-performing lines combined across all the environments were six-rowed types. Based on the two years’ data at Arsi Negelle the two-rowed spike type dominates, and at Holetta the six-rowed type. After principal component analysis, the first three PCs with an eigenvalue greater than one explained 70% of the variation. The correlation coefficient between grain and biomass yield was significant and though low (r = 0.38***). Significant, high, and negative correlation coefficient (−0.72***) was observed between 1000 kernel weight and the number of seeds per spike. A positive correlation between biomass and grain yield attracts farmers as a feed and food crop as it has also been signified in the current research. Having the improved barley gene pool largely from international sources, combining the improved materials with farmers’ varieties may minimize the existing gap between the local and improved barley gene pool.
1. Introduction
Barley is widely grown in the World, being the fifth most important cereal crop after wheat, rice, maize and soybean based on the area of production (https://www.fao.org/faostat/en/#data/QCL accessed November, 2022). It is a diploid (2 n = 2x = 14) and one of the largest cereals with a genome size of 4.79 billion letters of genetic code which is twice the size of the human genome (Mascher et al., Citation2017). The crop is known for its versatility and natural stands can be found in a wider range of agro-ecologies, from the arid regions of the Mediterranean to altitudes up to 4,500 m in the Himalayas (Bothmer et al., Citation1991; Graner et al., Citation2003; Kaur et al., Citation2022). Ethiopia being a field and horticultural crops biodiversity hotspot is regarded as one of the eight centres of origin of crops (Hummer & Hancock, Citation2015; Sikdar, ; Vavilov, Citation1992). Especially for barley, the diversity was found to be immense to the extent that there are plenty of forms that are unique to Ethiopia including the deficient and irregular barley types (Aberg & Wiebe, Citation1946; Vavilov, Citation1992). All the con-varieties identified across the World: vulgare, distichion, intermedium, and labile are currently under production in the country (Asfaw, Citation2000). Barley is the fifth most important crop (CSA, Citation2021) after tef, maize, wheat, and sorghum both in the area of production and quantity produced. In the recent past produced mainly in the main growing season, however, there are very few places growing barley in the short rainy season as well. Barley is being conserved in Ethiopia both in situ in community seed banks located on the different agroecologies of the country and ex-situ. It makes the largest collection of all the crops conserved in the Ethiopian gene bank with more than 17,000 farmers’ varieties (www.ebi.gov.et). Barley farmers’ varieties cover approximately 90% of the land devoted to barley in Ethiopia, thus significantly contributing to food security in the country (Hadado et al., Citation2009).
Different researchers have reported on the level of diversity in agro-morphological traits of barely (Asfaw, Citation1988, Citation2008; Demissie & Bjørnstad, Citation1996; A Dido et al., Citation2021; Gadissa et al., Citation2021; Kebebew et al., Citation2001). Diversity for yield and yield-related traits were also reported by (Al-Abdallat et al., Citation2017; Al-Sayaydeh et al., Citation2019; Dorostkar et al., Citation2015; Kaur et al., Citation2022, Citation2019; Matin et al., Citation2019; Ren et al., Citation2013; Zeng, Citation2015). In response to numerous unpredictable variabilities, in barley like other crops, crop production is heavily affected by spatial and temporal variations in the environment. Hence genotype by environment interaction effect was recognized as a key area of intervention as it perhaps limits the performance of the genotypes over different locations and seasons affecting the genotypes’ stability (Nowosad et al., Citation2018; Yan & Frégeau-Reid, Citation2018). In barley, various pieces of research were undertaken to dissect genotype by environment interaction effect and pointed out how to handle its disadvantages (Fekadu et al., Citation2022; Olivoto et al., Citation2019; Pour-Aboughadareh et al., Citation2022).
Multivariate analysis technique in studying the divergence between genotypes and the degree of association between the traits has become increasingly important. Hence different authors reported the application of cluster and principal component analysis in barley (Derbew, Citation2020; AA Dido et al., Citation2020; Enyew et al., Citation2019; Eticha et al., Citation2010; Žáková & Benková, Citation2006). However, the research efforts made so far to uncover the diversity in barley focusing on the barley genetic resources of Ethiopia were not much compared to the huge genetic resource in the country. Despite the large number of barley accessions conserved in the ex-situ gene bank little has been characterized so far and hence no core collection of these accessions was developed. Owing to the change in climate, the production of barley twice a year is now reduced to once a year in most places causing a significant decrease in yearly production in Ethiopia. Furthermore, there is a considerable gap between the World average productivity of barley (3.1 t/ha) (http://www.fao.org/faostat/en/#data/QCL) compared to that of Ethiopia (2.11 t/ha) (Derbew, Citation2020; Tadesse & Derso, Citation2019). The current research which was based on a panel of barley lines, of which 293 were lines derived from farmers’ varieties and 27 were improved varieties is believed to contribute to narrowing the existing gap. The objectives of the study were, therefore, 1) determination of the extent of phenotypic variation present in the barley panel, 2) identification of candidate lines for further evaluation in improvement programs and their successive distribution and utilization.
2. Material and methods
2.1. Experimental sites
The barley panel of lines was sown at two locations, Arsi Negelle and Holetta for two years 2017/18 and 2018/19 during the main cropping season. Arsi Negelle is situated in the central rift valley of Ethiopia at a latitude of 7°21′N, a longitude of 38°42′E and an elevation of 2043 meters above sea level (m.a.s.l.). The annual rainfall ranges from 500–1000 mm and the average annual temperature varies from 10–25°C with the Andosol type of soil (Mekonnen et al., Citation2018). Holetta Agricultural Research Center is located at a latitude of 9°00ʹN and a longitude of 38°30ʹE with an altitude of 2400 m.a.s.l. The temperature at this location varies between 6°C to 22°C with an annual average rainfall of 1144 mm. The soil type is classified as Eutric Nitisol with a pH of 4.92 (http://www.eiar.gov.et/holetta/.) Monthly rainfall, minimum and maximum temperature data for the experimental period (2017 and 2018) for the test locations are presented in (Additional file 1).
2.2. Genetic materials
For this experiment, 249 barley accessions were obtained from the Ethiopian Biodiversity Institute (EBI) (www.ebi.gov.et). These accessions were representative of four regions (Amhara, Oromia, SNNP and Tigray) and 17 different administrative zones. The accessions were collected from a range of altitudes spanning from <1,350 to >3,550 m.a.s.l). From these accessions, through ear-to-row purification, 501 lines were developed. Out of these lines, based on morphological characteristics, avoiding sister lines to maximize both genotypic and phenotypic diversity, 293 lines were retained to be included in the phenotyping experiment (Additional File 2). In addition to those lines, 27 improved varieties maintained by the national agricultural system were included, out of which 11 were introduced from elsewhere and evaluated and released, 11 were crossings in the research institutes and five were selections. The cultivars were obtained from the respective maintainer agricultural research centre. These genetic materials comprise 6-rowed, 2-rowed (both deficiens and male fertile) and irregular barley variants. Food and malt barley types, hulled and hulless barley were also included.
2.3. Field experiment
The experiment was laid according to alpha lattice design with two replications in four rows of 2.5 m length and 0.2 m row spacing. The spacing between plots was 0.4 m and between blocks was 1 m. Each plot of 2 m2 was sown with 17 g of seeds (85 kg ha−1) and planning was done by hand drilling. The experiment was carried out for two years and planting was done the first week of July at Holetta and the second week of July at Arsi Negelle in both years. The plots were fertilized with DAP and Urea fertilizers as per the recommended rate of applications for the two sites. The plots were hand-weeded following the critical period of weeding for barley for the first weeding and the treatments were treated alike for other agronomic practices too.
2.4. Data collection
Data collection was based on the descriptor list developed by Bioversity International (IPGRI, Citation1994) and the International Union for the Protection of New Varieties (UPOV, Citation1994). Four phenological and seven agronomic traits were collected in the current experiment. Phenological characters were days to booting (number of days from sowing to 50% of the plants show swollen boot, number), days to heading (number of days from sowing to heads of 50% of plants fully emerged, number), days to mature (number of days from sowing to 75% physiological maturity, number) and grain filling period (number of days from heading to maturity, number); agronomic traits were plant height (cm), number of effective tillers (number), spike length(cm), grain yield (ton ha−1), biomass yield (ton ha−1), number of kernel per spike (number) and thousand kernel weight (gm). All the phenological traits, grain yield, biomass yield, and thousand kernel weight were collected on a plot basis. Data on plant height, number of effective tillers, spike length, and number of kernels per spike on the other hand were collected from 5 randomly sampled plants. The data on grain yield and thousand kernels were adjusted to 12.5% moisture content.
2.5. Data analysis
The restricted maximum likelihood (REML) algorithm was used to produce the best linear unbiased prediction (BLUP) mean, in which case the genotypes and the environments were fitted as random. The BLUP means combined over the four environments were calculated using the META- R statistical software version 6.04 (Alvarado et al.,). These means were used in subsequent statistical analyses (principal component analysis and cluster analysis). The model used to produce the means was given by (Alvarado et al.,). R version 3.6.1 was applied to produce a boxplot (to compare the grain yield over seasons and locations) using the ggplot-2 function and correlation between variables using the performance analytics function.
Principal component analysis was carried out using the prcomp function of R statistical software version R.3.6.1.(R core team, Citation2019). The combined BLUP means of the characters standardized to a mean of zero and a variance of one to reduce differences in the measurement scale of the collected data (Sneath & Sokal, Citation1973) were used in the analysis downstream. The clustering of the observations was performed by Ward amalgamation steps (Ward, Citation1963) using MINITAB vr.14 statistical package based on squared Euclidean distance (D2). The D2 values obtained for pairs of clusters were considered as the calculated values of Chi-square (χ2). They were tested for significance both at 1 and 5% probability levels against the tabulated values of χ2 for “P” degree of freedom, where P is the number of characters considered (CB, Citation1985). The optimum number of clusters was decided at a certain point where the similarity level had a sharp decline inducing an abrupt increment in the diversity level score.
3. Results and discussion
3.1. Variance component analysis
Diversity assessment between the barley lines through REML variance component analysis revealed that there was a highly significant difference (p < 0.001) among genotypes for all the traits under consideration combined over environments (Table ). The effect of the environment was also found to be significant (p < 0.01) for all characters except spike length. The genotype-by-environment interaction effect also showed a similar trend to that of the genotype. The highly significant variation among lines in the current experiment reaffirms the huge variability that characterizes barley genetic resources, especially among Ethiopian material (Bedasa et al., Citation2015; Bogale et al., Citation2021; Derbew, Citation2020; Gadissa et al., Citation2021; Hammami et al., Citation2016; Naser et al., Citation2018). This level of variability could be exploited through the selection of superior genotypes with superior desirable traits, which is a prerequisite for a successful barley improvement program. Significant genotype x environment interaction is a result of changes in the magnitude of the differences among genotypes over different locations or years (environments) (Olivoto et al., Citation2019; Yan & Frégeau-Reid, Citation2018). The presence of highly significant interaction effects for all the traits under scrutiny pooled over the four environments in this experiment, therefore, ascertains the performance of lines over the test environments was differential (Choi et al., Citation2020; Hilmarsson et al., Citation2021; Rodriguez et al., Citation2008). Above-average and high genotypes by environment interaction allow the identification of lines with specific adaptations (Ceccarelli, Citation1989; Hilmarsson et al., Citation2021). For complex quantitative traits, like grain yield, this interaction effect can confound the association between phenotype and genotype, and hence may significantly reduce selection progress (Ebadi-Segherloo et al., Citation2016). In such cases, this interaction effect at some point can be considered the main reason behind the lack of success in highly centralized breeding programs, since lines that are superior in low-input farming systems may not perform well in high-potential environments. Different authors (Al-Abdallat et al., Citation2017; Bleidere et al., Citation2012; Ceccarelli & Grando, Citation1991; Elakhdar et al., Citation2017; Fekadu et al., Citation2022; Muluken et al., Citation2010; Pour-Aboughadareh et al., Citation2022; Rodriguez et al., Citation2008) have also reported on genotype by environment interaction effect on barley.
Table 1. Variance component analysis barley lines combined over four environments
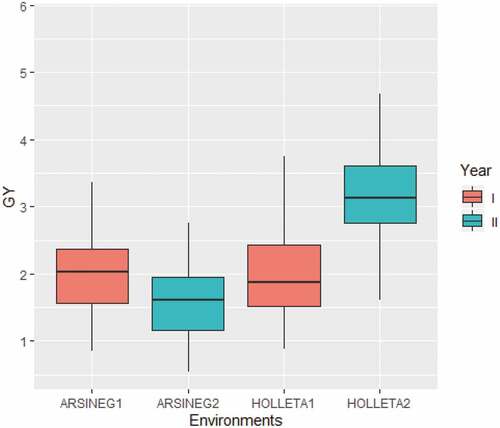
Comparing the grain yield over the environments (two locations over two years) it was found that the highest grain yield was observed at Holetta year II (Figure ) and the lowest at Arsi Negelle year II. HB-1307, with a grain yield of 2.79 t ha−1, was found to be the highest yielding line and the line Accn#16,862-A with a grain yield of 1.85 t ha−1 was the lowest yielding line based on two years two locations data. Bogale et al. (Citation2021) in their study done on malt barley reported significant differences across the testing sites, the highest grain yield was observed at the Miligesa site and the lowest grain yield at Kino. According to Fekadu et al. (Citation2022) highest grain yield was observed at Bekoji and Werabe whereas at Holetta the genotypes showed an intermediate yield. Among the top 30 lines combined over the test environments for grain yield (Table S1), six lines (HB-1307, Accn#235,551-B, CROSS41/98, Accn#208,841-B, Accn#16,726-A, and Ibon 174/03) were also in the top 30 when the analysis was done based on combined data over years for each location separately. This indicated that the mentioned lines were consistent over years and adapted to both locations. Similarly, (Wosene et al., Citation2015) reported in their research done on barley landraces that the genotype (G-11) was more stable across the environments they studied. The lines well-performing in both locations do have wide adaptation since the two locations tested in this work were contrasting both in terms of altitude, rainfall (amount and distribution), and other climatic variables. Interestingly, three of such highly adaptive lines were derived from farmers’ varieties. This qualifies that farmers’ varieties are good sources of genetic material to develop improved varieties with high grain and biomass yield and wide adaptability across environments and also some farmers varieties have adapted to specific niches. This finding accords the results of (Megersa et al., Citation2015) that indicated greater yield response could be attained through direction selection in barley landrace which might be attributed to the nature of the farmers’ varieties to have better adaptive traits. In addition (Wosene et al., Citation2015) reported based on three static stability parameters, three landraces had a higher stability where significant differences between landraces and cultivars was observed for these static stability parameters.
Figure 1. Grain yield with the respect to the four test environments. The x-axis represents, the environments ARSINEG1 = Arsi Negelle year I and ARSINEG2 = Arsi Negelle year II; HOLLlETA1 = Holetta year I, and HOLLETA2 = Holetta year II. The y-axis represents the estimated grain yield in t ha−1.
However, some of the lines showed specific adaptation in which case the farmer variety Accn# 24,970 was the highest yielding line over the two years at Holetta (3.43 t ha-1) but not in the top 30 at Arsi Negelle. Likewise, the farmer variety Accn#1826 was the highest yielding across years at Arsi Negelle (2.03 t ha-1) but not in the top 30 at Holetta. This stems from the fact that as a result of the genotype-by-environment interaction effect these lines had differential responses over the test environments and hence had specific adaptations (Naser et al., Citation2018; Wosene et al., Citation2015). This calls for further evaluation of such lines as Accn#1826 at Arsi Negelle (marginal type of environment) and Accn# 24,970 at Holetta (potential environment) together with other cultivars, which have been specifically released for the respective environments. According to (Pour-Aboughadareh et al., Citation2022) seven genotypes G1, G2, G3, G4, G14, G17 and G19 had narrow adaptation and the other six genotypes G6, G11, G12, G13, G16 and G18 had wider adaptation.
In the top 30 lines across all environments for grain yield, 73% were derived from farmers’ varieties (Figure , panel a). Eighteen lines derived from farmers’ varieties, gave equal grain yield with the best variety HB 1307. The analysis of two years data for each location separately instead revealed some of the lines from farmers’ varieties outperformed the cultivars. Lakew et al. (Citation1997) reported that farmers’ varieties significantly out yielded the improved variety used as a check. Yahiaoui et al. (Citation2014) also reported barley farmers’ varieties having higher grain yield than the cultivar in low-production sites. According to (Megersa et al., Citation2015) the farmers’ variety Garbu Guracha gave a higher grain yield than the improved variety HAR 1307. On the other hand (Wosene et al., Citation2015) reported farmers’ varieties showed higher yield stability and comparable yield to improved varieties. Furthermore, 60% of the top 30 lines (combined over the four environments) were six-rowed spike type and the remaining were 2-rowed, none of them was irregular spike type. Based on individual locations’ two years average, 56% of the top 30 lines at Arsi Negelle were 2-rowed spike type, whereas at Holetta 77% were six-rowed spike type. It has been reported that the six-row spike type may produce 3 fold higher yield than the two-row spike type (Pourkheirandish & Komatsuda, Citation2007). Kaur et al. (Citation2022) reported the six-row spike type barley had a higher grain yield than the two-row spike type and the hulled types had a higher grain yield than the hulless ones. However, the two-rowed barley lines outyielded the six-rowed types at Arsi Negelle, perhaps due to the six-rowed lines, in general, were later maturing than the two-rowed lines, thus suffering from terminal moisture shortage. This is in agreement with the findings of (Dodig et al., Citation2018) who reported the two-rowed varieties gave significantly higher yield compared to the six-rowed varieties under terminal drought simulated environments. In addition, the tillering capacity of the two-rowed types was higher than the six-rowed types which allow them to produce a higher number of fertile spikes per unit area (Arisnabarreta & Miralles, Citation2006; Le, Citation1992). In a study made to examine the row-type effect on tillering, analyses of vrs1 mutants and their progenitors were performed and the result revealed that the total number of tillers per plant was significantly higher in two-rowed progenitors compared to the six row (Alqudah et al., Citation2016). Further more (Liller et al., Citation2015) found that the majority of plants with altered spike architecture caused by changes in Vrs1 and Vrs4 loci had reduced seed weight and fewer tillers than the two-rowed control plants
Figure 2. Top 30 highest yielding barley types (panel a), FV = Farmers’ varieties, IV = Improved varieties, AN = Arsi Negelle, HO = Holetta x-axis barley spike row type, y-axis number of barley lines; Days to maturity with the respect to the four test environments (panel b). The x-axis represents, the environments as Arsi Negelle year I (ARSINE1) and year II (ARSINEG2), Holetta year I (HOLETTA1) and year II (HOLETTA2). The y-axis represents the number of days to mature.
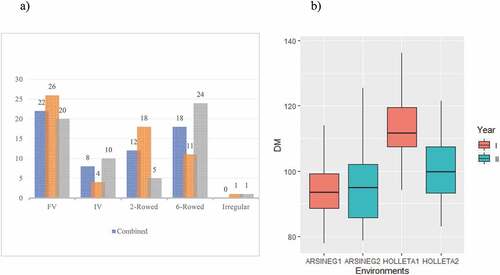
Phenological traits in crops like barley are complex and pair the development of the crop with the growing conditions, which in turn influences the adaptation of the crop to a particular environment and ultimately the yield (Przulj et al., Citation2013). The lines in our experiment showed considerable variation for all the phenological traits. This result accords with the findings of (Megersa et al., Citation2015) who reported significant and wider variation for days to heading and maturity. The average number of days to maturity was different over years and locations. The lowest average value was recorded in year I at Arsi Negelle (Figure , panel b) and the latest was recorded in year I at Holetta. Days to maturity was shorter in the first year than in the second year at Arsi Negelle. Considering the location average, lines matured earlier at Arsi Negelle than at Holetta. The earliest line at Arsi Negelle Accn# 17,254 was 10 days earlier than the earliest line at Holetta, which was the same line. Similarly, the latest line HB-42 at Arsi Negelle was seven days earlier than the latest at Holetta (Accn#216,008). This was derived from the fact that Aris Negelle is located in the Rift valley belt, where the lines had a chance to accumulate higher degree days as compared to Holetta which was located in the central highland (Martín-Forés et al., Citation2018). A significant difference among locations tested with a difference of more than 20 days to mature of the same variety HB-1963 as a result of the difference in the agroecology of the two locations tested was reported by (Bogale et al., Citation2021). Przulj et al. (Citation2013) reported that the variation in temperature and photoperiod gave rise to large differences in the length of the growing season. The earliest line in our study was a two-rowed barley type and this was in disagreement with the findings of (Kaur et al., Citation2022) who reported the two-rowed varieties took more days to mature as compared to the six-rowed varieties.
We found lines that matured as early as 85 days (Accn#17,254, Accn#243,611) and all the top 30 early lines across environments matured at most in three months (Table S1). Cultivar HB-42 was found to be the latest (123.3 days) maturing line, making the difference between the latest and the earliest higher than 40 days. Interestingly, line Accn#17,254 derived from a farmers’ variety was 13 days earlier than the earliest improved variety HB-1553. In line with this (Megersa et al., Citation2015) reported considerably high variation for phenological traits which was more noticeable in the farmers’ varieties compared to improved varieties that all were late maturing. Line Accn# 35,284, which is in the top 30 for grain yield with a non-significant difference from the best line (HB-1307) matured in less than 90 days. Particularly in this era of climate change, such lines that combine little or low yield penalty with earliness can best fit environments that are characterized by terminal moisture stress not exhibiting a considerable trade-off between grain yield and earliness. Some of the lines matured even in less than 3 months, others took more than four months. This combination of maturity time is an important building block for germplasm enhancement activities. A research effort aimed at evaluating the performance of these lines with early maturity in low moisture stress areas could be of great importance to address the farmers’ needs in this type of environment. Bleidere et al. (Citation2012) reported significant variation among barley genotypes for days to heading and maturity.
3.2. Correlation among traits
To assess the association among pheno-agronomic traits, correlation coefficients were calculated based on BLUP mean pooled over the four environments (Figure ). High, positive and significant correlations were observed for all phenological traits, up to r = 0.99 for booting and heading date. Similarly, a high positive and significant correlation between days to heading and maturity was reported by (Megersa et al., Citation2015). A positive significant correlation was also reported by (Kaur et al., Citation2022) between spike emergence and days to maturity where r = 0.58 in the entire set of 6778 barley accessions and r = 0.69 in the core set. The correlation among agronomic traits was lower, though significant. A positive correlation was observed between spike length and thousand kernel weight (r = 0.47); grain yield and biomass (r = 0.38), suggesting that farmer varieties were selected to provide both traits (Bano et al., Citation2017). This finding is in agreement with the findings of (Bogale et al., Citation2021) who reported a significant and positive correlation among agronomic traits (r = 0.88** between grain and biomass yield) Expectedly, the longer the grain filling period, the higher the final yield (r = 0.31), while kernel number negatively affects the kernel size (r = −0.72). This is maybe one of the distinctions between the 2-row and 6-spike type barley in which case the two-row barley had a lower number of kernels per spike and higher thousand kernel weight, unlike the 6-row spike type.
Figure 3. Above the diagonal correlation coefficients values for pheno-agronomic traits DB = Days to 50% booting, DH = Days to 50% heading, DM = Days to maturity, GFP = grain filling period, NET = number of effective tillers per plant, PH = plant height, SPL = spike length, GY = grain yield, BM = biomass yield, SPS = number of seeds per spike, and TKW = thousand kernel weight. Below the diagonal respective correlation plot between any two traits under study. * = significant at p < 0.05, ** = significant at p < 0.01, *** = significant at p < 0.001.
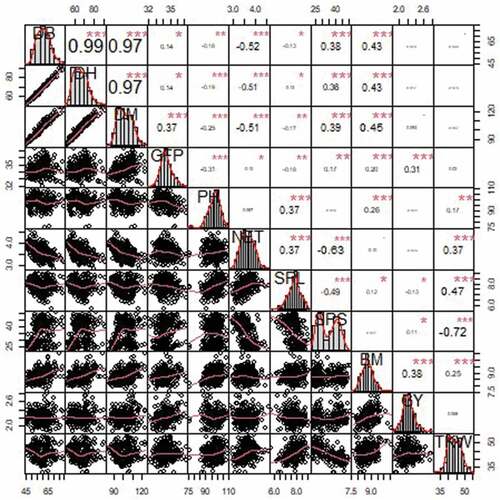
This, in turn, results in the tightly packed seeds around the six-row head tending to be smaller and more variable in size both less desirable traits as they lead to inconsistent malting and less overall extract. Biomass yield showed a high positive correlation with phenological traits (up to r = 0.45 with days to maturity). Grain yield had a low, positive, and significant correlation with days to heading and maturity and agreed with (Žáková & Benková, Citation2006). Derbew (Citation2020) reported a negative and significant correlation between grain yield with days to maturity and grain filling period. According to (Bogale et al., Citation2021) grain yield will increase with a longer period of maturity (r = 0.58**).
3.3. Principal component analysis
Principal component analysis, which is a dimension-reduction tool, was used to reduce the large set of variables to a small set that still contains most of the information of the entire set. Three principal components (PCs) with an eigenvalue greater than one, explained about 70% of the total variation with the respect to 10 measured traits (Table ). PC1 and PC2 explained 37% and 20% of the variation respectively. Abebe et al. (Citation2010) reported three principal components contributing 73% of the variation and the first PC contributing 32% of the variation. On the other hand (Yadav et al., Citation2018) reported the first four PCs with eigenvalue ≥ 1 accounted for 69.8 % of the total variance.
Table 2. Eigenvectors with the first three principal components (PCs) and their corresponding proportion of variance explain the variation among the barley lines using pheno-agronomic traits
In each of the three PCs, traits contribution was variable in the current study, PC1 was most affected by phenology traits and days to maturity having the highest load. The first PC according to (AA Dido et al., Citation2020) was heavily loaded by days to heading in the negative direction and other agronomic traits such as plant height, thousand kernel weight, grain yield and peduncle length had greater contributions in the positive direction. PC2 was positively related to yield and yield components, including biomass, while it was negatively related to the number of seeds per spike. According to the findings of (Gadissa et al., Citation2021), the second PC had high factor loading from single leaf area, flag leaf length, and leaf width. Grain filling period and grain yield were found to strongly affect PC3, but other phenologic and agronomic traits, like plant height, spike length, and the number of seeds per spike, affected negatively. In this analysis as PC1 accounts for a larger proportion of the variability, traits with higher loading in the first PCs contribute a higher proportion of the phenotypic variation among lines under evaluation. In our case, crop development traits and the number of kernels per spike were the traits with the highest loadings in PC1 but not limited to as these traits are highly associated with other qualitative traits as spike type (Derbew, Citation2020). In this case, the two-row spike type barley matures earlier than the six-row and the six-row spike type of barley produces a higher number of seeds than the two-row. This justified the higher contribution of these traits (crop development and the number of kernels per spike) for the observed variation among lines and hence these traits could be used as a basis for selection. This result was in agreement with previous findings (Bedasa et al., Citation2015; Derbew, Citation2020; Enyew et al., Citation2019; Kaur et al., Citation2022). Abebe et al. (Citation2010) reported days to head, maturity and thousand kernel weight were the main contributors to the observed variation among 199 barley genotypes studied. Similarly (Shtaya & Abdallah, Citation2021) reported crop development traits (days to stem elongation, days to heading and maturity) account for a larger proportion of the variability as these traits exhibited higher loading in the first PC.
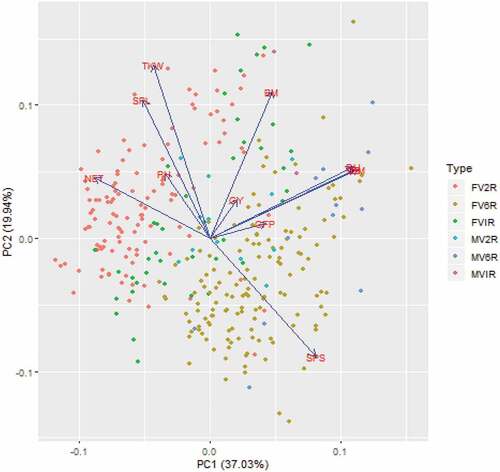
The line-by-trait bi-plot analysis (Figure ) represents traits as vectors and a line as a point, where the origin of the biplot represents average values for all traits investigated (Delacy et al., Citation2000). An angle of 90° or less between any two vectors (traits) indicates a positive correlation whereas an angle greater than 90° signifies a negative correlation. The biplot analysis in the current experiment clearly showed how the phenology traits had a positive correlation with one another. But earliness was negatively correlated with grain yield in the PC1 and PC2 bi-dimensional space. Expectedly, thousand kernel weight and the number of seeds per spike exhibited a negative correlation. This can depict from the biplot that lines in the bottom right were dominated by the 6-rowed spike type (as referred to by the legend) of barley with a higher number of seeds per spike. On the contrary, the majority of the lines at the top left were 2-rowed spike-type barley with higher grain weight and a lower number of seeds per spike. The lines placed in the top right corner of the plot were those combining higher grain yield and biomass and may be prioritized by breeding programs targeting farmers’ needs.
Figure 4. PCA analysis based on the BLUP means of 11 pheno-agronomic traits. The vectors are traits and the dots as per the colour in the legend represent the individual line. DB = Days to 50% booting, DH = Days to 50% heading, DM = Days to maturity, PH = plant height, NET = number of effective tillers per plant, SPS = number of seeds per spike, SPL = spike length, GY = grain yield, BM = biomass yield, TKW = thousand kernel weight, FV2R = Farmer variety with two-row spike type, FV6R = Farmer variety with six-rowed spike type, FVIR = Farmer variety with irregular spike type, MV2R = Cultivars with two-rowed spike type, MV6R = Cultivars with six-rowed spike type, MVIR = Cultivars with 6-rowed spike type.
3.4. Cluster analysis
Cluster analysis of 320 barley lines included in the panel using Ward amalgamation methods based on BLUP mean over the four test environments, revealed that the lines could be grouped in ten clusters (Table ), with variable cluster membership. The highest inter-cluster distance was observed between clusters IV and VIII (46.88) and the lowest was between clusters II and III (9.14).
Table 3. Intra (diagonal and boldface) and inter (off-diagonal) cluster distance (D2) values of the ten cluster groups of the 320 barley lines and the number of lines in each cluster
The intra-cluster distance ranged from 4.22 (cluster VIII) to 8.61 (cluster IX). This perhaps stems from the fact that cluster VIII was composed totally of two-row barley types with 86% belonging to lines from farmers’ varieties while cluster IX was composed of all three barley spike types. Early maturing lines are grouped in cluster I and late maturing lines are grouped in cluster IV. High-yielding lines grouped in cluster IV and cluster X was found to be the cluster with the lowest cluster mean for grain yield (Table S3). Cluster I with 73 observations (23%) was the largest cluster and cluster X with 8 observations (3%) was the smallest (Table S2).
Cluster analysis disaggregated the barley lines based on spike type in such a way that two-row spike type of barley lines was dominating in cluster I (60/73), cluster VI (18/19), cluster VII (19/35), cluster VIII (15/15), and cluster IX (11/17). Six-row type of barley lines was more concentrated in cluster II (20/29), cluster III (53/56), cluster IV (17/17), and cluster V (49/50). Barley lines with irregular spike type were dominant in cluster X (5/8), however, barley lines with such spike type in cluster VII were higher in number (11/35) than they are in any cluster but in this cluster two-row, spike type barley was the highest (19/35). Compared to other clusters two-row improved varieties were higher in number in cluster IX (9/17) and six-row improved varieties were high in cluster IV (7/17). This finding was in congruence with the results of (Kumar et al., Citation2020) who reported the cluster analysis disaggregated the barley genotypes based on spike row type where four out of eight clusters were composed of two-row types and the remaining four clusters had six-row types. On the contrary, the finding was in disagreement with the findings of (Kaur et al., Citation2019) who reported the identified four clusters distinguished accessions from different geographic areas and suggested a fair association between genetic diversity and geographic diversity. Besides, they reported that the clustering result couldn’t differentiate the accessions based on spike row type and naked versus covered caryopsis. The low intra-cluster distance bold diagonal values (Table ) and low coefficient of variation in each cluster for all of the pheno-agronomic traits (Table S3) disclosed the variation among the lines within the cluster was minimal which in turn suggests ten clusters were the optimal number of clusters. Kumar et al. (Citation2021) also reported that inter-cluster distance was higher than intra-cluster distance and suggested wider genetic diversity between the clusters than it was within the clusters.
The cluster with the highest cluster mean for grain yield was found to be dominated by the six-row spike type. However, the cluster with the second-highest cluster mean (whose coefficient of variation was half as big as the coefficient of variation of the cluster with the highest cluster mean for grain yield) was dominated by the two-row spike type barley. This supports the findings of Le (Citation1992) and Arisnabarreta and Miralles (Citation2006) that suggested the two-row barley types compensated for the three-fold grain yield advantage of the six-row barley types (Pourkheirandish & Komatsuda, Citation2007) by higher tillering capacity. The highest intra-cluster distance, cluster VIII (8.61) which was smaller than the lowest inter-cluster distance (between cluster I and II = 9.23) showed an overall lower intra-cluster distance. This together with a lower coefficient of variation for each of the ten clusters dictated lines within the cluster were homogenous as a result selection and crossing lines within the cluster may not be responsive. On the contrary crossing lines from clusters with high inter-cluster distance may result in a highly segregating population (Demissie & Bjørnstad, Citation1996; Muhe & Assefa, Citation2011; Negassa, Citation1985). This grouping of the barley genotypes generally doesn’t follow any zonal or regional pattern in which case genotypes from the different zones and regions appeared in the same cluster (Gadissa et al., Citation2021). In line with this finding (Yadav et al., Citation2018) also reported that landrace aggregation was independent of the geographic source of collection. Genotypes from Arsi were grouped into all clusters except C-VIII and genotypes from west Shewa appeared in all except two justifying genotypes from these zones were more diverse than those that appeared in fewer clusters (Abebe et al., Citation2010).
4. Conclusion
In this study, the result indicated that the barley genotypes were diverse in yield and agro-morphology traits. For grain yield, it was found that the lines from farmers’ variety Accn# 1826 at Arsi Negelle and Accn# 24,970 at Holetta, gave higher yield comparing the performance on the two locations separately and HB-1307 gave better yield than the highest yielding lines combined across locations. It was also showed there were lines from farmer varieties that can mature in less than 85 days. These lines can be used in crossing blocks to combine this desirable trait with the high-yielding varieties to develop early maturing high-yielding varieties. Especially for those locations which are characterized by terminal moisture stress genotypes as early as line Accn#17,254 will suit the most. The best early farmer variety was 13 days earlier than the best early cultivar. Hence, we argue against the general notion that farmers’ varieties are inferior with respect to grain yield and late with the respect to maturity as compared to the improved varieties based on the aforementioned facts. Having the improved barley gene pool largely from international nurseries and yield trials, combining the improved and elite materials with farmers’ varieties may complement minimizing the existing gap between the local and improved barley gene pool and hence contributing to the productivity of the crop.
Authors contribution
BF, CF, EP, and MD conceived and designed the study. BF and TW assembled the diversity panel and participated in phenotyping. BF carried out the data analysis and drafted the manuscript. All co-authors participated in interpreting the data and revising and editing the manuscript.
Availability of data and material
The data sets supporting the results of this article are included in this manuscript as supplementary information and additional file 1 and 2.
Supplemental Material
Download Zip (45.6 KB)Acknowledgements
The authors are grateful to the Ethiopian Biodiversity Institute and Holetta Agricultural Research Institute for the provision of barley planting material used in the study. The first author is further indebted to Scuola Superiore Sant’ Anna and Bioversity International for the training provided.
Disclosure statement
No potential conflict of interest was reported by the author(s).
Supplementary material
Supplemental data for this article can be accessed online at https://doi.org/10.1080/23311932.2022.2157104
Additional information
Funding
References
- Abebe, T. D., Bauer, A. M., & Léon, J. (2010). Morphological diversity of Ethiopian barleys (Hordeum vulgare L.) in relation to geographic regions and altitudes. Hereditas, 147(4), 154–18. https://doi.org/10.1111/j.1601-5223.2010.02173.x
- Aberg, E., & Wiebe, G. A. (1946). Classification of barley varieties grown in the United States and Canada in 1945. 1–190.
- Al-Abdallat, A., Karadsheh, A., Hadadd, N., Akash, M., Ceccarelli, S., Baum, M., Hasan, M., Jighly, A., & Abu Elenein, J. (2017). Assessment of genetic diversity and yield performance in Jordanian barley (Hordeum vulgare L.) landraces grown under Rainfed conditions. BMC Plant biology, 17(1), 1–13. https://doi.org/10.1186/s12870-017-1140-1
- Alqudah, A. M., Koppolu, R., Wolde, G. M., Graner, A., & Schnurbusch, T. (2016). The genetic architecture of barley plant stature. frontiers in Genetics, 7, 1–15. https://doi.org/10.3389/fgene.2016.00117
- Al-Sayaydeh, R., Al-Bawalize, A., Al-Ajlouni, Z., Akash, M. W., Abu-Elenein, J., & Al-Abdallat, A. M. (2019). Agronomic evaluation and yield performance of selected Barley (Hordeum vulgare L.) Landraces from Jordan. international Journal of Agronomy, 2019, 1–12. https://doi.org/10.1155/2019/9575081
- Alvarado, G., López, M., Vargas, M., Á, P., Rodríguez, F., Burgueño, J., & Crossa, J. (2019). META-R (Multi Environment Trail Analysis with R for Windows). Version 6.04.
- Arisnabarreta, S., & Miralles, D. J. (2006). Crop ⁄ Forage ⁄ Soil Management ⁄ Grassland Utilisation Yield Responsiveness in two- and six-rowed barley grown in contrasting nitrogen environments. journal of Agronomy and Crop science, 192(3), 178–185. https://doi.org/10.1111/j.1439-037X.2006.00203.x
- Asfaw, Z. (1988). Variation in the morphology of the spike within Ethiopian Barley, Hordeum vulgare L. (Poaceae). Acta Agriculturae Scandinavica, 38(3), 277–288. https://doi.org/10.1080/00015128809437989
- Asfaw, Z. (2000). The barleys of Ethiopia. In S. B. Brush (Ed.), Genes in the field. On-farm conservation of crop diversity (pp. 77–107). LEWIS publishers.
- Asfaw, Z. (2008). Relationships between spike morphology, hordeins and altitude within Ethiopian barley, Hordeum vulgare L. (Poaceae). Hereditas, 110(3), 203–209. https://doi.org/10.1111/j.1601-5223.1989.tb00782.x
- Bano, S., Kaleri, A., Raheela, R., Memon, S., Raja, R., A, R., Latif Laghari, A., Ali Chandio, I., & Nazeer, S. (2017). Analysis of correlation and regression among M2 wheat mutant population for yield and its associated traits. journal of Basic & Applied Sciences, 13, 522–526. https://doi.org/10.6000/1927-5129.2017.13.85
- Bedasa, M., Berhane, L., & Tadesse, D. (2015). Morphological diversity and association of traits in ethiopian food barley (Hordeum vulgare l.) landraces in relation to regions of origin and altitudes. journal of Plant breeding and Crop science, 7(2), 44–54. https://doi.org/10.5897/JPBCS2014.0480
- Bleidere, M., Mežaka, I., Legzdiņa, L., Grunte, I., Beinaroviča, I., & Rostoks, N. (2012). Variation of spring barley agronomic traits significant for adaption to climate change in latvian breeding programmes. Proceedings of the Latvian Academy of Sciences, Section B: Natural, Exact, and Applied Sciences, 66, 30–35. https://doi.org/10.2478/v10046-011-0043-z
- Bogale, A. A., Niguse, K., Wasae, A., & Habitu, S. (2021). Response of Malt Barley (Hordeum distichum L) varieties to different row spacing under contrasted environments of North Gondar, Ethiopia. international Journal of Agronomy, 2021, 1–12. https://doi.org/10.1155/2021/6696470
- Bothmer, R., Jacobsen, N., Baden, C., & Jorgensen, R. (1991). An Ecogeographical Study of the Genus Hordeum. 131. https://www.cabdirect.org/cabdirect/abstract/19916779537
- CB, S. R. K. (1985). Bioemetrical methods in quantitative genetic analysis. Kalyani Publishers.
- Ceccarelli, S. (1989). Wide adaptation: How wide? Euphytica, 40(3), 197–205. https://doi.org/10.1007/BF00024512
- Ceccarelli, S., & Grando, S. (1991). Environment of selection and type of germplasm in barley breeding for low-yielding conditions. Euphytica, 57(3), 207–219. https://doi.org/10.1007/BF00039667
- Choi, H., Esser, A., & Murphy, K. M. (2020). Genotype × environment interaction and stability of β-glucan content in barley in the Palouse region of eastern Washington. Crop science, 60(5), 2500–2510. https://doi.org/10.1002/csc2.20181
- CSA. (2021). The Federa Democratic Republic of Ethiopia Report on Area and Production of Majr Crops. I.
- Delacy, I. H., Skovmand, B., & Huerta, J. (2000). Characterization of Mexican wheat landraces using agronomically useful attributes. genetic Resources and Crop evolution, 47(6), 591–602. https://doi.org/10.1023/A:1026550624037
- Demissie, A., & Bjørnstad, A. (1996). Phenotypic diversity of Ethiopian barleys in relation to geographical regions, altitudinal range, and agro-ecological zones: As an aid to germplasm collection and conservation strategy. Hereditas, 124(1), 17–29. https://doi.org/10.1111/j.1601-5223.1996.00017.x
- Derbew, S. (2020). Multivariate analysis of hulled barley (Hordeum vulgare L.) landraces of Southern Ethiopia. Cogent Food & Agriculture, 6(1). https://doi.org/10.1080/23311932.2020.1841357
- Dido, A., Degefu, D., Assefa, E., Krishna, M., Singh, B., & Tesfaye, K. (2021). Spatial and temporal genetic variation in Ethiopian barley (Hordeum vulgare L.) landraces as revealed by simple sequence repeat (SSR) markers. agriculture & Food security, 10(1), 1–14. https://doi.org/10.1186/s40066-021-00336-3
- Dido, A. A., Degefu, D. T., Singh, B. J. K., Tesfaye, K., & Krishna, M. S. R. (2020). Multivariate analysis of quantitative characters variability in ethiopian barley (Hordeum vulgare L.) Landrace: Based on regions and altitude. ABI Genetika, 52(2), 597–620. https://doi.org/10.2298/GENSR2002597D
- Dodig, D., Kandić, V., Zorić, M., Nikolić-Dorić, E., Nikolić, A., Mutavdžić, B., Perović, D., & Šurlan-Momirović, G. (2018). Comparative kernel growth and yield components of two-A nd six-row barley (Hordeum vulgare) under terminal drought simulated by defoliation. Crop and Pasture science, 69(12), 1215–1224. https://doi.org/10.1071/CP18336
- Dorostkar, S., Pakniyat, H., Ahmadi Kordshooli, M., Aliakbari, M., Sobhanian, N., Ghorbani, R., & Eskandari, M. (2015). Study of relationship between grain yield and yield components using multivariate analysis in barley cultivars (Hordeum vulgare L.). International Journal of Agronomy and Agricultural Research, 6, 240–250. https://www.academia.edu/12650102
- Ebadi-Segherloo, A., Mohammadi, S. A., & Sadeghzadeh, B. (2016). Study of heritability and genetic advance of agronomic traits in Barley (Hordeum Vulgare L.) and graphic analysis of trait relations by Biplot = (Hordeum Vulgare L.). Jordan Journal of Agricultural Sciences, 12, 299–310. https://doi.org/10.12816/0030370
- Elakhdar, A., Kumamaru, T., Smith, K. P., Brueggeman, R. S., Capo-chichi, L. J. A., & Solanki, S. (2017). Genotype by environment interactions (GEIs) for barley grain yield under salt stress condition. journal of Crop science and Biotechnology, 20(3), 193–204. https://doi.org/10.1007/s12892-017-0016-0
- Enyew, M., Dejene, T., Lakew, B., & Worede, F. (2019). Clustering and principal component analysis of Barley (Hordeum volugare L.) Landraces for major morphological traits from North Western Ethiopia. international Journal of Agricultural Science and Food technology, 5(1), 058–63. https://doi.org/10.17352/2455-815X.000043
- Eticha, F., Grausgruber, H., & Berghoffer, E. (2010). Multivariate analysis of agronomic and quality traits of hull-less spring barley (Hordeum vulgare L.). Journal of Plant Breeding and Crop Science, 2, 81–95. https://www.academicjournals.org/journal/JPBCS/article-abstract/49D07B23218
- Fekadu, W., Mekbib, F., Lakew, B., & Haussmann, B. I. G. (2022). Genotype × environment interaction and yield stability in barley (Hordeum vulgare L.) genotypes in the central highland of Ethiopia. journal of Crop science and Biotechnology. https://doi.org/10.1007/s12892-022-00166-0
- Gadissa, F., Abebe, M., & Bekele, T. (2021). Agro ‑ morphological traits ‑ based genetic diversity assessment in Ethiopian barley (Hordeum vulgare L .) landrace collections from Bale highlands, Southeast Ethiopia. Agriculture and Food Security, 1–14. https://doi.org/10.1186/s40066-021-00335-4
- Graner, A., Bjørnstad, A., Konishi, T., & Ordon, F. (2003). The domestication of cultivated barley in: Von Bothmer et Al(Eds) diversity in Barley Hordeum. Elsevier B.V.
- Hadado, T. T., Rau, D., Bitocchi, E., & Papa, R. (2009). Genetic diversity of barley (Hordeum vulgare L.) landraces from the central highlands of Ethiopia: Comparison between the Belg and Meher growing seasons using morphological traits. genetic Resources and Crop evolution, 56(8), 1131–1148. https://doi.org/10.1007/s10722-009-9437-z
- Hammami, Z., Sbei, H., Kadri, K., Jmel, Z., Sahli, A., Fraj, M. B., Naser, H., Da Silva JA, T., & Trifa, Y. (2016). Evaluation of performance of different barley genotypes irrigated with saline water in South Tunisian Saharan conditions. environmental and Experimental Biology, 14(1), 15–21. https://doi.org/10.22364/eeb.14.03
- Hilmarsson, H. S., Rio, S. Y., & Sánchez, J. I. (2021). Genotype by environment interaction analysis of agronomic spring barley traits in Iceland using ammi, factorial regression model and linear mixed model. Agronomy, 11(3), 499. https://doi.org/10.3390/agronomy11030499
- Hummer, K. E., & Hancock, J. F. (2015). Vavilovian centers of plant diversity: Implications and impacts. HortScience, 50(6), 780–783. https://doi.org/10.21273/HORTSCI.50.6.780
- IPGRI. (1994). Descriptors for Barley (Hordeum Vulgare L.) International plant genetic resources institute. IPGRI.
- Kaur, V., Aravind, J., Manju, J. S. R., Kumari, J., Panwar, B. S., Pal, N., Rana, J. C., Pandey, A., & Kumar, A. (2022). Phenotypic characterization, genetic diversity assessment in 6,778 accessions of barley (Hordeum vulgare L. ssp. vulgare) germplasm conserved in national genebank of India and development of a core set. frontiers in Plant science, 13, 1–17. https://doi.org/10.3389/fpls.2022.771920
- Kaur, V., Kumari, J. M. R., Jacob, S., & Panwar, B. S. (2019). Genetic diversity analysis of indigenous and exotic germplasm of barley (Hordeum vulgare L.) and identification of trait specific superior accessions. Wheat & Barley Research, 10. https://doi.org/10.25174/2249-4065/2018/83620
- Kebebew, F., Tsehaye, Y., & McNeilly, T. (2001). Morphological and farmers cognitive diversity of barley (Hordeum vulgare L. [Poaceae]) at Bale and North Shewa of Ethiopia. genetic Resources and Crop evolution, 48(5), 467–481. https://doi.org/10.1023/A:1012082812073
- Kumar, Y., Niwas, R., Nimbal, S., & Dalal, M. S. (2020). Hierarchical cluster analysis in barley genotypes to delineate genetic diversity. Electronic Journal of Plant Breeding, 11, 742–748. https://doi.org/10.37992/2020.1103.122
- Kumar, Y., Sehrawat, K. D., Singh, J., & Shehrawat, S. (2021). Identification of promising barley genotypes based on morphological genetic diversity. Journal of Cereal Research, 13(1), 79–88. https://doi.org/10.25174/2582-2675/2021/108051
- Lakew, B., Semeane, Y., Alemayehu, F., Gebre, H., Grando, S., Van Leur, J. A. G., & Ceccarelli, S. (1997). Exploiting the diversity of barley landraces in Ethiopia. Genetic Resources and Crop Evolution, 44(2), 109–116. https://doi.org/10.1023/A:1008644901982
- Le, G. J. (1992). A comparison between two- and six-row winter barley genotypes for above-ground dry matter production (1992). Agronomie, EDP Sciences, 12(2), 163–171. https://hal.archives-ouvertes.fr/hal-00885463/document
- Liller, C. B., Neuhaus, R., Von Korff, M., Koornneef, M., & Van Esse, W. (2015). Mutations in barley row type genes have pleiotropic effects on shoot branching. PLoS One, 10(10), 1–20. https://doi.org/10.1371/journal.pone.0140246
- Martín-Forés, I., Casado, M. A., Castro, I., Del Pozo, A., Molina-Montenegro, M. A., de Miguel, J. M., & Acosta-Gallo, B. (2018). Variation in phenology and overall performance traits can help to explain the plant invasion process amongst Mediterranean ecosystems. NeoBiota, 41, 67–89. https://doi.org/10.3897/neobiota.41.29965
- Mascher, M., Gundlach, H., Himmelbach, A., Beier, S., Twardziok, S. O., Wicker, T., Radchuk, V., Dockter, C., Hedley, P. E., Russell, J., Bayer, M., Ramsay, L., Liu, H., Haberer, G., Zhang, X. Q., Zhang, Q., Barrero, R. A., Li, L., Taudien, S., … Stein, N. (2017). A chromosome conformation capture ordered sequence of the barley genome. Nature, 544(7651), 427–433. https://doi.org/10.1038/nature22043
- Matin, M. Q. I., Amiruzzaman, M., Billah, M. M., Banu, M. B., Naher, N., & Choudhury, D. A. (2019). Genetic variability and path analysis studies in Barley (Hordeum vulgare L.). international Journal of Applied Sciences and Biotechnology, 7(2), 243–247. https://doi.org/10.3126/ijasbt.v7i2.24635
- Megersa, G., Mekbib, F., & Lakew, B. (2015). Performance of farmers and improved varieties of barley for yield components and seed quality. Journal of Plant Breeding and Crop Science, 7, 107–124. https://doi.org/10.5897/JPBCS2013.0436
- Mekonnen, Z., Tadesse, H., Woldeamanuel, T., Asfaw, Z., & Kassa, H. (2018). Land use and land cover changes and the link to land degradation in Arsi Negele district, Central Rift Valley, Ethiopia. Emote Sensing Applications: Society and Environment, 12, 1–9. https://doi.org/10.1016/j.rsase.2018.07.012
- Muhe, K., & Assefa, A. (2011). Diversity and agronomic potential of barley (Hordeum vulgare L.) landraces in variable production system, Ethiopia. World Journal of Agricultural Sciences, 7, 599–603. https://www.idosi.org/wjas/wjas7(5)/12.pdf
- Muluken, B., Habtamu, Z., & Alemayehu, A. (2010). Genotype by environment interactions (G X E) and stability analyses of malting barley (Hordeum Distichon L .) GENOTYPES across Northwestern Ethiopia. Ethiopian Journal of Agricultural Science, 168–178. file:///C:/Users/HP/Downloads/Mulukenpublication-1.pdf
- Naser, M., Badran, M., Abouzied, H., Ali, H., & Elbasyoni, I. (2018). Phenotypic and physiological evaluation of two and six rows barley under different environmental conditions. Plants, 7(2), 39. https://doi.org/10.3390/plants7020039
- Negassa, M. (1985). Patterns of phenotypic diversity in an Ethiopian barley collection, and the Arussi‐Bale Highland as a center of origin of barley. Hereditas, 102(1), 139–150. https://doi.org/10.1111/j.1601-5223.1985.tb00474.x
- Nowosad, K., Tratwal, A., & Bocianowski, J. (2018). Genotype by environment interaction for grain yield in spring barley using additive main effects and multiplicative interaction model. Cereal research Communications, 46(4), 729–738. https://doi.org/10.1556/0806.46.2018.046
- Olivoto, T., Lúcio, A. D. C., da Silva, J. A. G., Marchioro, V. S., de Souza, V. Q., & Jost, E. (2019). Mean performance and stability in multi-environment trials i: Combining features of AMMI and BLUP techniques. agronomy Journal, 111(6), 2949–2960. https://doi.org/10.2134/agronj2019.03.0220
- Pour-Aboughadareh, A., Barati, A., Koohkan, S. A., Jabari, M., Marzoghian, A., Gholipoor, A., Shahbazi-Homonloo, K., Zali, H., Poodineh, O., & Kheirgo, M. (2022). Dissection of genotype-by-environment interaction and yield stability analysis in barley using AMMI model and stability statistics. bulletin of the National Research Centre, 46(1). https://doi.org/10.1186/s42269-022-00703-5
- Pourkheirandish, M., & Komatsuda, T. (2007). The importance of barley genetics and domestication in a global perspective. annals of Botany, 100(5), 999–1008. https://doi.org/10.1093/aob/mcm139
- Przulj, N., Crops, V., Momcilovic, V., & Perovic, D. (2013). Advance in Barley sciences. Advance of Barley Science. https://doi.org/10.1007/978-94-007-4682-4
- R core team. R statistical software version R.3.6.1. 2019.
- Ren, X., Sun, D., Sun, G., Li, C., & Dong, W. (2013). Molecular detection of QTL for agronomic and quality traits in a doubled haploid barley population. Australian Journal of Crop Science, 7, 878–886. https://www.cropj.com/sun_7_6_2013_878_886.pdf
- Rodriguez, M., Rau, D., Papa, R., & Attene, G. (2008). Genotype by environment interactions in barley (Hordeum vulgare L.): Different responses of landraces, recombinant inbred lines and varieties to Mediterranean environment. Euphytica, 163(2), 231–247. https://doi.org/10.1007/s10681-007-9635-8
- Shtaya, M. J. Y., & Abdallah, J. M. (2021). Assessment of phenotypic diversity of barley genotypes through cluster and principal component analyses. Journal of Animal and Plant Sciences, 31, 1345–1351. https://doi.org/10.36899/JAPS.2021.5.0336
- Sneath, P., & Sokal, R. (1973). Numerical taxonomy. The Principles and Practice of Numerical Classification. https://www.amazon.com/Numerical-Taxonomy-Principles-Practice-Classification/dp/0716706970
- Tadesse, D., & Derso, B. (2019). The status and constraints of food barley production in the North Gondar highlands, North Western Ethiopia. agriculture & Food security, 8(1). https://doi.org/10.1186/s40066-018-0248-3
- UPOV. (1994). International union for the protection of New Varieties DUS for Barley: Free download. Ebooks Library. On-line Books Store on Z-Library. https://www.upov.int/portal/index.html.en
- Vavilov, N. I. (1992). The origin, variation, immunity and breeding of cultivated plants translated from Russian by K.Starr Chester. Chronica botanica, 13, 364. https://agris.fao.org/agris-search/search.do?recordID=US201300077173
- Ward, J. H. (1963). Hierarchical grouping to optimize an objective function. journal of the American Statistical Association, 58(301), 236–244. https://doi.org/10.1080/01621459.1963.10500845
- Wosene, G. A., Berhane, L., Bettina, I. G. H., & Karl, J. S. (2015). Ethiopian barley landraces show higher yield stability and comparable yield to improved varieties in multi-environment field trials. journal of Plant breeding and Crop science, 7(8), 275–291. https://doi.org/10.5897/JPBCS2015.0524
- Yadav, R. K., Gautam, S., Palikhey, E., Joshi, B. K., Ghimire, K. H., & Gurung, R. (2018). Agro ‑ morphological diversity of Nepalese naked barley landraces. Agriculture and Food Security, 1–12. https://doi.org/10.1186/s40066-018-0238-5
- Yahiaoui, S., Cuesta-Marcos, A., Gracia, M. P., Medina, B., Lasa, J. M., Casas, A. M., Ciudad, F. J., Montoya, J. L., Moralejo, M., Molina-Cano, J. L., & Igartua, E. (2014). Spanish barley landraces outperform modern cultivars at low-productivity sites. Plant Breeding, 133(2), 218–226. https://doi.org/10.1111/pbr.12148
- Yan, W., & Frégeau-Reid, J. (2018). Genotype by Yield*Trait (GYT) Biplot: A novel approach for genotype selection based on multiple traits. Scientific Reports, 8(1), 1–10. https://doi.org/10.1038/s41598-018-26688-8
- Žáková, M., & Benková, M. (2006). Characterization of spring barley accessions based on multivariate analysis. Communications in Biometry and Crop Science, 1, 124–134. https://agrobiol.sggw.waw.pl/~cbcs/articles/CBCS_1_2_8.pdf
- Zeng, X. Q. (2015). Genetic variability in agronomic traits of a germplasm collection of hulless barley. Genetics and Molecular Research, 14(4), 18356–18369. https://doi.org/10.4238/2015.December.23.23