
 ?Mathematical formulae have been encoded as MathML and are displayed in this HTML version using MathJax in order to improve their display. Uncheck the box to turn MathJax off. This feature requires Javascript. Click on a formula to zoom.
Abstract
Honey is a health-giving natural product. Researchers are curious to study the processing mechanisms of honey without harming its quality. This study focused on the effect of thermal treatments on the poly-floral honey obtained from Chire Woreda, Sidamo regional state, Ethiopia. The collected research material was processed with different thermal treatments, and the quality parameters were checked. However, before conducting the experiment a preliminary assessment was conducted in the selected Woreda to determine the exact heating temperature and time committed by the beekeepers. Based on the information generated the research material was thermally treated at a temperature and time of 55 & 95°C for 0.5 h, 1 h, and 2 h respectively. The quality parameters (physicochemical properties, total phenolic, total flavonoid contents, and antioxidant activities) were determined by the standard methods, and the values were compared against the national and international standard limits. JMP pro 13 and origin software were used for statistical analysis. The study revealed that heating honey with a high temperature and prolonged time exhibits a significant effect on the quality. The HMF, free acid, total phenolic, total flavonoid, and antioxidant potential of honey were increased after thermal treatments, but, the moisture, diastase activity, and the sugar contents including reducing and non-reducing were measured with low value when the thermal treatments are increased; and this indicated that thermal treatment has both positive and negative effects on the honey quality. Therefore, identifying the optimum processing time and temperature is very important in maintaining the quality of honey.
1. Introduction
Honey is a delicious naturally produced substance by honey bees from the blossomed flower either uni-floral/multi-flora, and this makes honey to be a traditional medicinal product that can escalate the immune system ((Mehdi et al., Citation2019). According to Saba et al. (Citation2013), honey contains both macro- and micronutrients including phenolic compounds.
The different types of agro-climatic condition and biodiversity are critical for the reality of the different type of honeybee flora and honeybees. The immense agro-climatic conditions of Ethiopia make the country to be known as one of the top honey producers in the world, and basically three types (red, white, and yellow) of honey are produced in the country . According to Dagnaygebaw and Tariku (Citation2020), in Ethiopia more than one million farmers are engaged in honey production and the annual honey production of the country was estimated more than 45,300 metric tons and this put the country to be the leader of Africa in honey production (Maetz et al., Citation2011). Among the produced honey 80% are used for making tej, a local beverage known as honey wine or honey beer made in the house of farmers and urban area; and the rest 20% of the honey goes for export mainly to the Middle East Countries (Melaku Girma et al., Citation2008).
Currently, Ethiopia is facing a big challenge in producing good-quality honey. Most processed honey found on the shelves of retailers is below the minimum quality standard requirement of the country and the main reasons for this are that 95% of beekeepers follow the traditional method of beekeeping practice and farmers are not committed to getting honey to the market after the harvest; rather, they prefer to store for more than six months until the cost becomes high. A big gap in continuous follow-up and providing of modern hives to the farmers are the challenges that beekeepers are facing to produce good quality of honey (Bizuayehu & Adissu, Citation2021).
Research supported that honey crystallizes in longer storage and crystallized honey is known for its difficulties during filling for packaging. Similarly, crystallized honey is also considered poor in terms of quality, organoleptic properties, and market value (Chanson-Rolle et al., Citation2016). Most beekeepers in Sidama regional state of Ethiopia are always committed to heating honey with uncontrolled time and temperature to de-crystalize the honey in mitigation of the packaging difficulties and transportation to the market. To that end, this study was designed to (1) determine the physicochemical properties, total phenolic and flavonoid contents, and antioxidant activity of thermally treated poly-floral honey and (2) recommend a management system for the use of heating time and temperature in the processing of the honey obtained from the Horaella kebele, Chire Woreda Sidama regional state.
Research supported that honey crystallizes in longer storage and crystallized honey is known for its difficulties during filling for packaging. Similarly, crystallized honey is also considered poor in terms of quality, organoleptic properties, and market value (Chanson-Rolle et al., Citation2016). Most beekeepers in Sidamo regional state of Ethiopia are always committed to heating honey with uncontrolled time and temperature to de-crystalize the honey in mitigation of the packaging difficulties and transportation to the market. To that end, this study was designed to (1) determine the physicochemical, total phenolic and flavonoid contents, and antioxidant activity of thermally treated poly-floral honey obtained from the Horaella kebele, Chire Woreda Sidamo regional state, and (2) to recommend a management system for the use of heating time and temperature in the processing of the honey.
2. Materials and methods
2.1. Study area description
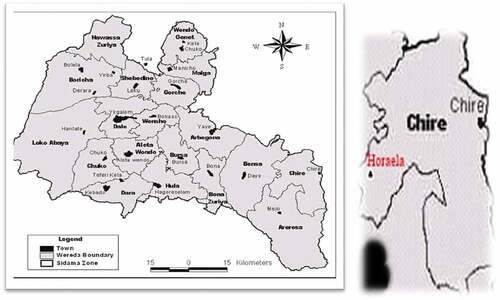
Chire Woreda is one of the districts of Sidama Regional State in South Ethiopia, estimated to be 98.75 km2 (Figure ) and of this 44.85 km2 is covered with a natural and governmental cultivated forest. The forest has created suitable climate conditions that favor high honeybee population density. There are four seasons of the year and two of them are peak seasons for honey harvesting. December to January and May to June are the two peak seasons for honey harvesting and more than 95% of the honey production took place in the peak season.
Figure 1. Study area Map.
2.2. Sampling
Freshly harvested poly floral honey samples (7 kg) were collected from randomly selected bee keepers from Horaella kebele, Chire Woreda, Sidama regional state (Figure ) during the peak production season (December to January, 2020), and the samples were collected using the community packaging materials opaque and sealed plastic container. The collected sample was filtered using muslin cloth to remove the solid particles like wax sticks, dead bees, particles of combs, and other solid materials, and the filtrate was filled into a glass jar and the glass jar was kept in a deep freezer (−20°C) until further treatments.
2.3. Treatments
Before analysis the honey sample was separated into seven sub-samples of about 1 kg each and was packed in glass bottles. Of the total samples, six samples were thermally treated in a temperature-controlled water bath and one sample remained untreated to be used as control. The thermal processing of honey was conducted as indicated in Table . The time and temperature combination were based on the preliminary assessment practiced at the community level. Finally, both unheated and heated honeys were kept in a deep freezer at −20°C until further investigation.
Table 1. Thermal processing of honey samples
2.4. Analysis
2.4.1. pH values
Ten grams of honey sample were dissolved in 75 mL of distilled water in 250 mL beaker and stirred with magnetic stirrer and then, the pH was measured using a digital pH meter (Sartorius Ag, Goettingen-Germany), calibrated at pH 4.0 and 7.0 (Kuliah & Kuliah, Citation2019).
2.4.2. Free acid values
The free acid value was determined according to Kuliah and Kuliah (Citation2019). Ten grams of honey samples were dissolved in 75 mL distilled water in a 250 mL beaker. Samples were titrated against 0.1 N sodium hydroxide solution using phenolphthalein indicator until pink color appeared and persisted for seconds. Free acid value (milli equivalent peroxide/kg oil) was calculated using the following equation:
here FV = free acid, Meq = Milliequivalent, Mw = Molecular weight of Sodium hydroxide, N = Normality of sodium hydroxide, V = Volume of sodium hydroxide and Ws = Weight of Sample
2.4.3. Moisture content
Five grams of honey samples were placed in a dried aluminum dish. Then the samples were dried to constant weight in a hot air oven at 105°C for 4 h (AOAC.1998). Moisture content was calculated as follows.
Where: W0 = weight of the container (g); W1 = weight of the fresh sample + container (g) and W2 = weight of the dried sample + container (g).
2.4.4. HMF content
The hydroxyl-methyl-furfural (HMF) was determined according to Kuliah and Kuliah (Citation2019). Five grams of honey sample were dissolved in 25 mL of water and transferred into a 50 mL volumetric flask. After adding 0.5 mL of Carrez I and 0.5 mL of Carrez II, the solution was made up to 50 mL with water. The solution was filtered through Whatman no. 1 filter paper. Aliquots of 5 mL were put in two test tubes; 5 mL of distilled water were added to one tube (sample solution); 5 mL of 0.2% sodium bisulphite solution were added to the second tube (reference solution). Then using double beam UV-spectrophotometer (HACH LANGE DR 5000) the absorbance of each solution was measured at 284 and 336 nm.
The HMF content was calculated by the following equation:
Where: A284: absorbance at 284 nm; A336: absorbance at 336 nm; 149.7: a factor calculated by the molecular weight of HMF and the mass of the sample; D = Dilution factor; W = Mass of honey sample (g); W = weight of honey sample.
2.4.5. Diastase activity
Diastase activity was determined based on the method of Schade et al. (Citation1958). Ten grams of honey samples, 5 mL of acetate buffer, and 15 mL of water were added into a 50 mL volumetric flask. After adding 3 mL of sodium chloride (0.5 M) the solution was diluted to 50 mL with distilled water. After warming at 40°C, 5 mL of starch solution was added into 10 mL of honey solution. For every 5 min, aliquot was taken and added to 10 mL of iodine solution. The absorbance was measured at 660 nm using a double beam UV- visible spectrophotometer immediately against water blank and a calibration curve was obtained.
The diastase activity was computed as diastase number (DN) as follows:
Where DN = the Gothe/Schade unit which will convert 0.01 g of starch to the prescribed end-point in one hour at 40°C under the conditions of test. tx = reaction time obtained from calibration curve.
2.4.6. Reducing sugar content
The reducing sugar content was determined based on the method of Chanson-Rolle et al. (Citation2016). A 25 g homogeneous honey sample was transferred into a 250 mL volumetric flask and dissolved with distilled water. A 50 mL honey solution was diluted in 100 mL distilled water and 5 mL of Fehling’s solution A and Fehling’s solution B were pipetted into 250 mL volumetric flask containing the solution. Distilled water (8 mL) was added and heated until the boiling started. The solution was titrated using 1 mL of 0.2% of methylene blue indicator while boiling until brick-red color appeared. The percentage of reducing sugar was calculated using the formula developed by Lane and Eynon (Morales et al., Citation2008).
Where T.V (mL) is the titratable volume of honey solution reacted with Fehling solution; W = weight of honey. 0.05 g is 10 mL of Fehling solution (A and B)
Total sugar content
A 50 mL honey sample was transferred into a 250 mL conical flask. A 5 mL of dilute HCl and 50 mL of distilled water was added. The solution was boiled gently for 10 min and cooled. The content was neutralized with 1 N NaOH and titrated with 10 mL of Fehling solution using litmus paper as an indicator. The percentage of total sugar was calculated using the formula developed by Morales et al. (Citation2008)
Where T.V (mL) is the titrable volume of honey solution reacted with Fehling solution, W = weight of honey . 0.05 g is 10 mL of Fehling solution (A and B).
2.4.7. Total sugar content
Fifty mL of juice (prepared for the estimation of reducing sugar) was pipetted into a 250 mL conical flask. 5 mL of dilute HCl solution and 50 mL of distilled water were added. The hydrolysis of sucrose was completed by boiling gently for 10 minutes and then cooling. After neutralizing with 1M NaHOH solution using blue litmus paper as an indicator, the content was transferred to a 250 mL volumetric flask and made up the volume to 250 mL. Then, the solution was titrated with 10 mL of Fehling solution. The percentage of total sugar was calculated using the formula developed by Morales et al. (Citation2008).
2.4.8. Sucrose content
As 0.95 g sucrose on hydrolysis yields 1 g of invert sugar (glucose + fructose), the non-reducing sugar is expressed in terms of sucrose. Therefore, percentage of sucrose was calculated by subtracting reducing sugar from total sugar:
Where TSC = Total sugar content: RSC = Reducing sugar content
2.4.9. Eelectrical conductivity
The electrical conductivity of the honey sample was measured according to Kuliah and Kuliah (Citation2019) using conductivity meter (Model: Hanna Instruments lab HI 8733, Mauritius). A 20 g honey sample was dissolved in 20 mL of distilled water. The solution was placed in thermo-stated water bath at 20°C for 30 min. Electrical conductivity measurement was obtained with a low-range conductivity meter with a cell constant of 1.03. The conductivity cell was immersed in the sample solution, and the conductance in mS was recorded after temperature equilibrium had been reached. Electrical conductivity was calculated using the following formula.
Where SH is electrical conductivity of the honey solution in mS.cm−1; K is cell constant in cm−1; G is conductance in mS (milliSiemens).
2.4.10. Total phenolic content
The TPC was estimated by Folin-Ciocalteu method of with slight modifications (Shan et al., Citation2005). 0.1 mL of honey solution (10 mg/mL) was mixed with 1 mL of diluted Folin-Ciocalteu reagent. The mixture was left for 5 min and then 1 mL of sodium carbonate (7.5 g/100 mL solution) was added. After incubation of at 25°C for 90 min, the absorbance of resulting blue color was measured at 765 nm using UV-visible spectrophotometer (HACH LANGE DR 5000). The concentration of total phenolic content was estimated from gallic acid (1–100 μg/mL) calibration curve (y = 0.02x + 0.08, R2 is 0.991, p < 0.001), and the results were expressed as milligram of Gallic acid equivalent per 100 gram of honey (mg GAE/100 g) using the following equation obtained from calibration curve.
Where C = total phenolic content (mg GAE /100 g of honey); c = concentration of gallic acid established from the calibration curve (µg/mL); V = volume of honey solution in milliliter; m = weight of honey in gram.
2.4.11. Total flavonoid content
The TFC of the honey solution was estimated using the method of Kamtekar et al. (Citation2014). One milliliter of the solution (10 mg/mL) was diluted with distilled water to a volume of 1.25 mL and 75 µL 5% NaNO2 was added to the mixture. After 6 min, 150 µL 10% AlCl3 and then after 5 min, 1 mL 1 M NaOH were added to the reaction mixture. Finally, after mixing immediately the absorbance of the pink color was determined at 510 nm versus prepared water blank. A standard curve (y = 0.002x + 0.35, R2 = 0.99, p < 0.001) was prepared using catechin (5–1000 µg/mL). The concentration was expressed as milligram of catechin equivalents per 100 gram of honey (mg CE/100 g) using the following equation.
Where C = total flavonoid content (mg CE/100 g honey); c = concentration established from the catechin calibration curve (µg/mL); V = volume of honey solution in milliliter; m = weight of honey in gram.
2.4.12. Antioxidant activities
2.4.12.1. DPPH scavenging activity
DPPH radical scavenging activity of the crude extracts was determined as described by Daniel et al. (Citation2015). To test tubes containing different concentrations (10 to 100 mg/mL) of the extracts, freshly prepared DPPH solution (2 mL) was added into each test tube containing 1 mL of the extract. The reaction mixture and L-ascorbic acid (reference) were vortexed and left to stand at 25°C in the incubator for 30 min. After measuring the absorbance of the resulting solution at 520 nm, the ability to
scavenge the DPPH radical was calculated using the following equation.
Where Ac is absorbance of DPPH solution: As the absorbance in the presence of the sample of the extracts. The antioxidant activity was expressed as EC50 for each extract. The EC50 value is defined as the effective concentration (mg/mL) of extracts that scavenges the DPPH radical by 50%.
2.4.12.2. Ferric ion reducing power
The antioxidants cause the reduction of the yellow ferric cyanide complex to the ferrous form which can be monitored by measuring the formation of Perl’s Prussian blue at 700 nm (Amarowicz et al., Citation2004). A 1 mL extract solution was mixed with 2.5 mL of sodium phosphate buffer (0.2 M, pH 6.6) and 2.5 mL of 1% potassium ferric cyanide. Then, the mixture was incubated at 50°C for 20 min. After adding 2.5 mL of trichloroacetic acid (10%), the mixture was centrifuged at 3000 rpm (Centurion, 1000 series, UK) for 5 min. Finally, 2.5 mL of the supernatant solution was mixed with 2.5 mL of distilled water and 0.5 mL of FeCl3 (0.1%) and absorbance was measured at 700 nm. The ferric reducing power in honey solution was expressed in terms of milligram ascorbic acid equivalent per 100 gram of honey (mg AAE/100 g) using ascorbic acid calibration curve (y = 0.002x + 0.25, R2 = 0.98), and the results were calculated using the following equation:
Where C = ferric reducing power (mg AAE/100 g honey); c = concentration established from ascorbic calibration curve (µg/mL); V = volume of honey solution in milliliter, m = weight of honey in gram. All the samples were carried out in triplicate experiment for the control and heated honey samples.
2.5. Data analysis
The data were analyzed using JMP pro 13 and original version 8 software’s, with two-way ANOVA and expressed as mean (±) standard deviation. R software was used to express the correlation between the total phenolic content and the antioxidant activities of honey. The mean separation values of honey samples along with processing temperature and time were separated using an HSD test. All samples were conducted in triplicate, and the significance of differences was accepted at p < 0.05.
3. Result and discussion
3.1. Physicochemical properties of thermal treated honey
Physicochemical properties (total sugar, reducing sugar, sucrose, pH, free acid value, electrical conductivity, moisture, HMF, and diastase number) are presented in Table . The study showed that unheated honey had high total sugar, reducing sugar, and sucrose content; the values are 72.48%, 68.51%, and 3.78% respectively. These findings are in agreement with the studies conducted on Argentinean, Bangladeshi, Indian, Algerian, and Kenyan Honey (Islam et al., Citation2012; Makhloufi et al., Citation2010). However, the values were decreased significantly (p < 0.05) by the thermal treatments. Similarly, honey heated at both temperatures (55°C and 95°C) with low heating time had higher total sugar, reducing sugar, and sucrose contents. The study also indicated that honey heated at a higher temperature and longer time had low total sugar, reducing sugar, and sucrose content. The decrease in total sugar, reducing sugar, and sucrose content towards the higher heating temperature and time might be due to Maillard reactions. According to Saxena et al. (Citation2010) Maillard reactions facilitate the conversation of sugar into HMF. The national and international standard limit for total sugar, reducing sugar, and sucrose contents are ≥ 60%, ≥ 65 %, and ≤ 5% respectively (Cheftel, Citation2005; Gebremedhin et al., Citation2013; Heckman, Citation2017; Kuliah & Kuliah, Citation2019). Except for unheated honey, the reducing sugar content of honey heated at a temperature of (55°C and 95°C) with the given heating time (0.5 h, 1 h, and 2 h) were not within the range of national and international limits. However, the sucrose content of unheated honey and honey heated at temperatures of (55°C and 95°C) with the given heating time (0.5 h, 1 h, and 2 h) was within the limit of national and international standards. Concerning the total sugar content, honey heated at 95°C for all heating time was not within the range of standard limit, but unheated honey and honey heated at 55°C with the given heating time (0.5 h, 1 h, and 2 h) were within the range of the standard limit.
Table 2. Thermal treatment effect on the physicochemical properties of honey
The pH and free acidity values of unheated honey were 4.54 and 35.05 respectively. Similarly, pH and free acid values of honey heated at temperature of 55°C and 95°C for 0.5 h, 1 h, and 2 h were varied from 3.61 to 4.40 and 41.3 to 58.60 respectively. Similar findings were conducted by Ouchemoukh et al. (Citation2007) on Algerian, Brazilian, Bangladeshi, Indian, and Spanish honey. The study showed that the given thermal treatments don’t significantly affect (p > 0.05) the pH values and there is no regulatory limit for the pH value of honey. However, honey with pH between 3.2 and 4.5 is considered as a good quality of honey. Concerning free acid value, a significance difference (p > 0.05) was observed, and a low free acid value is measured for unheated honey. The higher free acids were measured for the thermally treated honey, and the values were increased with increasing heating temperature and time. As indicated in the study of Turhan et al. (Citation2008), honey had protein about 3% formed by the joining of amino acid by the peptide bond and heating the honey can break this peptide bond and make the amino acid to be freely available which can increase the free acid value of honey. Considering the quality from the free acid value aspect, according to Codex (Citation2017), the maximum permitted free acid value is 50 meq/kg. The free acid value of honey heated at a temperature of 95°C for 0.5 h, 1 h, and 2 h was increased by 44%, 59%, and 67% respectively, as compared to unheated honey sample, and these values were above the standard limit. However, the free acid values of both unheated and honey heated at 55°C were under the standard limit (Table ).
The electrical conductivity of unheated honey was 0.12 mS/cm, and the values of thermally treated sample varied from 0.13 to 0.245 mS/cm (Table ). In this study the electrical conductivities were not significantly different (p > 0.05) at the given thermal treatments. According to Codex (Citation2017), the electrical conductivity for good quality honey should be between of 0.3 and 0.8 mS/cm. The study revealed that the electrical conductivity is below 0.3 mS/cm, which is not in the given range; this indicated that honey is not of good quality in terms of its electrical conductivity.
The moisture content of unheated honey was 12.5%, and thermal treatments brought a significance difference (p < 0.05) in the moisture content of honey. The study showed that unheated honey had high moisture content, and this value became low when the processing time and temperature increased; the reason could be evaporation of moisture due to heating. Good quality honey has a moisture content of less than 21% (Gebremedhin et al., Citation2013; Heckman, Citation2017). Therefore, the study showed all samples were within the safest zone by their moisture contents.
The thermal treatment significantly affected the HMF and diastase of honey. The HMF of unheated honey is measured at 6.36 mg/kg. And the values are increased from 6.73 to 31.01 mg/kg when the heating temperature and time are increased from 55°C to 95°C and 0.5 to 2 h respectively. Heating honey at 95°C for 2 h increased the HMF amount by 388% when compared with unheated honey. Honey with HMF of not more than 80 mg/kg is considered as good quality (Heckman, Citation2017). This study revealed that thermally treated honey had higher HMF value, but the values are within the range of Codex standard. The higher HMF value toward the increasing of thermal treatment could be due to heating accelerating the conversion of sugar in to HMF (Bicchi et al., Citation1983). Similar findings were reported by Tosi et al. (Citation2008), Turhan et al. (Citation2008), and Turkut et al. (Citation2018). Unlike the increase of HMF by the thermal treatments, the study showed that diastase numbers were significantly decreased by the thermal treatment. The diastase number of unheated honey was 13.16, and the values decreased from 8.22 to 1.33 when the heating temperature and time were increased from 55°C to 95°C and 0.5 to 2 h respectively. Heating honey at 55°C for 30 min lowered the diastase by 37.44%, and this was increased to 72.26% when the heating temperature became 95°C for the same heating time; the reason could be due to the structural changes of enzyme molecules during heating. According to Tosi et al. (Citation2008) heating provides kinetic energy for enzymes which results in structural change by controlling a repulsive force between the constituent atoms and the electrode coming closer for a transition to another state. Good quality honey should have a diastase number of minimum 8 DN, and this showed that unheated and honey heated at 55°C for 30 min were within the range of codex standard.
3.2. Total phenolic and flavonoid contents of thermally treated honey
Total phenolic and flavonoid contents of thermally treated honey were determined and presented in Table . Total phenolic and flavonoid contents of unheated honey were measured with 45.37 mg GAE/100 g and 13.61 mg CE/100 g. The total phenolic and flavonoid contents of honey after thermal treatments of 55°C and 95°C for 0.5 h, 1 h and 2 h were increased from 48.36 to 64.26 mg GAE/100 g and 15.30 to 21.70 mg CE/100 g respectively. The study showed that heating honey at 55°C and 95°C for more than 30 min increased the total phenolic contents by more than 6.18% and 19.38% respectively. Similarly the total flavonoid content of honey samples increased by more than 16.5% and 31.33%, respectively, after thermal treatments of 55°C and 95°C for more than 30 min; and the reason could be due to Maillard reaction. Islam et al. (Citation2012) reported that sugary product undergoes a Maillard reaction under high intensity of heat, and this could increase the intrinsic and some non-nutritive antioxidants agents. Similarly, Lachman et al. (Citation2010) suggested that the amount of total phenolic content was found to increase proportionally with the heating temperatures. Also, Nusrat et al. (Citation2015) reported that the total phenolic and flavonoid contents of honey samples were increased with increasing temperatures; they suggested that the rise of flavonoid content after heat treatment may be due to the increment of bio-accessibility of certain heat activated flavonoids during thermal treatment. Saric et al. (Citation2013) and Režek Jambrak et al. (Citation2018) suggested that the increment of flavonoids may be because of the activation of some thermostable compounds which can contribute to the antioxidant activity. Similar findings were conducted by Paul (Citation2001) and Meda et al. (Citation2005) on honey from India, Argentina, and Burkina Faso.
Table 3. Total phenolic and flavonoid contents of thermally treated honey
3.3. Antioxidant properties of thermally treated honey
The antioxidant properties of honey are expressed using DPPH radical scavenging power and ferric reducing power; and the results are presented in Figure and Table . Study showed that the percentage of the DPPH radical scavenging activity of honey increased as the sample concentration increased (Figure ). The DPPH radical scavenging power was expressed by IC50, and ascorbic acid was used as standard. The IC50 values of all the extracts were calculated from plotted graph of percentage scavenging activity against concentration of the extracts (Table ). The lower the IC50 value, the stronger is the scavenging potential (Kumar et al., Citation2010). Ascorbic acid had IC50 of 0.060 mg/mL and the highest IC50 value was measured for unheated which was 92.47 mg/mL. However, the IC50 values of honey decreased from 58.59 to 9.48 mg/mL after thermal treatments at 55°C and 95°C for 0.5 h, 1 h and 2 h. The increasing of DPPH radical scavenging power of honey samples and ascorbic acid were in the order of unheated honey < honey heated at 55°C for 0.5 h < honey heated at 55°C for 1 h < honey heated at 55°C for 2 h < honey heated at 95°C 0.5 h < honey heated at 95°C for 1 h < honey heated at 95°C for 2 h < ascorbic acid. As the heating temperature and time increased, the DPPH scavenging power of honey samples increased. The reason might be due to increasing phenolic content (Saric et al., Citation2013) and the Maillard reaction taking place during thermal treatment that could form non-nutritional antioxidants (Kusznierewicz et al., Citation2008). Similarly, according to Nayik et al. (Citation2016), Nayik and Nanda (Citation2016a), and Nayik and Nanda (Citation2016b), the higher heating temperature and prolonged time increased the DPPH radical scavenging power of apple honey collected from Kashmir valley, due to the formation of Maillard reaction products.
Figure 2. DPPH radical scavenging power (%) of thermally treated honey and the reference (ascorbic acid). Each value is expressed as mean ± SD.
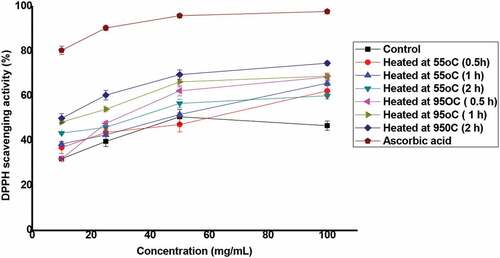
Table 4. Thermal treatment effect on the DPPH scavenging activity (IC50) and ferric reducing power of honey
Like DPPH scavenging activity, the ferric reducing power of honey was also increased after thermal treatments. The study showed that the ferric reducing power of unheated honey was 100.9 mg AAE/100 g, and the values were increased from 118.75 to 204.259 mg AAE/100 g when the heating temperature and time were increased from 55°C to 95°C and 0.5 to 2 h respectively. Similar finding was reported by Turkmen et al. (Citation2006) and Turhan et al. (Citation2008) in Türkiye, demonstrating that heating increased the formation of brown melanoidins which contributed to the enhancement of antioxidant potential.
3.4. Correlation analyses
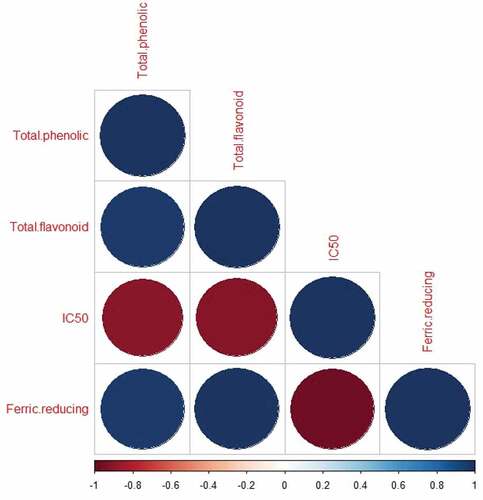
The correlation between total phenolic and flavonoid and antioxidant properties (DPPH radical scavenging power and ferric reducing assay) of honey after thermal treatments was extensively investigated and shown in Figure . According to Terpinc et al. (Citation2012), Daniel et al. (Citation2015), and Engeda (Citation2020), Nayik et al. (Citation2016), and other researchers, antioxidant activities and total phenolic and flavonoid contents were positively correlated. In this study, DPPH radical scavenging power was positively correlated with total phenolic content and total flavonoid content, and the Pearson correlation values at p < 0.05 are 0.83 and 0.97 respectively. Similarly, the ferric reducing power was also positively correlated with the total phenolic content and total flavonoid content with the Pearson correlation values of 0.94 and 0.97 at p < 0.05. It seemed that honey with higher total flavonoid and total phenolic content had high antioxidant potentials; a similar study was reported by Boulanouar et al. (Citation2013) on Algerian crops. Therefore, the existence of phenolic compounds in honey showed the potential of honey to donate the hydrogen atom or electrons which can stabilize and terminate the radical chain reaction through reacting with the free radicals.
Figure 3. The correlation of antioxidant activities and total phenolic and flavonoid contents of thermally treated honey.
4. Conclusions and recommendations
In conclusion, processing honey with high temperature and prolonged time influences the quality of honey; study showed that honey processed with a higher temperature and a prolonged time boosts the HMF, free acid value, and the antioxidant potentials. Similarly, the total phenolic and flavonoid contents of the honey were increased in the higher processing time and temperature. The findings supported that there is a positive correlation between antioxidants and bioactive compounds (total phenolic and flavonoid contents) of the honey. Conversely, processing with the higher temperature and prolonged time affected diastase, moisture, and sugar contents of the honey. The lower diastase activity and sugar contents, and the higher HMF and free acid value after processing, were associated with lowering the quality of honey. Therefore, optimizing the processing condition of honey is very important in maintaining its quality.
Availability of data and materials
The data used in the current study are available from the corresponding author and will be given upon for the reasonable request.
Acknowledgements
Special thanks to the Chire Woreda, Sidamo regional state for their contributions in this study to provide honey for the research work. Hawassa University College of Agriculture and Hawassa College of Education for their support in the lab work activities.
Disclosure statement
There is no any conflict of interest in the research work.
Additional information
Funding
Notes on contributors
Senbeto Daka
Senbeto Daka (SD) graduated from Hawassa University School of Nutrition, Food Science and Technology with MSc degree in Food Science and Technology, and now he is working as agricultural expert in Chire Worda, Sidamo Regional State. SD has contributed conceptualization, sample collection, Methodology, Data Collection, writing original draft preparation.
Engeda Dessalegn
Engeda Dessalegn (ED) is an Associate professor at Hawassa College of Education, Chemistry Department; the contribution of Ed was developing methodology, major supervisor, lab analysis, data analysis and original draft revision.
Yassin Hassen
Yassin Hassen (YH) is an Assistant Professor at Hawassa University, School of Nutrition, Food Science and Technology. YH contributed to the research work as co-supervisor guiding on the ways of how to write the paper.
Aemiro Tadesse Zula
Aemiro Tadesse Zula is Lecturer and researcher at Hawassa University, School of Nutrition, Food Science and Technology. The contribution of AT In the research work was conceptualization and interpretation of the data and re-writing the manuscript.
References
- Amarowicz, R., Pegg, R. B., Rahimi-Moghaddam, P., Barl, B., & Weil, J. A. (2004). Free radical scavenging capacity and antioxidant activity of selected plant species from the Canadian prairies. Food Chemistry, 84(4), 551–16. https://doi.org/10.1016/S0308-8146(03)00278-4
- Bicchi, C., Belliardo, F., & Frattini, C. (1983). Identification of the Volatile Components of Some Piedmontese Honeys. J. Journal of Apicultural Research, 22(2), 130–136. https://doi.org/10.1080/00218839.1983.11100574
- Bizuayehu, A. A., & Adissu, T. M. (2021). 2021. Assessment of post-harvest Handling and Quality of Honeybee Products along the Value Chain in SNNPR, Ethiopia, International Journal of Agriculture and Food Science, 3(2), 28–365. https://www.agriculturaljournals.com/archives/2021/vol3issue2/PartA/3-2-11-884.pdf
- Boulanouar, B., Abdelaziz, G., Aazza, S., Gago, C., & Miguel, M. G. (2013). Antioxidant activities of eight Algerian plant extracts and two essential oils. Ind. Crops Prod, 46, 85–96. https://doi.org/10.1016/j.indcrop.2013.01.020
- Chanson-Rolle, A., Braesco, V., Chupin, J., & Bouillot, L. (2016). Nutritional Composition of Orange Juice: A Comparative Study between French Commercial and Home-Made Juices. Food Nutr. Sci, 07(4), 252–261. https://doi.org/10.4236/fns.2016.74027
- Cheftel, J. C. (2005). Food and nutrition labelling in the European Union. Food Chemistry, 93(3), 531–550. https://doi.org/10.1016/j.foodchem.2004.11.041
- Dagnaygebaw, G., & Tariku, A. (2020). Constraints of honey production and marketing in Ethiopia. Agricultural Reviews, 41(4), 393–397. 10.18805/ag.R–172. https://arccarticles.s3.amazonaws.com/arcc/Final-attachment-published-R-172.pdf
- Daniel, A., Engeda, D., & Chetan, C. (2015). Effect of thermal treatment on phenolic content, antioxidant, and -amylase inhibition activities of Moringa stenopetala leaves. African J. Food Sci, 9(9), 487–494. https://doi.org/10.5897/ajfs2014.1241
- Engeda, D. (2020). Effect of extraction solvents on antioxidant and α-amylase inhibition activities of spiced green chili paste: an in vitro study. Advance in Life Science and Technology, 77, 5–13. https://core.ac.uk/download/pdf/287193415.pdf
- Gebremedhin, G., Tadesse, G., & Kebede, E. (2013). Physiochemical characteristics of honey obtained from traditional and modern hive production systems in Tigray region, northern Ethiopia. Momona Ethiop. J. Sci, 5(1), 115. https://doi.org/10.4314/mejs.v5i1.85335
- Girma, M., Ballo, S., Tegegne, A., Alemayehu, N., & Belayhun, L. 2008. Approaches, methods and processes for innovative apiculture development: Experiences from ada’a-liben woreda Oromia regional state, Ethiopia. improv. product. mark. success ethiop. Farmers Proj. Work. Pap. 8. ILRI (International Livest. Res. Institute). (8): 48. Nairobi (Kenya) International Livestock Research Institute. http://dspace.ilri.org:8080/bitstream/10568/480/1/Apiculture_IPMSWP8.pdf.
- Heckman, K. Codex alimentarius commission adopts new international food standards and elects new chairperson. 2017: 4894. https://www.khlaw.com/Codex-Alimentarius-Commission-Adopts-New-International-Food-Standards-and-Elects-New-Chairp
- Islam, A., Khalil, I., Islam, N., Moniruzzaman, M., Mottalib, A., Sulaiman, S. A., & Gan, S. H. (2012). Physicochemical and antioxidant properties of Bangladeshi honeys stored for more than one year. BMC Complementary and Alternative Medicine, 12, 1–10. https://doi.org/10.1186/1472-6882-12-177
- Kamtekar, S., Keer, V., & Patil, V. (2014). Estimation of phenolic content, flavonoid content, antioxidant and alpha amylase inhibitory activity of marketed polyherbal formulation. J. Appl Pharm. Sci, 4(9), 61–65. https://doi.org/10.7324/JAPS.2014.40911
- Kuliah, M., & Kuliah, M. 2019. No 主観的健康感を中心とした在宅高齢者における 健康関連指標に関する共分散構造分析Title. (April): 33–35. check the language!!
- Kumar, A., Kaur, R., & Arora, S. (2010). Free radical scavenging potential of some Indian medicinal plants. J. Med. Plants Res, 4(19), 2034–2042. https://doi.org/10.5897/jmpr10.165
- Kusznierewicz, B., Śmiechowska, A., Bartoszek, A., & Namieśnik, J. (2008). The effect of heating and fermenting on antioxidant properties of white cabbage. Food Chemistry, 108(3), 853–861. https://doi.org/10.1016/j.foodchem.2007.11.049
- Lachman, J., Hejtmankova, A., Sykora, J., Karban, J., Orsak, M., & Rygerova, B. (2010). Content of major phenolic and flavonoids antioxidants in selected Czech honey. Czech Journal of Food Sciences, 28(5), 412–426. https://doi.org/10.17221/202/2009-CJFS
- Loss on Drying at. (1998). 95–100°C Final Action Codex-Adopted— AOAC Method*, 68 (March), 1998. http://www.eoma.aoac.org/methods/info.asp?ID=32550
- Maetz, M., Aguirre, M., Kim, S., Matinroshan, Y., Pangrazio, G., & Pernechele, V. (2011). Food and agricultural policy trends after the 2008 food security crisis. Renewed attention to agricultural development Resources for Policy Making. Applied Work, EASYPol Module, 125. https://www.fao.org/3/ap237e/ap237e.pdf
- Makhloufi, C., Kerkvliet, J. D., D’Albore, G. R., Choukri, A., & Samar, R. (2010). Contents of major phenolic and flavonoid antioxidants in selected Czech honey. Czech Journal of Food Sciences, 41(5), 509–521. https://doi.org/10.17221/202/2009-CJFS
- Meda, A., Lamien, C. E., Romito, M., Millogo, J., & Nacoulma, O. G. (2005). Determination of the total phenolic, flavonoid and proline contents in Burkina Fasan honey, as well as their radical scavenging activity. Food Chemistry, 91(3), 571–577. https://doi.org/10.1016/j.foodchem.2004.10.006
- Mehdi, Z., Ali, F., & Noushin, T. (2019). Effect of thermal treatment on physicochemical and antioxidant properties of honey. Heliyon, 5, 1–5. https://doi.org/10.1016/j.heliyon.2019.e01894
- Morales, V., Corzo, N., & Sanz, M. L. (2008). HPAEC-PAD oligosaccharide analysis to detect adulterations of honey with sugar syrups. Food Chemistry, 107(2), 922–928. https://doi.org/10.1016/j.foodchem.2007.08.050
- Nayik, G. A., Dar, B. N., & Nanda, V. (2016). Optimization of the process parameters to establish the quality attributes of DPPH radical scavenging activity, total phenolic content, and total flavonoid content of apple (Malus domestica) honey using response surface methodology. Int. J. Food Prop, 19(8), 1738–1748. https://doi.org/10.1080/10942912.2015.1107733
- Nayik, G. A., & Nanda, V. (2016a). Application of response surface methodology to study the combined effect of temperature, time and pH on antioxidant activity of cherry (Prunus avium) honey. Polish J. Food Nutr. Sci, 66(4), 287–293. https://doi.org/10.1515/pjfns-2015-0055
- Nayik, G. A., & Nanda, V. (2016b). Effect of thermal treatment and pH on antioxidant activity of saffron honey using response surface methodology. J. Food Meas. Charact, 10(1), 64–70. https://doi.org/10.1007/s11694-015-9277-9
- Nusrat, J. M., Asiful, I., Fahmida, A., Siew, H. G., & Ibrahim, K. (2015). Prolonged heating of honey increases its antioxidant potential but decreases its antimicrobial activity. African Journal of Traditional, Complementary, and Alternative Medicines: AJTCAM / African Networks on Ethnomedicines, 12(4), 134–144. https://doi.org/10.4314/ajtcam.v12i4.20
- Ouchemoukh, S., Louaileche, H., & Schweitzer, P. (2007). Physicochemical characteristics and pollen spectrum of some Algerian honeys. Food Control, 18(1), 52–58. https://doi.org/10.1016/j.foodcont.2005.08.007
- Paul, M. E. (2001). Analysis of complex mixtures of flavonoids and polyphenols by high-performance liquid chromatography electrochemical detection methods. Methods in Enzymology, 355(1988), 15–26. https://doi.org/10.1016/S0076-6879(01)35228-X
- Režek Jambrak, A., Vukušić, T., Donsi, F., Paniwnyk, L., & Djekic, I. (2018). Three Pillars of novel nonthermal food technologies: food safety, quality, and environment. J. Food Qual, 2018, 1–18. https://doi.org/10.1155/2018/8619707
- Saba, Z., Suzana, M., & Anum, M. Y. (2013). Honey: Food or Medicine. Med Heal, 8(1), 3–18. https://core.ac.uk/download/pdf/19971378.pdf
- Saric, G., Markovic, K., Vukicevic, D., Lez, E., Hruskar, M., & Vahcic, N. (2013). Changes of antioxidant activity in honey after heat treatment. Czech J. Food Sc, 31(6), 601–606. https://doi.org/10.17221/509/2012-CJFS
- Saxena, S., Gautam, S., & Sharma, A. (2010). Physical, biochemical and antioxidant properties of some Indian honeys. Food Chemistry, 118(2), 391–397. https://doi.org/10.1016/j.foodchem.2009.05.001
- Schade, J. E., Marsh, G. L., & Eckert, J. E. (1958). Diastase activity and hydroxy‐methyl‐furfural in honey and their usefulness in detecting heat alteration. Journal of Food Science, 23(5), 446–463.
- Shan, B., Cai, Y. Z., Sun, M., & Corke, H. (2005). Antioxidant capacity of 26 spice extracts and characterization of their phenolic constituents. Journal of Agricultural and Food Chemistry, 53(20), 7749–7759. https://doi.org/10.1021/jf051513y
- Terpinc, P., Čeh, B., Ulrih, N. P., & Abramovič, H. (2012). Studies of the correlation between antioxidant properties and the total phenolic content of different oil cake extracts. Industrial Crops and Products, 39(1), 210–217. https://doi.org/10.1016/j.indcrop.2012.02.023
- Tosi, E., Martinet, R., Ortega, M., Lucero, H., & Ré, E. (2008). Honey diastase activity modified by heating. Food Chemistry, 106(3), 883–887. https://doi.org/10.1016/j.foodchem.2007.04.025
- Turhan, I., Tetik, N., Karhan, M., Gurel, F., & Reyhan Tavukcuoglu, H. (2008). Quality of honeys influenced by thermal treatment. LWT - Food Sci. Technol, 41(8), 1396–1399. https://doi.org/10.1016/j.lwt.2007.09.008
- Turkmen, N., Sari, F., Poyrazoglu, E. S., & Velioglu, Y. S. (2006). Effects of prolonged heating on antioxidant activity and colour of honey. Food Chemistry, 95(4), 653–657. https://doi.org/10.1016/j.foodchem.2009.05.001
- Turkut, G. M., Degirmenci, A., Yildiz, O., Can, Z., Cavrar, S. (2018). Investigating 5-hydroxymethylfurfural formation kinetic and antioxidant activity in heat treated honey from different floral sources. J. Food Meas. Charact, 12(4), 2358–2365. https://doi.org/10.1007/s11694-018-9852-y