
 ?Mathematical formulae have been encoded as MathML and are displayed in this HTML version using MathJax in order to improve their display. Uncheck the box to turn MathJax off. This feature requires Javascript. Click on a formula to zoom.
Abstract
In Kenya, like in many developing countries, the food consumption patterns among the elites and middle classes are shifting towards the consumption of convenient processed foods. This has led research and development initiatives in Kenya to innovate the-shelf bean products to meet the changing consumer needs. However, there is limited information on how the various processed bean processors and distributors are performing. This study explores the structure and performance of the processed common bean market to advise the would-be contenders in the same business. To achieve this, the study applied the structure, conduct, and performance framework to analyze data that was collected from 19 bean processors and 90 distributors. Study findings show that the market structure of firms processing common beans exhibited oligopolistic tendencies with 4 firms controlling 89% of the entire market, while its distribution proved to be more competitive with 4 firms controlling 16% of the market. Initial investment and limited product market are the primary barriers that make bean processing an undesirable venture for many new entrants. To gain momentum, compete with already established brands, and break the oligopoly tendencies in the market, medium-scale processors should be facilitated with tax exemptions. Products produced by home companies should be widely advertised. There is also a need for distribution strategies that can easily get the processed common beans market to consumers to maintain competition and low stock turnover for the products at the distribution level.
PUBLIC INTEREST STATEMENT
Urbanization is associated with changing lifestyles in terms of reduced time at home, and preference for processed food. This has contributed to observed shifts in the food consumption patterns among the middle classes towards the consumption of convenient processed foods. In this regard, processed beans provide an opportunity in terms of convenience through short cooking time and ready-to-eat bean snacks. Recent efforts by both governments and the private sector have not had adequate market research to guide investors. We believe that for any potential investors, knowing the processed bean actor’s business operations, existing market opportunities, as well as the risks associated with the business would be a critical step in making an investment case for processing beans. This study provides empirical evidence on the processed common bean market. The information generated is very critical for existing processed bean actors as well as potential investors to make informed investment decisions.
1. Introduction
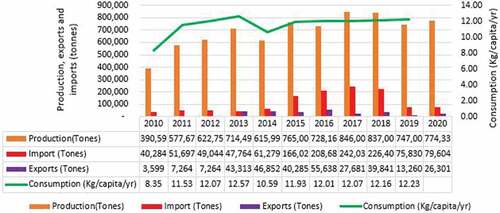
Consumption of processed food in Kenya is becoming an increasingly important component of the food system as more of the working class chooses to dine out rather than prepare meals at home. This comes along with changes in what they choose to buy to reduce the time for cooking. Kenya’s import demand for dry beans for the past ten years (Figure ) is a clear indication that the production of processed beans is dependent on imported dry beans. It is an indicator that the industry depends not only on local production but also on bean imports. To the innovative actors in the food value chain, the processed business structure can alter the competitiveness and growth prospects of other supportive services in an economy. Kenya developed a canning bean industry to meet the food demands of its changing population way back in 1998 compared to other East African Countries (Wambua et al., Citation2016). However, the canned and frozen beans on the Kenyan market are only affordable to a minority of wealthy consumers, which leaves the majority of the bean consumers without access to the benefits of primary processed bean products (IDRC, Citation2014). Due to this, precooked beans were introduced into the Kenyan market to supplement the already existing processed bean products. Kenya’s consumption of precooked beans was estimated at 19% of the entire population and this goes up to 30% for the urban populations, which is projected to be the highest among East African Countries (Wambua et al., Citation2016). Nevertheless, the competitiveness of the already existing processed bean businesses (bean processing and processed bean distribution) was not well documented.
Figure 1. Dry bean production, export, import, and consumption scenarios in Kenya (2010-2020).
Determining the competitiveness of any market is vital to inform policy and decision-making processes at all levels (OECD, Citation2021). Dominance in a market and the lack of competition affect consumers more since they end up suffering from limited choice and paying exorbitantly higher prices (OECD, Citation2021). For example, the consumers’ welfare would be undermined if only a few products do not meet their expectations in terms of the degree of choice, and ability to switch from one processed bean commodity to another. In the same scenario, limited information on the competitiveness of the already existing processors and distributors of processed beans in Kenya would affect decision-making for intending business actors. Available studies (Chemining’wa et al., Citation2014) have focused on specific methods of processing and suitable bean varieties for processing with limited attention to the structure, and yet the structure of the market is generally important in determining performance (Ukav, Citation2017). Other studies (Aliyi et al., Citation2021; Ayele et al., Citation2017; Nzima et al., Citation2014) that have applied the structure, conduct, and performance framework to examine the performance of different agricultural commodities in terms of marketing challenges, actors, market participation and volumes handled, have not examined processed food marketing. The only available study (Odhiambo et al., Citation2006) that examined the structure and performance of bean marketing in Kenya focused on unprocessed beans and it is quite long (in 2005) since the study was done. Given the evolutions in terms of processing and value addition, it was prudent to add new knowledge to the existing information for guided policy decisions.
This paper, therefore, exclusively explores the structure and performance of the processed common bean business at the processing and distribution nodes of the processed bean value chain in Kenya. Specifically, the paper seeks to: (i) assess the existing market structure of processed bean businesses, (ii) identify the barriers to processed bean market entry and exit; (iii) examine the performance of the processed common bean business. The study applied the structure, conduct, and performance (SCP) framework to address the aforementioned objectives on processed bean marketing in Kenya. Results revealed that processed common bean businesses exhibited an oligopolistic market structure at the processing stage, with competitive distributive tendencies.
The rest of the paper is structured as follows: Section two outlines an overview of research and development initiatives to process common beans in Kenya. Section three examines the study methodologies (data collection, sample size, data analysis, and empirical methods) and the conceptual framework for the study. Section four presents the study results and discussion while the last section concludes with policy recommendations for the bean processing industry.
2. Research and development initiatives on processing common beans in Kenya
In a bid to increase bean consumption to meet the changing consumer needs (processed foods) of the middle-class population, in 2014, the National Agriculture Research Organization of Uganda in collaboration with Kenya Agricultural and Livestock Research Organization (KALRO), the International Center for Tropical Agriculture and the private sector through research and development initiatives (funded by Canada’s International Development Research Centre) explored industrial processing for common beans. The intervention entailed processing dry bean grains under high temperatures and pressure to produce a transformed value-added bean product referred to as the “precooked bean.” Once precooked, it was envisaged that one needed to add water and cook for 10–15 minutes, which would reduce the cooking time by 90%.
To this effect, the project was planned to pre-screen 47 bean varieties, from which 12 varieties were targeted for production and industrial precooking based on cooking time, color, micronutrient content, and ease of growing. Three precooked bean products: a ready-to-eat bean snack; a bean flour; and a precooked bean product that takes only 15 minutes to cook were planned to be processed from common beans. Two production facilities were planned to be established (one in Uganda and another in Kenya), with the pilot factory capable of processing nine tons of precooked bean products per day. Before the massive production of the aforementioned processed bean products, it was deemed necessary to understand the structure and performance of processed bean products in Kenya for guided investments in processing.
Like other food processing businesses, the structure, conduct, and performance (SCP) of processed beans is a big question for potential investors. It is thus important to understand the various processed common bean products on the market, how they are processed and distributed, and document the barriers to entry and exit that affect the business. This information is key to guiding targeted interventions in common bean processing. Hence, using the SCP framework, this study sought to understand the structure and performance of the processed bean business in Kenya.
3. Materials and methods
3.1. Study area, sampling technique, and sample size
A survey that targeted direct actors (processors and distributors) in the processed bean business was carried out in 2016 in Kenya. These actors were hypothesized to inhabit urban and industrial areas; therefore, the study sites were selected depending on the level of urbanization. To this effect, Nairobi and Kiambu counties in Kenya were purposively selected from a list of counties due to the high levels of urbanization and level of industrialization with a main focus on the bean processing business. A purposive two-stage sampling technique was adopted. The first step involved the identification of bean processors based on the available information from the reconnaissance visit done based on reference from governing bodies like Kenya Agricultural and Livestock Research Organization (KALRO) and other indirect actors along the processed bean value chain. A list of 24 bean processors was generated and they were all purposively selected for an interview due to the limited number. However, 3 processors declined to participate in the study and 2 processors could not be reached, leaving the number of processors interviewed in this study at only 19.
The second step involved the identification of processed bean distributors, which was done by listing all processed bean retail outlets in each of the selected 2 counties. From the list that was generated, every 5th supermarket on the list was selected to participate in the study. All processor outlets and retail shops dealing in processed bean products on the list were selected for the interview. A total of 90 distributors across the two counties were obtained and these include 2 processor outlets, 84 supermarkets, and 4 retail shops.
3.2. Data collection and analysis
Data were collected using semi-structured questionnaires with both closed and open-ended questions. Information was collected on varieties processed, suppliers, activities involved in the processing, costs incurred for the different activities, production technologies, volumes, and distribution channels. Information on the ownership of the businesses, social capital, and challenges was also obtained. In terms of analysis, structure, conduct, and performance (SCP) was used as an analytical framework to make relations between market structure, market conduct, and market performance (De Figueirêdo Junior et al., Citation2014; Bobel, Citation2010; Lelissa & Kuhil, Citation2018). Specifically, concentration ratios were used in determining the market structure, while marketing margin analysis was used to assess the performance of actors engaged in the processing and distribution of processed bean products.
3.3. Conceptual framework
The study employs the extended Structure Conduct Performance (SCP) Framework as suggested by De Figueirêdo Junior et al. (Citation2014) for application on different nodes of agricultural value chains and commodities (Figure ). It postulates that there is a causal relationship between market structure, conduct, and performance. The paradigm argues that an industry that successfully produces benefits for producers and consumers critically depends on the structure (power of market) and conduct (competitive behavior) of firms in the market (Ordofa et al., Citation2021). It further hypothesizes that market concentration has an inverse relationship with the degree of competition because market concentration encourages firms in the market to collude (Sexton & Xia, Citation2018). This study examines the relationship between the structural elements of the bean actors and their performance at the processing and distribution segments of the processed bean value chain.
Figure 2. Relationship between factors that affect the competitiveness of the firms.
In terms of the business environment, the processed bean actors operate in an uncertain environment characterized by social-economic characteristics, shocks, and supply and demand dynamics, which affect all SCP aspects of the bean actors at the different nodes. The social-economic factors such as education or ownership type will affect the processor’s level of investment which will affect the size of the firm directly, his conduct, and the returns obtained in return. The demand for the products affects the volumes sold and profits earned over a specific period. The structure elements such as the number and size of firms will influence their behavior (conduct) in the market, ultimately determining their performance. In cases where there are a few large firms, they can decide to collude and set a higher price which will lead to a higher return. Structural elements such as high capital investment could limit the number of firms at the processing stage even if the ones exiting are earning abnormal profits.
Good performance in terms of high revenue reduced costs and higher net returns is what all bean processors and product distributors ultimately seek. But the performance of processed bean actors is affected by market conduct, market structure, and structural elements through the level of investment (Lelissa & Kuhil, Citation2018). Information asymmetry for example, has a direct impact on the performance of the firms as a distortion in the information could lead to charging very low or uncoordinated prices which affects the performance of the firms in that particular market (Kizito, Citation2019). The causation chain does not only run in one direction as there are feedback mechanisms from performance to conduct and structure as indicated by the dotted arrows and back-and-forth impact of conduct. Thus, the streams presenting a high operational performance tend to gain market share and alter the market structure.
In the measurement of the SCP variables, this study uses both static and dynamic measures such as the average age of firms also recorded as company existence and the inclusion of imported commodities rather than only those manufactured locally. However, due to the limitation of data, the study focuses on the locally manufactured products at the processing node
3.3.1. Beans market structure
Market structure refers to a set of market characteristics that determine the economic environment in which a firm (in this case processed bean actors) operates (Nzima & Dzanja, Citation2015). It is characterized based on several characteristics such as (i) number and size distribution of active buyers and sellers; (ii) degree of product differentiation; (iii) amount and cost of information about product price and quality, and (iv) conditions of entry and exit. In this study, the market structure was determined based on market concentration exercised by traders already in bean processing and distribution, and barriers to market entry for potential bean traders. Concentration is defined as the number and size of distribution of processed bean buyers in the market. The greater the degree of concentration, the greater the possibility of non-competitive behavior in the market. For an efficient market, there should be a sufficient number of firm’s buyers and sellers in the market to spur competition. The concentration ratio (CR) is the percentage of shares controlled by a given number of firms ranked in order of market share from the largest to the smallest. Handy (Citation1985) emphasized that the four firms (CR4) concentration ratio is the most typical concentration ratio for judging the market structure. A concentration ratio of above 60% is interpreted as a strong oligopolistic market, while that between 40% and 60% is interpreted to be a weak oligopolistic market and a CR4 of less than 33% is not a concentrated market. The concentration ratio (CR) was calculated by the following formula.
Where CR m = concentration ratio of the largest m firms, m = 2, 4, and 8;
n = Number of actors;
Ms i = Market share of actor i (i = 1 …, n).
And market shares were computed as:
Where: Vi = Volume of beans/bean products handled by firm i (Kg); ∑V = Total amount of beans handled by all firms in the market for that particular category (kg)
CR was chosen over other measures such as the Herfindahl-Hirschman Index (the sum of the squares of the relevant company shares which is determined as a ratio of the total volume of the market) due to its ability to utilize market shares to determine the extent of market concentration (Pavic et al., Citation2016; Ukav, Citation2017). In addition, CR defines the markets and considers the complexity within the markets. Market concentration indices also provide useful and practical indicators of market power and clues about how competitive the market is.
The study further examined both barriers to entry and exit as key measures of market structure. By barriers to entry, the study focused on factors that prevent or deter the entry of new firms into an industry even when incumbent firms are earning excess profits (Ingo, Citation2010). To this effect, product differentiation, operating costs, input costs, and other challenges that the actors faced were assessed. For the barriers to exit, the study focused on factors that prevent the firms from leaving the industry even when they are not making profits. These were examined in terms of capital investments required and information asymmetry.
3.3.2. Performance of bean actors
Market performance refers to the economic results that flow from the industry and how well it performs in terms of efficiency and progressiveness or innovation (Nzima & Dzanja, Citation2015). According to Khantimirov (Citation2017) performance can be considered as the ability of producers to market products to consumers not forgetting the level of margins which depend on the level of prices charged. Performance can be divided into two operational and financial performance and hence market performance measurements include both financial and non-financial measures (Khantimirov, Citation2017; Stojkic & Bosnjak, Citation2019). While measuring financial performance only the cost-based methods are included however while measuring operational, both cost-based and non-cost-based measures are employed (Stojkic & Bosnjak, Citation2019). Over the years, scholars have highlighted the importance of multidimensional marketing measures in measuring market performance. Khantimirov (Citation2017) goes further to suggest market shares as a key indicator of the firm’s competitiveness and proposes it as a measure of market performance. In the SCP framework, the market shares are structural elements that strongly influence the performance of the firm and hence the SCP framework incorporates both the analysis of the financial to back non-financial measures.
Literature has a number of financial/cost-based measures of performance, however, the limitation lies in the availability of the right and appropriate data to properly carry out the desired analysis. (Uzunidis, Citation2016) Further emphasized that the criteria of performance evaluation are prices, costs of commercialization and commercial margins. Moreover, after an in depth review of literature on performance measurement methods, (Stojkic & Bosnjak, Citation2019) recommended that the performance measurement method depend on the research requirement. Marketing margins refer to the differences in prices paid at purchase (stocking) and the price paid while selling a commodity at the different nodes of the bean value chain. Several studies (Achike & Anzaku, Citation2010; Kelemework, Citation2015; Lakor et al., Citation2016; Muhaimin & Wijayanti, Citation2019) have employed marketing margins to analyze the market performance of different commodities in developing countries. Hence, marketing margins were adopted to evaluate the performance of processed beans. For this study, the marketing margins were computed as;
Where;
Where: MM = Marketing margin obtained per unit sale, PM = Price margin; and
are the selling and purchase prices for a unit Product; Cp = Unit cost, these were calculated as the total cost incurred to produce a unit product. The return on sales estimation as stipulated by OECD (Citation2021) would be one of the best measures for market performance, however, given the limited number of variables and participants, this study used the marketing margin analysis.
4. Results and discussions
4.1. Socio-economic characteristics of bean processors and product distributors
Bean processors were categorized into small, medium, and large-scale processors according to the volumes of grain handled and processed per month and the technologies used in the processing of beans (Table ). Study findings revealed that large-scale (75%) and medium-scale (57%) processing was dominated by male and small-scale processing was female-dominated. The study findings collaborate with those of Van der Zwan et al. (Citation2016) who found that opportunity business ownership was for male, young, wealthier, and proactive individuals. In terms of ownership, all the small-scale processing businesses were 100% owned individually (sole ownership), while the large-scale processors were mainly partnerships and companies limited by liabilities. Further analysis (ANOVA) indicated that there were statistically significant differences in the number of years the processors had been in existence, with the large-scale processing companies having been in existence for more years compared to the small and medium ones. This implies that they have been able to learn from the initial stages of processing (when still small) to where they are today. In terms of the product space, majority of the processors particularly medium-scale processors were engaged in manufacturing of more than one processed bean product.
Table 1. Socio-economic characteristics of common bean processors
The processed bean distributors were also grouped according to their functional nature; that is supermarkets, retail shops, and processor outlets (Table ). Processed bean distribution businesses were owned by mature educated individuals with an average age of 53 years. All owners were found to have reached at least the secondary level as none of the owners was reported to have stopped at the primary level but had rather attained at least more than 7 years of formal education. The majority (84%) of the owners of these distribution points were male. Generally, sorted and parked beans were the most common (59%) processed bean product available in the distribution stores followed by baked beans. This implies that processing common beans in Kenya is still at the elementary stages with less sophisticated technologies. Supermarkets sold almost all the bean products available on the market apart from bean flours which were predominantly sold in retail shops. All distribution stores had at least one paid employee in charge of the processed bean products.
Table 2. Socio-economic characteristics of processed bean distributors (by type)
4.2. Structure of the bean business
In examining the structure, we first focused on the market shares of processors and distributors. Study findings (Table ) show that at the processing stage, the largest firm had a market share of 39.06% whereas the smallest controlled 0.1% of the market with the average market share at this stage being 5.26. Based on the classification by Pavic et al. (Citation2016), the bean processors exhibit oligopolistic market tendencies with the largest 2 firms controlling over 70% of the market, These findings are in agreement with those of Mercy Ngum et al. (Citation2020) who found similar findings for soybean marketing in Kenya. This is partly due to the high investment required in terms of huge volumes and other inputs, which makes it hard for small and medium-scale processors to favorably compete with large-scale companies. Although 2 of the medium-scale processors acquired machinery, other factors such as operating them at optimum capacity could still hinder them from competing favorably.
Table 3. Market shares, concentration ratio, and market description
At the distribution stage, the average market share for the distributors was 1.1% with the largest 2 firms controlling 8.5% of the market. This market exhibits tendencies of perfect competition where all actors are price takers; no single firm controls the market or can set a price of its own. The study findings corroborate with a similar trend for soybeans in Malawi (Nzima & Dzanja, Citation2015). The variations in the products and brands make it hard to charge a uniform price both at production and distribution keeping the shares almost equal. However, even small-scale bean processors can use the differentiation strategy to target the local market and compete with the already existing brands by especially capturing the remaining niches such as snacks and dehydrated pre-cooked beans. Dirisu et al. (Citation2013) urge that the ability of any product to stand out will/ might guarantee the success of the firm. Local bean processors can use the opportunity to differentiate their products by the production of precooked dehydrated snacks to capture wider niches that are left out by canned and baked beans.
4.2.1. Barriers to market entry and exit
The processed bean products on the market were generally differentiated according to the categories of processors and distributors. Results (Table ) show that repacked beans were the cheapest but there were statistically significant differences in the prices that the 3 processor categories sold them F(2,5) = 7.61, p = .04. Post hoc analysis using Scheffe showed that the significant difference arose from the price that the large scale and small-scale processors sold the repacked beans they produced (Table ). Bean flours were cheaper compared to canned and baked beans, they are mainly handled by small and medium processors, and there were no statistically significant differences in the prices charged by these categories of processors for this particular product. Baked and canned beans were the most expensive, though these were mainly produced by large-scale processors and sold by established supermarkets and processor outlets only.
Table 4. Products on the market and relative prices (dollars)
The initial investment can be a great hindrance to entry into an industry or market. Study findings show that the average initial investment by the processors was mainly the purchase of equipment or acquisition of premises where they could conduct the business from. If the equipment cannot be used for any other product but only the processing of beans, then this investment will turn into a sunk cost.1 Available evidence (Mañez & Love, Citation2020) shows that despite the fact that both large-scale and small and medium enterprises can benefit from sunk costs such as research and development, only the large-scale firms are more likely to benefit more in terms of productivity and performance hence skewing competition to the large firms. Only 6 processors had purchased equipment at an average cost of $6288 and acquired proper or designated premises for their business. The purchase and ownership of the right processing equipment is still a great hindrance to value addition by processors in a number of agricultural value chains in Sub-Saharan Africa, this being the case for beans and soybean in Kenya and Uganda (Mercy Ngum et al., Citation2020). While the distributors had invested an average of $220 as initial capital for the processed bean business, much of this was the amount needed to purchase the initial stock for the goods well as a small amount was dedicated to the the acquisition of space for displaying the products. The study findings are in agreement with Ukav (Citation2017) who found that initial investments is a key barrier to existing and potential business entrants.
Other costs such as operational costs can be a great hindrance to market entry. It should be noted that on top of the initial investment, both processors and distributors incurred additional costs to run businesses. These costs (calculated per month) varied greatly between the different categories of processors, small-scale processors incurred monthly operational costs of $28.6, while the large-scale processors incurred $3950 per month (Table ). However, an analysis of variances showed that there were no statistical differences in these processors’ operational costs F(2,16) = 2.34, p = .13. The distributors incurred a maximum of $280 per month to run the businesses and these were mainly for payment of rent, wages, transportation, and packaging materials among others.
Table 5. Investments and Costs incurred by the processors and distributors
Whereas the cost of inputs may not be considered a great hindrance to market entry, it can hinder a firm from exiting given the amount of money invested in inputs. Large-scale processors invest up to $41,520 to purchase inputs such as grain and packaging materials and results confirm that there were statistical differences in the monthly costs of inputs incurred by these 3 categories of processors, F(2,16) = 5.05, p = 0.0129 (Table ). Further analysis using a Scheffe post hoc indicated that there are differences between input costs of large-scale and small-scale processors as well as medium-scale and small-scale processors. The study findings agree with those of Ahmed et al. (Citation2017) who found transaction costs to be a key impeding factor to the performance of livestock markets in Sudan.
Other barriers to effective competition such as information asymmetry were also examined (Table ). Results show that fellow actors were the most common source of information on processors (57%) and distributors (83%). This implies that there is a quick information flow among actors who are in the same line of business, which makes it easy for actors to alter their marketing strategies at their earliest convenience. Although both markets seemed transparent due to the actor’s ability to properly obtain the necessary information from fellow actors, processors’ use of brokers (23%) as channels of information could be a hindrance to new entrants, since brokers have been reported to provide the wrong information to protect some firms (Laibuni & Omiti, Citation2014). This could avert information asymmetry, especially about input costs, and distort the market. This implies that weak information sharing could result in market distortions in terms of scarcity or abundance of products as reported by Bhattarai et al. (Citation2013) in the organic vegetable supply chain in Kathmandu, Nepal. In a seemingly similar study Ordofa et al. (Citation2021), suggested strengthening institutions that can convey reliable and timely information to so as to decrease the oligopolist nature of the dairy market in Ethiopia, the same could be done for the processed bean markets.
Table 6. Information asymmetry and challenges to bean processors and distributors
High production costs (32%) and competition (29%) were the most pressing challenges reported by bean processors, while low stock turnover (28%) and competition (24%) were the most pressing issues for bean distributors. Other challenges include: limited or lack of market for processed bean products. Overall, there could be a number of diverging arguments such as that on the level of competition and competitiveness in the processed bean market, especially at the processing node, but the major barriers to entry and exit were the initial investment, operational costs, limited product demand, and information asymmetry.
4.3. Market performance
In examining the market performance, the selling prices, purchase prices, costs of marketing, and marketing margins were analyzed. In calculating the average selling price for large-scale processors, a left-over figure was incorporated and the average price of $2.08 was attained (Table ). Results show that the price and marketing margin for processors were significantly higher for large-scale processors compared to small and medium-scale processors. An analysis of variances showed that there were statistically significant differences in the selling prices, F(2,16) = 13.03, p = .0004, and the marketing margins F(2,16) = 13.07, p = 0.004. Further analysis using the Sidak post hoc criterion for significance indicated that the average differences were in the average prices of small-scale and large-scale processors as well as between medium and largescale processors. The large-scale processors, therefore, obtained the highest marketing margins of $0.9. This could partly be attributed to the associated high cost of production and making of more informed decisions which could be influenced by other factors. This implies that the performance of small and medium processors could become better if their margins are increased. Based on the findings of Bonabana-Wabbi (Citation2013), Nzima et al. (Citation2014), and Muhaimin and Wijayanti (Citation2019) and our findings, we can ably conclude that the performance of actors in any agricultural value chain could increase with the increase in the marketing margins. Other ways to enhance financial performance could be through increasing sales and this can apply to the processors who in the long run need an immense increase in sales so as to perform well and compete favorably within the sector.
Table 7. Marketing margin analysis for processors and distributors
In terms of the unit costs, there were no significant differences in the unit costs incurred. Generally, distributors incur a relatively small cost ($0.07) for each kilogram of product handle compared to the processors who incur relatively higher costs ($0.48) to produce these products. The study findings are in agreement with Nakazi et al. (Citation2019) who emphasized the need for marketing strategies that keep the costs low for the common bean processing business to remain competitive in Kenya.
5. Implications for the bean processing industry
As Kenya continues to grapple with unmet end-market demand for processed and quick-cooking beans due to increasing urbanization, investment into the common bean processing industry offers an alternative mechanism to meet the growing demand for quick-cooking and fast foods. However, for existing and potential entrants into the business, several aspects need to be considered: (a) The market structure of the processed bean industry in the study area is oligopolistic at the processing stage and exhibits tendencies of perfect competition at the distribution stage. There are only a few local bean processors producing 4 major bean products which offer opportunity; (b) The majority of the processed bean products are distributed by supermarkets which are not reachable to all potential customers; (c) High initial investment, high competition, and brand loyalty to already established foreign products were the key barriers to entry.
In line with the study findings, it is recommended that efforts should be made to attract investors to serve unmet market niches in processed bean products such as dry precooked beans which are not yet tapped into through strengthening the communication channels that can convey right and timely information to the investors, offering incentives such as tax exemptions and low-interest loans. In addition, more small and medium-scale enterprises are encouraged to join the bean processing industry to compete favorably with foreign products. This could be done by subsidizing them, especially by relieving them from high electricity bills (domestic bills) and exempting them from tax so that they can focus on procurement of the processing equipment. The high competition and low stock turnover for the products at the distribution level can only be beaten by the distributor’s strategies used to get the products to the consumers. Additionally, products produced should be evenly distributed to areas that can be reached by the intended market such as retail shops. Sensitization of the public of the available products on the market may reduce the low stock turnover and increase demand for locally manufactured products, this should not only be the direct actor’s obligation but to all stakeholders, especially the government arms. Further research should use more dynamic measures such as market share stability and returns on investment to further investigate the processed bean industry
Availability of data and materials
Data that were used for this study are available upon request from the Authors.
Acknowledgements
The authors sincerely appreciate the funding from the IDRC/CultiAF precooked bean project. Sincere gratitude is extended to the CIAT and KARLO teams in Nairobi for hosting the corresponding author during the data collection period. Appreciation still goes to the Scientists from the Legumes department at the National Crops Resources Research Institute (Uganda) and the teams from Makerere University who worked hand in hand with them for their constant courage and invaluable information during the compilation of these study findings.
Disclosure statement
No potential conflict of interest was reported by the author(s).
Additional information
Funding
Notes on contributors

Immaculate Babirye
Immaculate Babirye is a Socio-Economic Research Associate with the Legumes Research Program at the National Crops Resources Research Institute a constituent institute of the National Agricultural Research Organization of Uganda. She holds a Master’s Degree in Agribusiness Management from the Department of Agribusiness and Natural Resources Economics, Makerere University, Uganda. Her research focus is on the development of Agricultural value chains with an emphasis on market linkages in developing Economies. She is a member of the “Uganda Agricultural Economists Association”.
Florence Nakazi
Florence Nakazi Economic Policy Research Centre (EPRC), Sectoral Department, Uganda
Eliud Abucheli Birachi
Eliud Abucheli Birachi The Alliance of the International Centre for Tropical Agriculture (CIAT) and Bioversity International (Alliance)
Jackline Bonabana Wabbi
Jackline Bonabana Wabbi Makerere University, Department of Agribusiness and Natural Resource Economics Kampala Uganda
Michael Adrogu Ugen
Michael Adrogu Ugen National Agricultural Research Organization (NARO), National Semi-Arid Resources Research Institute (Nasarri) Uganda.
Gabriel Elepu
Gabriel Elepu Makerere University, Department of Agribusiness and Natural Resource Economics Kampala Uganda
References
- Achike, A. I., & Anzaku, T. A. K. (2010). Economic analysis of the marketing margin of benniseed in Nasarawa State, Nigeria. Journal of Tropical Agriculture, Food, Environment and Extension, 9(1), 47–18. https://doi.org/10.4314/as.v9i1.57459
- Ahmed, H., Abdelfattah, A., Fadlalla, B., Bauer, S., & Ezzat, S. (2017). Factors affecting structure, conduct and performance of livestock markets in Butana Area, Sudan. Journal of Rangeland Science, 7, 3. https://web.archive.org/web/20180410182859id_/http://www.rangeland.ir/article_528615_885ad0625989d8fcce56dc0d5fe1d150.pdf
- Aliyi, I., Faris, A., Ayele, A., Oljirra, A., & Bayessa, M. (2021). Profitability and market performance of smallholder vegetable production: Evidence from Ethiopia. Heliyon, 7. 9. https://doi.org/10.1016/j.heliyon.2021.e08008
- Aseete, P., Katungi, E., Bonabana-Wabbi, J., Birachi, E., & Ugen, M. A. (2018). Consumer demand heterogeneity and valuation of value-added pulse products: A case of precooked beans in Uganda. Agriculture & Food Security, 7(1), 51. https://doi.org/10.1186/s40066-018-0203-3https://doi.org/10.1186/s40066-018-0203-3
- Ayele, S., Zemedu, L., & Gebremdhin, B. (2017). Analysis of market structure, conduct and performance of Beef Cattle: The case of Dugda district, East Shoa zone, Oromia regional state, Ethiopia. Journal of Biology, Agriculture and Healthcare, 7, 5. https://core.ac.uk/reader/234662270
- Bhattarai, S., Lyne, M. C., & Martin, S. K. (2013). Assessing the performance of a supply chain for organic vegetables from a smallholder perspective. Journal of Agribusiness in Developing and Emerging Economies, 3(22), 2. https://doi.org/10.1108/JADEE-12-2012-0031
- Bobel, I. (2010). Market structure, conduct and competitive strategy.
- Bonabana-Wabbi, J. (2013). The performance of potato markets in South Western Uganda. Journal of Development and Agricultural Economics, 5(6), 225–235. https://doi.org/10.5897/JDAE12.124https://doi.org/10.5897/JDAE12.124
- Chemining’wa, G., Kitonyo, O., & Nderitu, J. (2014). Status, challenges and marketing opportunities for canning Navy Bean in Kenya. African Journal of Food, Agriculture, Nutrition and Development, 14(5), 2073–2087. https://doi.org/10.18697/ajfand.65.12980
- de Figueirêdo Junior, H. S., Meuwissen, M. P. M., & Oude Lansink, A. G. J. M. (2014). Integrating structure, conduct and performance into value chain analysis. Journal on Chain and Network Science, 14(1), 21–30. https://doi.org/10.3920/JCNS2014.0231https://doi.org/10.3920/JCNS2014.0231
- Dirisu, J. I., Iyiola, O., & Ibididunni, O. S. Product differentiation: A tool of competitive advantage and optimal organizational performance (A study of Unilever Nigeria PLC). European Scientific Journal, 9(34), 258–281. https://doi.org/10.19044/esj.2013.v9n34p
- Handy, C. R. Kohls, Richard L, and Joseph N. Uhl. (1985). Marketing of agricultural products, 6th ed. New York: Macmillan Co., 1985, xi + 624 pp., price unknown. American Journal of Agricultural Economics, 67(4), 891–892. https://doi.org/10.2307/1241838
- IDRC. (2014). Precooked beans for food, nutrition, and income in Kenya and Uganda. www.idrc.ca/cultiaf
- Kelemework, G. (2015). White Pea Bean (Phaseolus vulgaris L.) Value Chain Analysis: The Case of Adami Tulu Jido Kombolcha District, Eastern Shewa Zone, Oromia National Regional State, Ethiopia. Haramaya University.
- Khantimirov, D. (2017). Market share as a measure of performance: Conceptual issues and financial accountability for marketing activities within a firm. Journal of Research in Marketing, 7(3), 587–592. https://techmindresearch.org/index.php/jorm/article/view/717/482
- Kizito, A. M. (2019). The structure, conduct, and performance of agricultural market information systems in sub-Saharan Africa. Gates Open Res, 3(858), 858.
- Laibuni, N. M., & Omiti, J. M. (2014). Market Structure and Price: An Empirical Analysis of Irish Potato Markets in Kenya. http://www.future-agricultures.org/wp-content/uploads/pdf-archive/ECFP_Report_Laibuni.pdf
- Lakor, J., Elepu, G., Buyinza, M., & Nyeko, P. (2016). Analysis of Tamarindus (Tamarindus Indica L.) Value Chain in Uganda: Identification of opportunities and constraints to its commercialization and domestication. Journal of Agriculture and Environmental Sciences, 5(1), 101–112. https://doi.org/10.15640/jaes.v5n1a11
- Lelissa, T. B., & Kuhil, A. M. (2018). The structure conduct performance model and competing hypothesis- a review of literature. Research Journal of Finance and Accounting, 9(1), 76–89. https://www.researchgate.net/publication/322165461
- Maertens, M. (2011). Supply chains in export agriculture, competition, and poverty in Sub-Saharan Africa. European Review of Agricultural Economics, 38(44), https://doi.org/10.1093/erae/jbr049
- Mañez, J. A., & Love, J. H. (2020b). Quantifying sunk costs and learning effects in R&D persistence. Research Policy, 49(7), 104004. https://doi.org/10.1016/j.respol.2020.104004
- Mercy Ngum, A., Bett (Phd), E. K., & Mugwe (Phd), J. N. (2020). Performance of soybean marketing in emby, Tharaka Nithi and Meru Countries, Kenya. American Research Journal of Agriculture, 7(1), 1–7. https://doi.org/10.21694/2378-9018.21002https://doi.org/10.21694/2378-9018.21002
- Muhaimin, A. W., & Wijayanti, V. (2019). Analysis of market structure, conduct and performance of corn (Zea Mays L.) in Kedung Malang village, papar district, Kediri regency, East Java. International Journal of Civil Engineering and Technology (IJCIET), 10, 10–16.
- Nakazi, F., Babirye, I., Birachi, E., & Ugen, M. A. M. A. (2019). Exploring retailer marketing strategies for value added bean products in Kenya. International Food and Agribusiness Management Review, 22(5), 675–687. https://doi.org/10.22434/IFAMR2018.0073https://doi.org/10.22434/IFAMR2018.0073
- Nzima, W. M., & Dzanja, J. (2015). Efficiency of Soybean markets in Malawi: Structure, conduct and performance approach. International Journal of Business and Social Science, 6(4), 162–170.
- Nzima, W. M., Dzanja, J., & Kamwana, B. (2014). Structure, conduct and performance of groundnuts markets in Northern and central Malawi: Case studies of Mzimba and Kasungu districts. International Journal of Business and Social Science, 5, 6.
- Odhiambo, M. O., Oluoch-kosura, W., & Kibiego, M. B. (2006). Analysis of the structure and performance of the beans marketing system in Nairobi Poster paper prepared for presentation at the International Association of Agricultural Economists Conference, Gold Coast, Australia. 1–12. http://erepository.uonbi.ac.ke/handle/11295/73250
- OECD. (2021). Methodologies to measure market competition. OECD Competition Committee Issues Paper. https://oe.cd/mmmc
- Ordofa, G., Zemedu, L., & Tegegne, B. (2021). Structure conduct and performance of dairy market in Ada’a Berga district, Ethiopia. Cogent Food and Agriculture, 7(11), 1. https://doi.org/10.1080/23311932.2021.1918878
- Pavic, I., Galetic, F., & Piplica, D. (2016). Similarities and differences between the CR and HHI as an indicator of market concentration and market power. British Journal of Economics, Management & Trade, 13(1), 1–8. https://doi.org/10.9734/BJEMT/2016/23193https://doi.org/10.9734/BJEMT/2016/23193
- Sexton, R. J., & Xia, T. (2018). Increasing concentration in the agricultural supply Chain: Implications for market power and sector performance. Annual Review of Resource Economics, 10 https://doi.org/10.1146/annurev-resource-100517-023312
- Stojkic, Z., & Bosnjak, I. (2019). An overview of performance measurement methods in SMEs. Proceedings of the 30th DAAAM International Symposium, 30(1), 0518–0524. https://doi.org/10.2507/30th.daaam.proceedings.070
- Ukav, I. (2017). Market structures and concentration measuring techniques. Asian Journal of Agricultural Extension, Economics & Sociology, 19(4), 1–16. https://doi.org/10.9734/AJAEES/2017/36066https://doi.org/10.9734/AJAEES/2017/36066
- Uzunidis, D. (2016). Propaedeutics in the theory of the industrial organisation: The SCP (structure, conduct, performance) model. Journal of Innovation Economics & Management, N°20, (2), 197–215. https://doi.org/10.3917/jie.020.0197
- van der Zwan, P., Thurik, R., Verheul, I., & Hessels, J. (2016). Factors influencing the entrepreneurial engagement of opportunity and necessity entrepreneurs. Eurasian Business Review, 6(3), 273–295. https://doi.org/10.1007/s40821-016-0065-1https://doi.org/10.1007/s40821-016-0065-1
- Wambua, S., Karanja, D., Birachi, E., & Zakayo, E. (2016). An assessment of the canning bean value chain in Kenya: Opportunities and challenges. The Pan-African Grain Legume and World Cowpea Conference, 11.