
 ?Mathematical formulae have been encoded as MathML and are displayed in this HTML version using MathJax in order to improve their display. Uncheck the box to turn MathJax off. This feature requires Javascript. Click on a formula to zoom.
Abstract
Sugarcane plays an important role in the government of Tanzania’s aim of becoming sugar-sufficient; however, sugar production remains low in the country despite numerous interventions undertaken by successive governments. The study adopted the vector error correction model (VECM) to examine the acreage supply response of sugarcane out-growers to changes in price and non-price factors using time-series data spanning 30 years. Results from the study showed that a percentage increase in the price of sugarcane leads to a 0.870% and 2.887% increase in the acreage of sugarcane in the short-run and long-run, respectively. A percentage increase in the price of rice on the other hand reduced acreage allotment by 0.383% and 1.875% in the short-run and long-run, respectively. A percentage increase in other factors such as rainfall and technological innovations leads to a 5.241% and 0.030% increase in the area under sugarcane in the long-run. The price of sugarcane is an essential determining factor of sugar production in Tanzania due to its implications for the area under sugarcane production. The study recommends the deregulation of sugarcane prices by the sugar estates to ensure that sugarcane out-growers can benefit from improved prices given that sugarcane prices significantly influenced farmers’ acreage supply response.
PUBLIC INTEREST STATEMENT
Sugarcane is essential to the development of the sugar industry of the United Republic of Tanzania. In Tanzania, sugarcane production is undertaken by sugarcane estates/plantation and out-growers who are largely smallholders linked to large plantations that belong to the sugar producing companies. Sugar production in Tanzania is monopolised by four main sugar companies, as such, market forces are stifled in the determination of both input and output prices. With sugarcane out-growers being an important part of the sugar value chain, it is essential to understand how they respond to both market and non-market forces. Knowledge of the responsiveness of sugarcane out-growers will enable the government as well as the sugar companies to institute policies and measures that will ensure improved welfare of the out-growers. Improved conditions of the out-growers will benefit the sugar industries as out-growers will now be motivated to produce more and quality sugarcane to feed the sugar industry.
1. Introduction
Sugarcane (Saccharum officinarum) is an important crop grown in different parts of the world because of its multiple uses as well as its nutritional and economic benefits. Sugarcane accounts for almost 80% of world sugar production (Rumánková & Smutka, Citation2013; Waghmare & Khan, Citation2021). Besides sugar production, sugarcane is also used in producing several important products such as alcohol, ethanol which is used as fuel, bagasse used for paper products as well as chipboard and press mud which is used as a rich source of organic matter and nutrients for crop production (Arumugam et al., Citation2014). Global sugarcane production is largely centred in countries such as Brazil, India, China, Pakistan, and Thailand (FAO [Food and Agriculture Organization of the United Nations], Citation2023).
Sub-Saharan African (SSA) countries contribute just about 5% of global sugar production with six countries, namely South Africa, Sudan, Eswatini, Zambia, Mauritius, and Kenya accounting for over 50% of the region’s overall sugarcane production (Ambetsa et al., Citation2020). Despite its underwhelming contribution to global sugarcane production, SSA countries are regarded to exhibit the most production potential because of the relatively lower cost of production, a supporting high growth rate and sucrose conversion as well as the presence of ideal growing conditions (e.g., undiluted topography, clay soils, available water for supplementary irrigation and ambient weather conditions) (Hess et al., Citation2016). Despite its current low levels of production, Tanzania has the potential to increase its exports of sugar to other African countries by about $11.9 million annually under current tariff conditions on the African continent (International Trade Centre, Citation2021).
Sugarcane production is an important subsector of the Tanzanian economy. The subsector contributes about 35% of the gross output of the food-manufacturing sector and about 10% of the total manufacturing value-added (Massawe & Kahamba, Citation2018). Sugarcane production in Tanzania is solely undertaken by sugarcane estates/plantations and out-growers who are largely smallholder farmers linked to large-scale estates/plantations owned by sugar manufacturing companies (Bakari, Citation2018). The sugarcane value chain of Tanzania directly employs over 90,000 people and an additional 57,000 people are employed indirectly (Andreoni et al., Citation2020; Massawe & Kahamba, Citation2018).
Sugarcane production in Tanzania is solely meant to provide raw materials for the sugar factories in the country in order to bridge the gap between domestic sugar supply and demand. To close the sugar import gap, the government has set the target of increasing local sugar production from 320,000 tons to 420,000 tons per annum (Masare, Citation2018; SBT [Sugar Board of Tanzania], Citation2021). However, increasing domestic sugar production is inadvertently linked to increasing domestic sugarcane production because sugar factories in Tanzania greatly depend on the local sugarcane supply (Bélair, Citation2021; SBT, Citation2021). This is because, the sugar sector of Tanzania is highly regulated with just four active sugar companies (namely, Kilombero Sugar Company Limited [KSCL], Mtibwa Sugar Estate [MSE], Kagera Sugar Limited [KSL], and Tanganyika Planting Company [TPC]) (Andreoni et al., Citation2020). These companies are protected from competition thereby insulating them from the need to invest in improved technologies (Eriksen, Citation2018). Therefore, the expansion of sugarcane production is the main factor influencing sugar production in Tanzania despite the low technology and productivity levels associated with the sector (Bélair, Citation2021).
The government of Tanzania has put in place numerous interventions to incentivize local sugar-producing firms to increase their production, while some of these interventions such as the tight state control over sugar imports (Eriksen, Citation2018), which, for example, led to an increase in sugar import duty from 25% to 35% in 2019 (Masare, Citation2018), may serve to encourage local sugar production. Other interventions such as the setting of indicative prices (price caps) for sugar to suppress domestic sugar prices and granting sugar import licences/quotas occasionally discourage local sugar-producing firms (Chisanga et al., Citation2016). Due to the presence of such counteracting interventions coupled with other factors such as low land and labour productivity, sugarcane production in Tanzania is reportedly lower compared to fellow SSA countries like Kenya and South Africa (Sambuo, Citation2015; Sulle et al., Citation2014). The low production, therefore, calls into question the effectiveness of such government interventions and farmers’ responsiveness to such interventions.
Studies on supply response date back to the seminal work of Nerlove (Citation1958). Subsequently, numerous studies (see; Agbogo & Okorie, Citation2014; Devadoss & Luckstead, Citation2010; French & Matthews, Citation1971; Mustafa et al., Citation2016; Wani et al., Citation2015) have examined the supply response of different crops to different factors such as prices, climatic conditions, and input levels among others. Estimating supply response models provides an insight into understanding the pricing and farmers’ production decision-making processes (Bor & Bayaner, Citation2009); however, estimates may vary depending on the estimation technique used. Econometric estimation of supply response can be categorised under three main approaches; these are the direct reduced form approach, the two-stage or indirect structural form approach and the cointegration approach (Mustafa et al., Citation2016). For a perennial crop like sugarcane, the cointegration approach has been proven to provide robust estimation, hence its adoption for this study. Although studies on sugarcane supply response have been conducted elsewhere (e.g., Mutua (Citation2015) in Kenya, Muchetu and Mazwi (Citation2015) in Zimbabwe, and Suleiman (Citation2001) in Ethiopia), there is a need for a country-specific study to help inform policy owing to the differences in socio-economic circumstances and most importantly the differences in political frameworks and institutions across countries. All previous empirical studies on sugarcane undertaken in Tanzania had a different focus other than acreage supply response. For example, (i) Msuya and Ashimogo (Citation2005) estimated the technical efficiency of Mtibwa sugar estate out-growers scheme and compared the efficiency level between out-growers and non-out-growers, (ii) Bombo (Citation2013) examined the transaction costs among sugarcane out-growers schemes in the Morogoro region, and (iii) Bakari (Citation2018) estimated the farm level technical efficiency, measured profitability of out-growers and lastly determined constraints sugarcane out-growers faced. These studies have provided insight into factors necessary to improve the capabilities of sugarcane out-growers in Tanzania. However, none of them addressed out-growers responsiveness to price and non-price incentives and the level of adjustments required by sugarcane out-growers to meet the needed sugarcane supply which will lead to the attainment of the intended sugar sufficiency in the country. Therefore, the aim of this study was to examine Tanzanian sugarcane out-growers’ acreage responsiveness to price and non-price factors. Specifically, the objectives of the study were to (1) estimate a simple trend of growth in area, production, and yield per hectare of sugarcane out-growers in Tanzania, and (2) estimate the acreage supply response of sugarcane out-growers in Tanzania to price and non-price factors for the period 1991 to 2020.
2. Literature review
2.1. Theoretical review
The multi-period theory of the firm is the underlying theory of this study. The theory states that given the alternative modes of resource allocation, farmers aim to maximize the present value of their profit from production subject to the technical constraints imposed by their production function (Handerson & Quandt, Citation1971). Peralta and Swinton (Citation2015) note that the optimal decision for planting perennial crops such as sugarcane is dependent on the linkage between the relative prices of the output and the fraction of the marginal products of the constrained fixed resources. Given the perennial nature of sugarcane, that is, sugarcane planted in year t can be harvested for multiply year periods without the need to replant, a sugarcane farmer is assumed to maximize accrued wealth over a multi-period time frame.
2.2. Empirical literature review
Devadoss and Luckstead (Citation2010), and Mustafa et al. (Citation2016) observe that perennial crops such as sugarcane have four distinguishing features that must be considered in their modelling. These peculiar features are that; (1) perennial crops are a long-term investment; (2) there is a relatively long gestation period between initial cultivation and first harvest; (3) upon reaching maturation, there is an extended period of productivity which is then followed by a gradual decline in production; and (4) crops are removed once the decline in productivity reaches its pinnacle. These four features indicate that the supply of perennial crops is dynamic and must therefore be modelled differently from annual crops. In this regard, different studies have adopted different modelling techniques to estimate the supply response of several perennial crops.
Kumawat and Prasad (Citation2012) analysed the supply response of sugarcane in India using time-series data for the period 1990 to 2010 by applying the Nerlovian partial adjustment model. The authors estimated two distinct supply functions using the area under cultivation and yield as the dependent variables in each model. The results of the study revealed that price factors were the main drivers of area expansion, while non-price factors such as rainfall were the main determinants of yield. Additionally, Saddiq et al. (Citation2014) examined the acreage response of sugarcane to price and non-price factors in Pakistan using time-series data from 1970 to 2011. While following the Nerlovian partial adjustment linear and non-linear models, the study adopted the Vector Auto Regression technique to estimate the effect of price and non-price factors on the acreage allocated to sugarcane. The result of the study indicated that sugarcane prices had a positive significant effect on acreage allocated to sugarcane, while non-price factors such as rainfall had no significant impact on acreage allocation.
Another study in India by Kumar and Sharma (Citation2006) examined the supply response of three perennial crops, that is, rubber, tea, and coffee. In their modelling, the authors noted that in the short-run, farmers can only make adjustments to improve yields while long-run adjustments can be in the form of changes in acreage and replanting. To this effect, the short-run supply response was estimated by fitting a yield function while the long-run supply response was estimated by fitting an acreage function. The results revealed that prices were significant determinants of the supply of all three crops both in the short-run and the long-run. Rainfall was found to be significant for all crops except the short-run supply of rubber. In another study, Fabian (Citation2013) estimated the supply response of cashew and sesame to price and non-price factors in Tanzania for the period 1995 to 2010. Using the Nerlovian partial response function, the results of the study revealed that farmers were more responsive to price changes in the long-run than in the short-run.
Abdel Hameed et al. (Citation2009) estimated the supply of cocoa in Malaysia using time-series data from 1975 to 2008 while applying the seemingly unrelated regression (SUR) estimation procedure. The results of the study indicated that the supply of cocoa as measured by production was significantly determined by the cocoa production of the previous year, the price of cocoa in the previous 2 years as well as the area harvested. Much et al. (Citation2011) examined the supply response of rubber in Cambodia using data from 1990 to 2008. The study applied partial adjustment and adaptive expectation mechanisms to estimate the supply response models. Results from the study revealed that rubber prices, rainfall, and lagged dependent variables were positive determinants of the supply of rubber, while the prices of alternative crops negatively influenced the supply response of rubber. Long-run estimates were relatively greater than short-run estimates, indicating that rubber farmers were able to adjust more in the long-run than in the short-run.
In another study of the supply of perennial crops, Soontaranurak and Dawson (Citation2015) estimated the acreage supply response of rubber in Thailand using time-series data from 1962 to 2009. The authors made the case that acreage was the best variable to measure agricultural supply because it measured the intended supply of farmers. Using a cointegration approach, the authors estimated the acreage supply response and reported the existence of a unique long-run relationship between the area planted, the price of rubber, and the subsidy for replanting. The study further revealed that farmers were more responsive in the long-run to changes in rubber prices than in the short-run. Wani et al. (Citation2015) also examined the supply response of apples and pears in Jammu and Kashmir using time-series data from 1981 to 2013. Using three estimation approaches, that is, the Nerlovian model, the Engle–Granger test, and the vector error correction model, the authors revealed that own prices and the price of competitive crops both had a positive effect on the supply of apples and pears. Additionally, it was established that farmers were more responsive in the long-run. Mustafa et al. (Citation2016) further examined the supply response of rubber in Malaysia using time-series data for the period 1990 to 2014. The authors estimated the supply response of rubber using the vector error correction model and established the existence of a unique long-run equilibrium relationship among planted acreage, rubber prices, and fertilizer prices. The results of the study indicated that the price of rubber had a positive effect on acreage both in the short-run and the long-run.
Based on the reviewed literature, we established that the most appropriate estimation method for sugarcane supply response in Tanzania was the vector error correction model which has been proven to be efficient in estimating the supply response of perennial crops such as sugarcane. Additionally, the period of 1991 to 2020 was established to be sufficient enough to establish long-run relationships between our variables of interest. Most importantly, our choice of acreage as the right measure of supply was informed by the literature on perennial crops which indicated that acreage was more appropriate since it measures the intended supply by a farmer.
3. Methodology
3.1. Research design
The study employed a time-series design. This design is a subcategory of the longitudinal research designs which is used in the examination of large series of observations of the same variables over a period of time. In this study, data were gathered for a set of variables over a 30-year period.
3.2. Data
The data used for this study were drawn from government and international sources. The study used annual time-series data spanning from 1991 to 2020, which is a 30-year span capable of demonstrating the long-run relationship between the variables of interest. Data on sugarcane production and acreage was obtained from the Sugar Board of Tanzania, while data on sugarcane prices were the average of sugarcane prices obtained from the various sugar companies (specifically, Mtibwa, Kilombero, and Kagera sugar companies). Rice and maize were used as competing crops of sugarcane, the data on the prices of rice and maize was sourced from the Tanzanian Ministry of Agriculture. Rice was considered the appropriate competing crop to sugarcane because farmers alternate between rice and sugarcane production on their farmlands based on the assumption that their lands are suitable for the cultivation of both rice and sugarcane (Suchato et al., Citation2021). Although rice cultivation may be low around the areas of the sugar factories, it is appropriate to consider it as a competing crop because such locations have been identified as suitable for large-scale rice production (Smalley et al., Citation2014) and that farmers may not have to undergo substantial changes to switch from sugarcane cultivation to rice cultivation. Additionally, maize was considered as a competing crop because it is cultivated on over 45% of Tanzania’s arable land and contributes about 50% of the income of farming households (Food, Citation2023). Data on annual rainfall were obtained from the World Bank. Rainfall was used because variations in agricultural production can be attributed to variations in the weather (Ogbu & Gbetibouo, Citation1990). All prices were deflated to adjust for inflation using 2010 as the base year (2010 = 100) as obtained from the World Bank. The equation used to obtain the real prices is given as:
Table presents the data used in the study with their description and sources.
Table 1. Data used, measurement unit, and sources
3.3. Empirical approach
3.3.1. Trend estimation of growth in acreage, yield per hectare, and production of sugarcane
Following earlier studies (see Fabian, Citation2013; Khan et al., Citation2002), an exponential model was used to estimate the trend growth in the acreage, yield per hectare, and total output of sugarcane in Tanzania. The model was specified in Equationequation (2)(2)
(2) as:
Where Y = total acreage/yield/output, a = intercept, b = average yearly trend growth rate and t = time period. The year 1991 was regarded as period 1, and period 30 was 2020. The exponential model was linearized by introducing the natural logarithm to obtain the equation specified in Equationequation (3)(3)
(3) .
3.3.2. Estimation of sugarcane acreage supply response model
Following previous studies (Atta-Aidoo, Citation2019; Mustafa et al., Citation2016; Wani et al., Citation2015), the study adopted the vector error correction model (VECM) to estimate the acreage supply response of sugarcane out-growers in Tanzania. This method was adopted because conducting a co-integration analysis overcomes the limiting dynamic specification challenge of other supply response models such as the Nerlovian model faces (Thiele, Citation2000). Additionally, the VECM possesses the ability to establish distinct cointegration vectors and it is consistent with the forward-looking behaviour of smallholder farmers (Mustafa et al., Citation2016; Wani et al., Citation2015).
The VECM is a special case of the vector autoregression for variables that are stationary in their differences (Obayelu & Salau, Citation2010). This method was appropriate because it prevents the generation of spurious regression results which are mostly associated with time-series data (Granger & Newbold, Citation1974). The VECM for the acreage supply response of sugarcane is specified in Equationequation (4)(4)
(4) as:
Based on the general specification (Equationequation 4(4)
(4) ), the short-run and long-run supply functions are given as Equationequations (5)
(5)
(5) and (Equation6
(6)
(6) ) respectively:
And
Where:
∆ = the difference operator for the respective variables, A = sugarcane acreage measured in hectares, SP = real price of sugarcane per ton, RP = real price of rice per ton, MP = real price of maize, R = mean annual rainfall measured in millilitres, R2 = square of mean annual rainfall measured in millilitres, Y = output of sugarcane in the previous year as a proxy for non-acreage inputs and other exogenous variables that affect productivity. TR = time trend as a proxy for farming technology (Alemu et al., Citation2003; Atta-Aidoo, Citation2019). μt and = stochastic error terms. β and α = short-run and long-run supply parameters, respectively, k is the maximum number of lags included in the model as determined by the data properties and γ is the error correction mechanism that measures the speed of adjustment from short-run disequilibria to long-run steady-state equilibrium and ln is the natural logarithm operator. Estimation of agricultural supply response models can be achieved using data on total production and its two components, tapped acreage and yield. However, acreage is preferred because it measures the intended supply and that yield is subject to more random variation than acreage (Soontaranurak & Dawson, Citation2015). The hypothesised signs of the variables used in the study are presented in Table .
Table 2. Variables and their hypothesised signs
To estimate the specified model, we began by conducting a unit root test for stationarity using the Augmented Dickey–Fuller (ADF) test. Secondly, we followed the Akaike Information Criterion (AIC), Schwarz Information Criterion (SC), and the Hannan Quinn Information Criterion (HQ) to determine the optimal lag length for the data. The selection of an optimal lag length had a significant economic implication, because it determines the maximum number of periods from the previous period and the independent variables affected the supply response in a given period. Thereafter, a Johansen cointegration test was conducted to establish a genuine long-run equilibrium relationship between the dependent and the independent variables. This cointegration test was based on maximum likelihood estimation and two statistics, namely trace statistic and maximum Eigenvalues (Johansen, Citation1987). After establishing non-stationarity, optimum lag length, and cointegration among the data, we then proceeded to estimate the VECM.
Post-estimation tests were conducted to ensure that none of the assumptions of the classical linear regression was violated. Tests conducted include the Breusch–Godfrey Lagrange multiplier test and the Jarque–Bera test to test for autocorrelation and normality in the data, respectively. Additionally, White’s Heteroscedasticity test was conducted to test for heteroscedasticity, and finally, the CUSUM test was conducted to establish the stability of the VECM estimates. The stability test helped to establish the ability of the system to revert to equilibrium after a shock.
4. Results and discussions
4.1. Trend analysis of acreage, output/production, and yield/ha of sugarcane from 1991 to 2020
Figure shows the growth trend in the area of sugarcane harvested annually from 1991 to 2020. Sugarcane acreage increased from 3,977 ha in 1996 and peaked at 26,532 ha in 2012 before declining to 14,216 in 2016 and experiencing slight increments thereafter. The annual increase in the acreage has been largely attributed to an increase in the number of out-growers of sugarcane yearly. In terms of growth rate, sugarcane acreage over the study period is estimated to increase at an average of 4.8% annually. This implies that about 5% of the existing area of sugarcane is added annually.
Figure 1. Trend of acreage by sugarcane out-growers from 1991 to 2020.
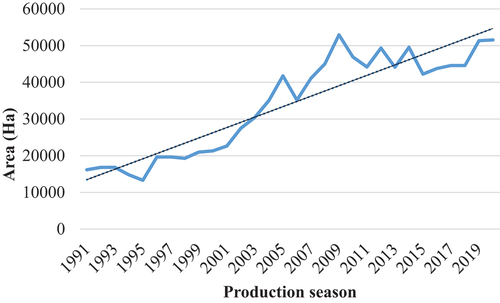
Figure illustrates the annual total production of sugarcane by out-growers from 1991 to 2020. From a total output of sugarcane of 347,035 tons in 1996, total sugarcane output experienced annual fluctuations until 2002 when total output sharply rose and peaked at 956,205 tons in 2005. Total output declined sharply in 2006 to about 610,771 tons and thereafter there have been fluctuations in annual total output of sugarcane. Increases in annual sugarcane output are largely a result of area expansion, for example, the highest output of sugarcane ever recorded was in 2005 and this corresponded with the highest area recorded before the peak in 2012. The growth rate of the annual total output of sugarcane was estimated to be 4.2% over the study period.
Figure 2. Trend of sugarcane total output/production by out-growers from 1991 to 2020.
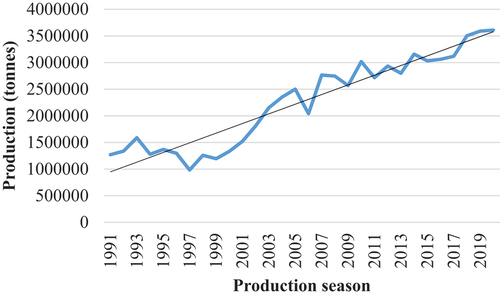
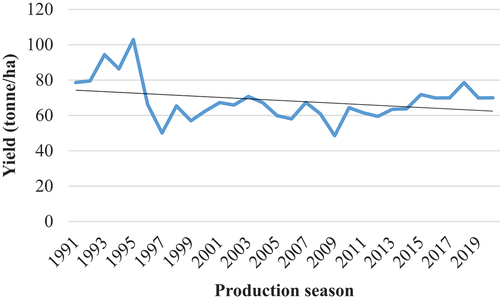
Figure is a representation of the growth trend in the annual yield/ha of sugarcane from 1991 to 2020. The annual yield of sugarcane over the study period has experienced regular fluctuations. Annual yield declined from an initial high of 87.3 tons per ha in 1996 to a low of 24.6 in 1997. Beyond 1996, sugarcane yield has always been below 50 tons per ha. In general, the annual yield has been decreasing on average over the study period. It was estimated that annual yield has been declining by about 0.7% annually over the period. Chief among the factors for the declining yield of sugarcane is the excessive use of the same farm plots yearly without allowing for the land to fallow (Isager et al., Citation2022). Additionally, climatic factors contribute significantly to the decline in yield because sugarcane out-growers in Tanzania largely depend on rainfall and as such, the current event of climate change greatly reduces sugarcane yield (Adhikari et al., Citation2015). Moreover, the lack of funds to put in place infrastructure such as irrigation and to purchase improved varieties of sugarcane and fertilizer also account for the decline in yield per hectare of sugarcane over the study period (Siyao, Citation2012; Smalley et al., Citation2014).
Figure 3. Trend of sugarcane yield/ha by out-growers from 1991 to 2020.
4.2. Estimating sugarcane acreage supply response function
As noted in the methodology section, the first step to estimating the VECM was to test for the unit root in the variables of interest. The series was subjected to the ADF unit root test, and the relevant statistics are shown in Table . The test results at the level revealed that the presence of unit root in the variable indicated that our data series was not stationary. We proceeded to take the first difference of our series and undertook the ADF test on the differenced data; the new result established that data for all variables were stationary at first difference (Table ).
Table 3. ADF unit root test
Results from three optimal lag selection criteria, namely, AIC, SC, and HQ, are displayed in Table . The results indicate that an optimal lag selection of one was appropriate for the study, as such, the estimation of the acreage supply response model used one as its optimal number of lags.
Table 4. AIC, SC, and HQ test for optimal lag selection
The result for the Johansen cointegration test indicating the existence of a long-run relationship between the variables of interest is illustrated in Table . The result revealed the presence of at most one cointegration equation, which implies that there is indeed a long-run relationship among these variables of interest.
Table 5. Johansen cointegration test
The VECM was estimated after we established stationarity in the data, selected an optimal lag, and established the existence of a long-run relationship between our variables of interest. Results obtained from estimating the VECM are presented in Table . The estimated model recorded an R-squared of 0.887 indicating that 88.7% of variations in acreage supply can be explained by the explanatory variables in the model. Additionally, the significant F-statistic indicates a good model fit of the data at a 1% significance level.
Table 6. VECM estimated supply response for sugarcane out-growers
4.2.1. Short-run estimates
Contrary to its hypothesised sign, the short-run estimates of the model indicate that the area of sugarcane harvested in the previous year negatively affects the current supply of sugarcane. It is estimated that a percentage increase in the previous year’s harvested area leads to a 0.383% decrease in the current acreage allocated to sugarcane. This negative relationship is because sugarcane out-growers in Tanzania sometimes collude to cause shortages in a bid to drive up prices (Andreoni et al., Citation2020). Although previous land allocation is hypothesised to positively influence future acreage allocation due to expected increases in profits (Saddiq et al., Citation2014), that is not the case for sugarcane out-growers in Tanzania. On the contrary, sugarcane out-growers in Tanzania make conscious efforts to reduce sugarcane acreage in anticipation of reduced prices given that sugarcane prices are mainly determined by the sugar estates in the country. This result is contrary to the findings of Shoko et al. (Citation2016) who found that the acreage of the previous year positively influenced the current acreage allocation of maize in South Africa.
As expected, it is estimated that a percentage increase in the amount of rainfall will lead to a 3.85% increase in sugarcane acreage. The result indicates that there is a positive relationship between rainfall and the area out-growers allocate to sugarcane production. This result suggests that favourable weather conditions in the previous year encourage farmers to expand their area under cultivation in anticipation of continued favourable weather conditions. This result compares favourably with that of Conteh et al. (Citation2014) who indicated that past weather conditions significantly inform farmers’ current and future production decisions. However, Prasada et al. (Citation2021) noted that rainfall has a quadratic relationship with agricultural production. This is because excessive rainfall amount will cause agricultural production to be low and this will affect farmers’ future production decisions. As anticipated, the coefficient of the quadratic rainfall variable is negative and significant at 10%. It is estimated that excessive rainfall amounts in the previous year will lead to a 4.096% decrease in the area allocated for sugarcane production by out-growers. This is because farmers who have experienced unfavourable weather conditions the previous year will be hesitant to cultivate similar or greater portions of land due to the fear of future unfavourable weather patterns.
Again, the study revealed that a 1% increase in the previous year’s price of sugarcane leads to a 0.87% increase in the current acreage of sugarcane. This relationship is well established in the literature, and the inelastic own price elasticity of supply obtained is similar to that of Mutua (Citation2015) and Shoko et al. (Citation2016) who reported a short-run own elasticity value of 0.64 and 0.238 for sugarcane out-growers and maize farmer in Kenya and South Africa, respectively. The price of rice in the previous year, which served as the price of a competing crop, was also found to have a negative influence on the current acreage allocated for sugarcane production as expected. It is estimated that a 1% increase in the price of rice for the previous year will lead to a 0.383% decrease in the current allocated area of sugarcane. This result is consistent with that of Atta-Aidoo (Citation2019) and Wani et al. (Citation2015) who indicated that farmers are likely to shift the same resources to more lucrative crops given that such resources are constrained especially in the short-run. In this regard, sugarcane out-growers are likely to shift their resources to the production of rice since that becomes more lucrative in the short-run. Additionally, contrary to our expectations, the price of maize (another competing crop) was found to have a positive effect on the area allocated for sugarcane production by out-growers in Tanzania. Contrary to our expectation that improved maize prices will cause a decline in the area allocated for sugarcane prices, it was found that improved maize prices rather lead to an expansion of the area under sugarcane. This is probably because the land used for sugarcane production may not be suitable for maize cultivation. Alternatively, maize is an important staple in Tanzania and, as such, an increase in maize prices has food security implication (Rajendran et al., Citation2014) therefore causing out-growers to expand their sugarcane production capabilities to be able to afford adequate maize stocks for their households. This result is, however, contrary to the findings of Haile et al. (Citation2016) who indicate that the price of wheat negatively impacts the acreage allocated to soybeans which is a competing crop.
4.2.2. Long-run estimates
An important indication of the accuracy and ability of our model to establish long-run equilibrium is the coefficient of adjustment. Theoretical and practical requirements require this coefficient to be negative and significant (Mustafa et al., Citation2016). The coefficient of adjustment of this model is −0.569, and this was significant at 0.05 alpha level. The significance implies that the explanatory variables included in the study cause the sugarcane out-growers’ acreage supply response. By implication, the coefficient of adjustment means that about 56.9% of the departure from long-run equilibrium is corrected in each period. This means that 56.9% of deviations from long-run equilibrium in the previous year are corrected in the current year at an adjustment speed of 56.9%. The coefficient of adjustment is relatively high indicating that farmers’ adjustment of actual acreage to desired acreage is relatively fast. This may be an indication that sugarcane out-growers in Tanzania face limited institutional constraints (Mohammad, Citation2009) that might otherwise delay them from achieving the desired acreage of sugarcane in Tanzania.
In the long-run, however, the acreage of sugarcane in the previous year has a positive influence on the current acreage under sugarcane cultivation. Consistent with the a priori expectation, it is estimated that a percentage increase in the acreage of sugarcane in the previous year will lead to a 0.249% increase in current acreage under sugarcane cultivation. This result supports the assertion that acreage allocation decisions are made on the premise of experiences in the previous farming season (Agbola & Evans, Citation2012). The result is similar to that of Shoko et al. (Citation2016) who reported that the previous year’s area under cultivation led to a 0.530% increase in the current area under maize cultivation in South Africa. It also corroborates the findings of Ambetsa et al. (Citation2020) who reported that increases in the previous year’s area under cultivation lead to increases in the current area of rapeseed, soybeans, and sunflower by 0.850%, 0.742%, and 0.741%, respectively, among countries within the European Union. Additionally, the sugarcane output of the previous year, which is a proxy for other non-acreage and exogenous inputs, positively influences the current area allocated for sugarcane production. Consistent with the a priori expectation, a 1% increase in the previous year’s non-acreage inputs will lead to a 2.542% increase in the current area allocated to sugarcane. In a similar study, Shoko et al. (Citation2016) report that increases in other non-acreage inputs such as fertilizer lead to about a 0.53% increase in area under cultivation.
The price of sugarcane in the previous year positively affected the area allocated for sugarcane by out-growers in the current year. It was estimated that a 1% increase in the price of sugarcane in the previous year leads to a 2.887% increase in the area allocated for sugarcane by out-growers. The higher acreage elasticity observed in the long-run is because sugarcane is a perennial crop and as such, the area allocated to sugarcane production due to price increases may require long-term investments (Khan et al., Citation2002). This implies that sugarcane out-growers have more flexibility to adjust their land allocation decisions in response to price changes in the long-run than in the short-run and are therefore more elastic. Farmers are anticipated to make substantial changes in the long-run compared to very few possible changes in the short-run (Soontaranurak & Dawson, Citation2015). Our result is, however, different from those of Mutua (Citation2015) and Mythili (Citation2006) who reported that farmers were more inelastic to price changes in the long-run. On the other hand, the result is consistent with the findings of Haile et al. (Citation2016), Ambetsa et al. (Citation2020) and Shoko et al. (Citation2016) who reported that farmers’ responsiveness to own prices is more elastic in the long-run.
Furthermore, it is estimated that a 1% increase in the price of rice in the previous year will lead to a 1.875% reduction in the area allocated for sugarcane production in the long-run. This result is consistent with the a priori expectation. This magnitude of reduction in acreage in the long-run (1.875%) is significantly greater than the magnitude of reduction in the short-run (0.383%) because out-growers may have fully processed that market information and as such may be changing their production from sugarcane to rice especially since the two crops are cultivated in similar conditions. Contrary to a priori expectation, a percentage increase in the price of maize leads to a 2.068% increase in the sugarcane acreage. This is because although sugarcane and maize production compete for the same resources of the farmer, the importance attached to maize precludes it from reduction in production due to price changes in other commodities. For sugarcane out-growers whose main source of livelihood is cultivating sugarcane, favourable prices received from their maize farms only serve as additional investment in their sugarcane production in the hope of reaping further gains.
Consistent with the expected sign, a percentage increase in mean annual rainfall of the previous year was estimated to lead to a 5.241% increase in sugarcane acreage allocated in the current year in the long-run, this result is similar to that of Weersink et al. (Citation2010) in Canada. Sugarcane cultivation in Tanzania is mainly rainfed and as such, favourable rainfall patterns will send a good signal to out-growers to expand their cultivated area (Isager et al., Citation2022). On the contrary, excessive rainfall will lead to a 0.103% reduction in the area under sugarcane cultivation. The magnitude of reduction in the long-run (0.103%) is smaller than the magnitude of reduction (4.096%) in the short-run. It can be deduced that, in the long-run, out-growers will become conversant with extreme weather events such as excessive rainfall, and this might encourage them to adopt adaptation and mitigation measures to reduce the risk of losing their sugarcane farms to excessive rainfall. A time trend variable which captures technological progress over time was estimated to have a positive impact on the area allocated to sugarcane production. Development of advanced technology, particularly in agriculture, will tend to increase productivity and as such entice sugarcane out-growers to increase their area to accrue maximum benefit from such technologies. Similar to the results by Yu et al. (Citation2018) we estimated that a 1% increase in technology will lead to a 0.030% increase in the area allocated for sugarcane production in the long-run.
4.2.3. Model diagnostics
Model adequacy was assured after the performance of post-estimation diagnostics. The LM test for serial correlation provided an LM statistic of 50.066 with a p-value of 0.88, and we, therefore, failed to reject the null hypothesis of no serial correlation, an indication that autocorrelation was absent in our model estimates. The Breusch–Pagan–Godfrey (BG) heteroskedasticity test recorded a p-value of 0.309, and hence we fail to reject the null hypothesis of no heteroskedasticity. Further, the insignificant Jarque–Bera test statistic indicates that the model meets the assumption of normally distributed residuals. A cumulative sum (CUSUM) test for stability revealed the absence of any instability of the coefficients because the CUSUM statistic lays within the critical band of 5% confidence interval of parameter stability.
5. Conclusion and policy recommendations
The study has established that sugarcane supply in Tanzania is largely dependent on price and non-price factors. Out-growers of sugarcane in Tanzania make their decision on expanding the area under sugarcane cultivation based on the price of sugarcane and other related crops such as maize and rice in the past seasons. The results underscore the relevance of sugarcane prices and weather on the supply of sugarcane in Tanzania. Additionally, the results highlight the high competition among domestic sugarcane and rice production and the complementary effect of maize production on sugarcane production. The major limitation of this study was in terms of getting complete data for a longer period of time. There were issues of occasional missing data which the authors addressed sufficiently.
Based on the results of the study, we recommend long-term investments in irrigation facilities to move Tanzania’s sugarcane production from a rain-fed system given that rainfall (availability of water) is a significant contributor to sugarcane production. Additionally, sugar estates must be urged to pay the market price of sugarcane to the out-growers in order to forestall the resurgence of collusion on the part of sugarcane out-growers to cause scarcity of sugarcane. Moreover, the positive effect of maize prices on the supply of sugarcane is an indication that livelihood diversification can enhance sugarcane production. Lastly, measures should be put in place to ensure that sugarcane out-growers are able to reduce the risk of having their farms destroyed by extreme weather events, especially in this era of climate change.
Disclosure statement
No potential conflict of interest was reported by the author(s).
Data availability statement
The data that support the findings of this study are available from the corresponding author [JAA] upon reasonable request.
Additional information
Funding
Notes on contributors
Ismail Ally Mbua
Ismail Ally Mbua is an early career researcher with a wide range of interests. He holds an MSc in Agricultural and Applied Economics from Sokoine University of Agriculture, Tanzania, with specialization in Environmental and Natural Resource Management from the University of Pretoria, South Africa.
Jonathan Atta-Aidoo
Jonathan Atta-Aidoo is an Applied Economist at the Department of Environmental Science, Kwame Nkrumah University of Science and Technology, Kumasi, Ghana, and a Research Fellow at the Institute for Liberty and Policy Innovation, Tema, Ghana. His research interests include agricultural policy analysis, sustainable agricultural production, climate change risks and adaptation, food security and financial development.
References
- Abdel Hameed, A. A., Hasanov, A., Idris, N., Abdullah, A. M., Mohamed Arshad, F., & Shamsudin, M. N. (2009). Supply and demand model for the Malaysian cocoa market. Workshop on Agricultural Sector Modeling in Malaysia: Quantitative Models for Policy Analysis, organized by Institute of Agricultural and Food Policy Studies (IKDPM), Universiti Putra Malaysia.
- Adhikari, U., Nejadhashemi, A. P., & Woznicki, S. A. (2015). Climate change and eastern Africa: A review of impact on major crops. Food and Energy Security, 4(2), 110–16. https://doi.org/10.1002/fes3.61
- Agbogo, E. A., & Okorie, A. (2014). Effect of price changes on the supply response of rubber in Nigeria (1980-2010). Journal of Agriculture and Veterinary Science, 7(6), 39–42. https://doi.org/10.9790/2380-07613942
- Agbola, F. W., & Evans, N. (2012). Modelling rice and cotton acreage response in the Murray Darling Basin in Australia. Agricultural Systems, 107, 74–82. https://doi.org/10.1016/j.agsy.2011.10.004
- Alemu, Z. G., Oosthuizen, K., & Schalkwyk, H. V. (2003). Grain-supply response in Ethiopia: An error-correction approach. Agrekon, 42(4), 389–404. https://doi.org/10.1080/03031853.2003.9523631
- Ambetsa, F. L., Mwangi, S. C., & Ndirangu, S. N. (2020). Technical efficiency and its determinants in sugarcane production among smallholder sugarcane farmers in Malava sub-county, Kenya. African Journal of Agricultural Research, 15(3), 351–360. https://doi.org/10.5897/AJAR2020.14703
- Andreoni, A., Mushi, D., & Therkildsen, O. (2020). The political economy of ‘scarcity’in East Africa: A case study of sugar production, smuggling and trade in Tanzania. Working Paper 031. Anti-corruption evidence (ACE) research consortium. SOAS University of London.
- Arumugam, G., Sadiq, A. M., Nagalingam, M., & Panneerselvam, A. (2014). Production of invertase enzymes from Saccharomyces cerevisiae strain isolated from sugarcane and grape juices. European Journal of Experimental Biology, 4(5), 29–32.
- Atta-Aidoo, J., (2019). Aggregate cocoa supply response to government expenditure in Ghana. Dissertation for Award of MSc. Degree in Agricultural and Applied Economics. Sokoine University of Agriculture.
- Bakari, H. (2018). Challenges facing sugarcane supply to Mtibwa Factory: empirical evidence from Mtibwa Sugarcane Out-growers Scheme, Morogoro, Tanzania. [Dissertation for Award of MSc. Degree in Agricultural Economics]. Sokoine University of Agriculture.
- Bélair, J. (2021). Farmland investments in Tanzania: The impact of protected domestic markets and patronage relations. World Development, 139, 105298. https://doi.org/10.1016/j.worlddev.2020.105298
- Bombo, F. B. (2013). Transaction costs in production and marketing of sugarcane under out-grower’s schemes in Morogoro region of Tanzania. [Dissertation for Award Degree of MSc. Degree in Agricultural Economics. Sokoine University of Agriculture].
- Bor, O., & Bayaner, A. (2009). How responsive is the crop yield to producer prices? A panel data approach for the case of Turkey. New Medit, 8(4), 28–33.
- Chisanga, B., Gathiaka, J., Nguruse, G., Onyancha, S., & Vilakazi, T. (2016). Agricultural development, competition and investment: The case of sugar in Kenya, South Africa, Tanzania and Zambia. Competition in Africa: Insights from Key Industries, 41–65.
- Conteh, A. M., Yan, X., Fofana, I., Gegbe, B., & Isaac, T. I. (2014). An estimation of rice output supply response in Sierra Leone: A Nerlovian model approach. International Journal of Agricultural and Biosystems Engineering, 8(3), 225–233.
- Devadoss, S., & Luckstead, J. (2010). An analysis of apple supply response. International Journal of Production Economics, 124(1), 265–271. https://doi.org/10.1016/j.ijpe.2009.11.024
- Eriksen, S. S. (2018). Tanzania: A political economy analysis. Norwegian Institute of International Affairs.
- Fabian, D. (2013). Aggregate acreage response of cashew nut and sesame to commodity price and non-price factors in southeastern Tanzania. [Ph.D. dissertation], Sokoine University of Agriculture.
- FAO [Food and Agriculture Organization of the United Nations]. (2023). Base de dados Faostat Agriculture. https://www.fao.org/faostat/en/rankings/countries_by_commoditysitevisitedon22March2023.
- French, B. C., & Matthews, J. L. (1971). A supply response model for perennial crops. American Journal of Agricultural Economics, 53(3), 478–490. https://doi.org/10.2307/1238225
- Granger, C. W., & Newbold, P. (1974). Spurious regressions in econometrics. Journal of Econometrics, 2(2), 111–120. https://doi.org/10.1016/0304-40767490034-7
- Haile, M. G., Kalkuhl, M., & von Braun, J. (2016). Worldwide acreage and yield response to international price change and volatility: A dynamic panel data analysis for wheat, rice, corn, and soybeans. American Journal of Agricultural Economics, 98(1), 172–190. https://doi.org/10.1093/ajae/aav013
- Handerson, J. M., & Quandt, R. E. (1971). Microeconomic theory a mathematical approach. McGraw Hill.
- Hess, T. M., et al., Sumberg, J., Biggs, T., Georgescu, M., Haro-Monteagudo, D., Jewitt, G., Ozdogan, M., Marshall, M., Thenkabail, P., Daccache, A., Marin, F. and Knox, J. W., (2016). A sweet deal? Sugarcane, water and agricultural transformation in Sub-Saharan Africa. Global Environmental Change, 39, 181–194. https://doi.org/10.1016/j.gloenvcha.2016.05.003
- International Trade Centre. (2021) . Products and markets with export growth potential in COMESA: SheTrades in the African Continental. Free Trade Area.
- Isager, L., Fold, N., & Mwakibete, A. (2022). Land and contract farming: Changes in the distribution and meanings of land in Kilombero, Tanzania. Journal of Agrarian Change, 22(1), 36–57. https://doi.org/10.1111/joac.12456
- Johansen, S. (1987). Statistical analysis of cointegration vectors. North-Holland, University of Copenhagen, Denmark. Journal of Economic Dynamics and Control, 12(2–3), 231–254. https://doi.org/10.1016/0165-1889(88)90041-3
- Khan, M. I., Mandal, M. A. S., & Huda, F. A. (2002). Production and Yield of HYV boro and aman rice: Growth and trend analysis. Pakistan Journal of Biological Sciences, 5(4), 502–505. https://doi.org/10.3923/pjbs.2002.502.505
- Kumar, P., & Sharma, A. (2006). Perennial crop supply response functions: The case of Indian rubber, tea and coffee. Indian Journal of Agricultural Economics, 61(4), 1–17.
- Kumawat, L., & Prasad, K. (2012). Supply response of sugarcane in India: Results from all-India and state-level data. Indian Journal of Agricultural Economics, 67(4), 585–599.
- Masare, A. (2018). Tanzania proposes increase in sugar import duty. [https://www. thecitizen.co.tz/news/Tanzania-proposes-increase-in-sugar-import-duty/1840340-4614296-mwx0uq/index.html] site visited on 23/08/2020
- Massawe, B. H. J., & Kahamba, J. S. (2018). Sugar board of Tanzania phasing out plan for the accompanying measures sugar protocol. Bureau of Agricultural Consultancy and Advisory Service, Sokoine University of Agriculture.68pp.
- Mohammad, N. (2009). Production and acreage response of wheat and cotton in NWFP, Pakistan. Pakistan Journal of Agricultural Research, 22(3/4), 101–111.
- Msuya, E., & Ashimogo, G. (2005). Estimation of Technical efficiency in Tanzanian sugarcane production: A case study of mtibwa sugar estate outgrowers scheme. MPRA Paper Series WP, (3747). http://mpra-muenchem.de/3737
- Muchetu, R. G., & Mazwi, F. (2015). Out-grower sugarcane production post fast track land reform programme in Zimbabwe. Ubuntu: Journal of Conflict Transformation, 4(2), 17–48.
- Much, S., Tongpan, S., & Sirisupluxana, P. (2011). An analysis of supply response for natural rubber in Cambodia. Applied Economics Journal, 18(1), 31–43.
- Mustafa, G., Latif, I. A., & Egwuma, H. (2016). An empirical analysis of supply response of rubber in Malaysia. American Journal of Agricultural and Biological Sciences, 11(4), 148–156. https://doi.org/10.3844/ajabssp.2016.148.156
- Mutua, M. M. (2015). An Estimation of Sugarcane Supply Response among Outgrowers in Mumias Sugar Company in Kenya (Doctoral dissertation), University of Nairobi.
- Mythili, G. (2006). Measures of risk aversion and risk premiums from land allocation model: An empirical analysis based on farm level panel data. The IUP Journal of Agricultural Economics, 3(4), 34–43.
- Nerlove, M. (1958). The dynamics of supply: Estimation of farmers’ response to price ( 2). Johns Hopkins Press.
- Obayelu, A. E., & Salau, A. S. (2010). Agricultural response to prices and exchange rate in Nigeria: Application of co-integration and vector error correction model (VECM). Journal of Agricultural Sciences, 1(2), 73–81. https://doi.org/10.1080/09766898.2010.11884656
- Ogbu, O. M., & Gbetibouo, M. (1990). Agricultural supply response in Sub-Saharan Africa: A critical review of the literature. African Development Review, 2(2), 83–99. https://doi.org/10.1111/j.1467-8268.1990.tb00025.x
- Peralta, M. A., & Swinton, S. M. (2015). Food vs. wood: Dynamic choices for Kenyan smallholders. Agricultural and Applied Economics Association’s and ACCI Joint Annual Meeting, Milwaukee. 28pp.
- Prasada, I. Y., Dhamira, A., & Nugroho, A. D. (2021). Effects of climatic factors on the productivity of smallholder rubber plantations in South Sumatra, Indonesia. Regional Science Inquiry, 13(2), 109–121.
- Rajendran, S., Afari-Sefa, V., Lukumay, M., Dominick, I., & Bekunda, P. J. (2014). Does crop diversity contribute to dietary diversity? Evidence from integration of vegetables into maize-based farming systems in Tanzania. Agriculture & Food Security, 6(1). https://doi.org/10.1186/s40066-017-0127-3
- Rumánková, L., & Smutka, L. (2013). Global sugar market–the analysis of factors influencing supply and demand. Acta Universitatis Agriculturae et Silviculturae Mendelianae Brunensis, 61(2), 463–471. https://doi.org/10.11118/actaun201361020463
- Saddiq, M., Fayaz, M., Hussain, Z., Shahab, M., & Ullah, I. (2014). Acreage response of sugarcane to price and non-price factors in Khyber Pakhtunkhwa. International Journal of Food and Agricultural Economics, 2(3), 121–132.
- Sambuo, D. (2015). Causality analysis of sugar productions and consumption in Tanzania. Journal for Studies in Management and Planning, 1, 511–522.
- SBT [Sugar Board of Tanzania]. (2021). Handbook of Potential Areas for Sugarcane and Sugar Production in Tanzania Mainland. Dar es Salaam.
- Shoko, R. R., Belete, A., & Chaminuka, P. (2016). Estimating the supply response of maize in South Africa: A Nerlovian partial adjustment model approach. Agrekon, 55(3), 237–253. https://doi.org/10.1080/03031853.2016.1203802
- Siyao, P. O. (2012). Barriers in Accessing agricultural information in Tanzania with a gender perspective: The case study of small‐scale sugar cane growers in Kilombero District. Electronic Journal of Information Systems in Developing Countries, 51(1), 1–19. https://doi.org/10.1002/j.1681-4835.2012.tb00363.x
- Smalley, R., Sulle, E., & Malale, L. (2014). The role of the state and foreign capital in agricultural commercialisation: The case of sugarcane outgrowers in Kilombero District, Tanzania. Working Paper 106. Future Agricultures Consortium and the Institute for Poverty, Land and Agrarian Studies (PLAAS), University of the Western Cape,
- Soontaranurak, K., & Dawson, P. J. (2015). Rubber acreage supply response in Thailand: A cointegration approach. The Journal of Developing Areas, 49(2), 23–38. https://doi.org/10.1353/jda.2015.0009
- Suchato, R., Patoomnakul, A., & Photchanaprasert, N. (2021). Alternative cropping adoption in Thailand: A case study of rice and sugarcane production. Heliyon, 7(12), e08629. https://doi.org/10.1016/j.heliyon.2021.e08629
- Suleiman, A. (2001). Supply response of Ethiopian farmers to price and non-price factors. Proceedings of the Western Michigan University Scholar Works at WMU International Conference on African Development Archives (pp. 21).
- Sulle, E., Smalley, R., & Malale, L. (2014). Opportunities and challenges in Tanzania’s sugar industry: Lessons for SAGCOT and the New Alliance. 12.
- Thiele, R. (2000). Estimating the aggregate agricultural supply response: A Survey of techniques and results for developing countries. Kiel Working Paper No. 1016. Kiel Institute for World Economics, 26pp.
- Waghmare, N. K., & Khan, S. (2021). Extraction and characterization of nano-cellulose fibrils from Indian sugarcane bagasse-an agro waste. Journal of Natural Fibers, 19(13), 6230–6238. https://doi.org/10.1080/15440478.2021.1907831
- Wani, M. H., Sehar, H., Paul, R. K., Kuruvila, A., & Hussain, I. (2015). Supply response of horticultural crops: The Case of apple and pear in Jammu & Kashmir. Agricultural Economics Research Review, 28(1), 83–89. https://doi.org/10.5958/0974-0279.2015.00006.3
- Weersink, A., Cabas, J. H., & Olale, E. (2010). Acreage response to weather, yield, and price. Canadian Journal of Agricultural Economics/Revue Canadienne D’agroeconomie, 58(1), 57–72. https://doi.org/10.1111/j.1744-7976.2009.01173.x
- Yu, J., Smith, A., & Sumner, D. A. (2018). Effects of crop insurance premium subsidies on crop acreage. American Journal of Agricultural Economics, 100(1), 91–114. https://doi.org/10.1093/ajae/aax058