
 ?Mathematical formulae have been encoded as MathML and are displayed in this HTML version using MathJax in order to improve their display. Uncheck the box to turn MathJax off. This feature requires Javascript. Click on a formula to zoom.
Abstract
Risks associated with rainfall variability are one of the most visible concerns of rainfed agricultural production in underdeveloped nations. Exploring the variability of rainfall and the risks connected with it is important for developing offsetting strategies. The purpose of this study was to investigate the variability of rainfall and its seasonal characteristics, as well as the associated risks in Southwest Ethiopia. Daily rainfall and temperature data of 12 weather stations were collected from the National Meteorological Agency of Ethiopia for the period 1983 to 2016. ArcGIS was used to examine the regional distribution of rainfall variability at temporal scale. INSTAT+v3.37 software was used to assess the monthly and seasonal rainfall distribution, start and end of season, length of growing season, and dry spells. The coefficient of variation for annual, spring, summer, and autumn rainfall ranged from 17.79 to 29.93, 21.23 to 41.56, 36.38 to 122.00, and 32.37 to 68.08%, respectively. The start and end date of rain during the spring season varied from 65 to 129 and 122 to 176 day of the year, respectively. Rainfall variability was linked to risks such as late onset, early cessation, short and prolonged dry periods, and drought with a high frequency and moderate-to-severe intensity.
1. Introduction
The livelihood of people in developing nations relies on small-scale, subsistence agriculture that is sensitive to a variety of stressors (Bjornlund et al., Citation2020; Shimeles et al., Citation2018). Vulnerability of this sector to the impact of climate change and variability is one of the prominent challenges in developing countries, particularly in Africa (Asfaw et al., Citation2018; Gebrechorkos et al., Citation2019). Like other parts of Africa, the main economic stay of Ethiopia is agriculture that contributes 34% of gross domestic product and 80% of labor employment (Alemu & Berhanu, Citation2018; Wendimu & Tejada Moral, Citation2021). However, this sector is challenged by low input supply and technology adoption, poor infrastructure and market supply chain, and high variability of rainfall (Ademe et al., Citation2020; Moges & Bhat, Citation2021). The rainfed farming system increases the sector’s vulnerable to the impacts of climate change and variability.
The rainfall of Ethiopia is highly variable in amount and distribution at spatial and temporal scales (Reda, Citation2015). This rainfall variability is influenced by the atmospheric circulation, the seasonal migration of the inter-tropical convergence zone (ITCZ), and the intricacy of topography (Adane et al., Citation2020). Different evidences showed that the seasonal migration of ITCZ over 30 degree north and south of equator, flow of winds from southern Indian ocean and equatorial parts of the Atlantic Ocean, flow of the upper-level tropical easterly jet, and Sahara and low-level Somali jet are some of climatological attributes that influence rainfall of Ethiopia (Diro et al., Citation2008). For Southern Ethiopia, the Northward and Southward movements of ITCZ give raise to spring (March to May) and autumn (October to December) seasons, respectively, while the trough brings one main rainy season (summer) between June and September for northern Ethiopia through its northward movement (Diro et al., Citation2008). In addition, the El Niño- Southern Oscillation (ENSO) through its warm (El Nino) and cold (La Niña) phases causes variability of seasonal rainfall leading to drought and flood at extreme case (Gleixner et al., Citation2017; Mera, Citation2018). Similarly, oceanic influence due to fluctuation of sea surface temperature of Atlantic and Indian Oceans and teleconnections from the tropical pacific are other sources of rainfall variability particularly during summer season (Reda, Citation2015).
Rainfed crop production is adversely affected by rainfall variability with its associated risks such as delay in onset, early cessation, and dry spells over the growing season (Bahiru et al., Citation2020; Mugalavai et al., Citation2008). Early onset of the rainy season gives the chance of early planting and crop germination. However, there is risk of total seedling failure (false start) if it is followed by long dry spells (Kipkorir et al., Citation2007). Similarly, delay onset and early cessation of a rainy season shorten the crop growing period resulting in low crop yield and affecting the food security of subsistence farmers (Mugalavai et al., Citation2008). Furthermore, dry spells appearing during crop growing periods especially at sensitive growth stage affect growth and productivity of crops (Muluneh et al., Citation2017).
Most parts of southwest Ethiopia are characterized as hot arid and semi-arid environment with recurrent droughts. Few evidences dealing with climate change and rainfall variability have been generated for this region (Araro et al., Citation2019; Enyew & Hutjis, Citation2015; Gebremichael et al., Citation2014; Gemeda , Citation2019; Habte et al., Citation2021b). However, most of them focused on trend analysis for temperature and rainfall changes over the previous three to four decades. Although some of these studies examined rainfall variability, they covered only few parts of the region. In addition, they did not examine the risks associated with the rainfall variability. In this study, variability of rainfall in South Omo and Segen Area People zones was explored in relation to its seasonal events with associated risks such as delay onset and early cessation. Such information is helpful for planning crop production activities based on the timing of seasonal events like onset, cessation, and length of growing period. Additionally, examining the risks associated with rainfall variability is crucial for developing and implementing effective interventions and enhancing farmers’ adaptive capability (Gbangou et al., Citation2019; Habte et al., Citation2021b). Hence, this study was initiated to explore the annual and seasonal rainfall variabilities and to examine their seasonal events with associated risks to rainfed crop production in Southwest Ethiopia.
2. Materials and methods
2.1. Description of study area
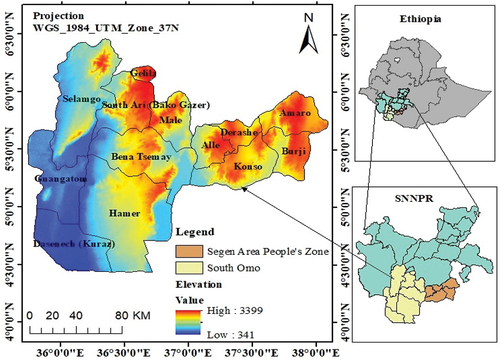
Ethiopia is geographically located in the eastern Africa. The study was conducted in two administrative zones (South Omo and Segen Area People’s zones) of Southwest Ethiopia (Figure ). South Omo Zone has an altitude ranging from 376 to 3500 m.a.s.l. and located between 35°97′ − 36°6′ E and 4°43′- 6°46′ N. Similarly, Segen Area People’s zone has an altitude ranging from 501–3000 m.a.s.l. and located between 37°1′ − 38°01′ E and 5°17′ − 5°59′ N. The region has mean annual rainfall of 435–1211 mm while annual maximum and minimum temperature varied from 27.8–33.7 to 14.4–23.7°C, respectively (Habte et al., Citation2021b). Agro-ecologically, most parts of the region are categorized into hot arid and semi-arid while tropical sub-humid climate covering small areas with major crop growing period range from March to May (Gebremichael et al., Citation2014). Dominant crops produced in the region during the major crop growing period are maize, teff, common bean, and sorghum (CSA, Citation2020). The dominant soil type of the region is cambisol with textural class of sandy loam and clay loam (Habte et al., Citation2021a; Kebede et al., Citation2017). The details of soil physical and chemical characters are given by Kebede et al. (Citation2017) and Habte et al.,(Citation2021a).
Figure 1. Map of study area.
2.2. Observed climate data source and quality control
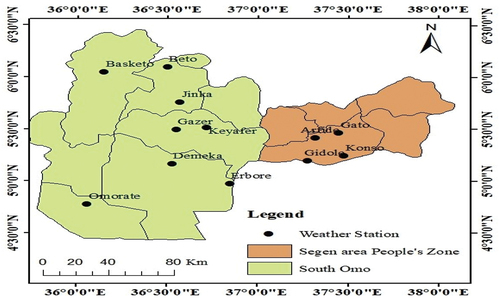
Twelve meteorological stations from southwest Ethiopia (South Omo and Segen Area People’s zones) such as Jinka, Gazer, Keyafer, Konso, Gidole, Gato, Arfide, Erbore, Demeka, Omorate, Beto, and Basketo (Figure ) were selected for analysis of rainfall and its seasonal events. According to the NMA, most of these stations are class D, recording only rainfall with a high number of missing values. This data problem was resolved by NMA using a synthesis (gap filling) with ENACTS (Enhancing National Climate Services initiative) gridded (4 km by 4 km spatial resolution) data set (Esayas et al., Citation2019). This data set is a combination of ground-based observations managed by NMA and satellite estimates of rainfall and temperature from the European Organization for the Exploitation of Meteorological Satellites (EUMETSAT) and the US National Aeronautics and Space Administration (NASA) (Esayas et al., Citation2018, Citation2019). The reconstruction of data was performed by the NMA in collaboration with the International Research Institute for Climate and Society at Columbia University, USA, whereas data calibration and validation were carried out by Reading University, UK (Esayas et al., Citation2019). Hence, daily rainfall and maximum and minimum temperatures data were taken from the above source for the period 1983 to 2016. Data quality control (homogeneity test, detecting the presence of outliers and maximum temperature values lower than minimum temperature) was done using Rclimdex software (Zhang & Yang, Citation2004).
Figure 2. Spatial distribution of weather stations found in the study area.
2.3. Data analysis
2.3.1. Annual and seasonal rainfall pattern and variability
Monthly and seasonal rainfall patterns of the region were examined by processing the daily data using INSTAT+v3.37 software. Rainfall variability at annual and seasonal bases was analyzed by determining coefficient of variation (CV). It is computed as:
where μ is the mean precipitation and σ is standard deviation. Values of CV less than < 20%, between 20 and 30, and higher than 30% indicate lower, moderate, and higher variability, respectively (Hare, 2002).
The CV of selected weather stations was interpolated to see the temporal variability of annual and seasonal rainfall over the period 1983 to 2016. Inverse distance-weighted (IDW) techniques were employed for the interpolation using ArcGIS 10.4. To interpolate the point station rainfall, IDW technique was employed using ArcGIS 10.4.
Precipitation concentration index (PCI) was used to scrutinize the heterogeneity pattern of rainfall at the annual scale. It was proposed by Oliver (Citation1980) and further improved by De Luis et al. (Citation2011) as follows at annual scale:
where Pi represents the monthly precipitation in month i that is calculated for each studied station and for each year throughout the observation period. PCI values below 10 indicate a uniform monthly distribution of rainfall (low level of precipitation concentration) for the year. PCI values ranging from 11 to 15 denote relatively uniform precipitation distribution (a moderate precipitation concentration). PCI values between 16 and 20 and above 20 indicate that monthly precipitation distribution is irregular (more precipitation falls in only a few months) and strongly irregular (high precipitation concentration) precipitation distribution throughout the year, respectively.
2.3.2. Seasonal rainfall events
Seasonal rainfall events such as start of season (SOS), end of season (EOS), and length of growing period (LGP) were computed using INSTAT+v3.37 based on the criterion stated below. Stern et al. (Citation1982) define start of rainy season as the first occurrence of at least “X” mm rainfall totaled over “t” consecutive days. The author further asserted that a false start could happen if an event, “F”, occurs after the onset of rain, where F is defined as a dry spell of “n” or more days in the next “m” days. Different authors adopt this approach to determine the onset of rains using different threshold values (Gebremichael et al., Citation2014; Kassie et al., Citation2013; Megers et al., Citation2019). The criterion used in this study was a rainfall total of 20 mm or more accumulated over three consecutive rainy days from March 1 (starting date of spring season) with no consecutive dry spells longer than 10 days in the next 30 days. End of the rainy season is computed based on the depletion of soil water. Stern et al. (Citation2006) defined EOS as the first occasion, after a given day that the soil water content drops below a certain level. In the current study, EOS was adopted as any day after May 1 when the soil water is depleted and reaches zero. Consequently, LGP was computed as the difference between SOS and EOS.
2.3.3. Dry spells and drought
In addition to delay in onset of rainy season and its early cessation, events such as dry spells and drought affect rainfed crop production. In this study, occurrence of dry spells and frequency and severity of drought were explored as follows.
Dry spell length
For the study of dry spell length, a day was considered as dry when it accumulates rainfall of less than 1 mm (NMSA, Citation2001). The daily rainfall data of selected weather stations were fitted to a simple Markov chain model using INSTAT+v3.37. The chance of rain given the previous day is rainy and the chance of rain given the previous day is dry, i.e. the chance of rain spell and dry spell continuing, respectively, were assessed using this model (Stern et al. Citation2006; Stern & Cooper, Citation2011). The probabilities of the dry spell lengths of longer than 5, 7, 10, and 15 days during all seasons were calculated to get clear picture of dry spell risks particularly during the crop growing period and generally all over the years.
Standardized precipitation index (SPI)
The SPI is designed to determine precipitation deficit or drought at multiple time intervals using the following equation:
where Xij is the rainfall for ith month at jth time scale, μij is the long-term rainfall means, and σ is its standard deviation. McKee et al. (Citation1993, Citation1995) have classified the SPI series into seven categories of dry and wet conditions ranging from extreme dry to extreme wet (Table ). In this study, SPI values at weather station level in Southwest Ethiopia were calculated for two seasons (spring and autumn) to determine the occurrence of agricultural drought over the period 1983 to 2016 to see how the rainfed crop production has been constrained by moisture deficit/drought.
Table 1. Dry and wet condition categories based on standardized precipitation index
3. Results
3.1. Annual and seasonal rainfall pattern and variability
The region experienced bimodal rainfall pattern that occurred from March to May and September to November (Figure ). The main rainy season in all parts of the region occurred from March to May (spring season) and contributed about 35.9 to 53.3% to the regional annual mean rainfall. Similarly, the second rainy season occurred from September to November (autumn season) and contributed about 27.07 to 31.2% to the regional mean annual rainfall over the period 1983 to 2016 (Table ). Furthermore, the contributions of summer (June to August) and winter (December to February) regional rainfall were 16.1 and 11.3%, respectively. The regional mean monthly rainfall ranged from 22.33 (in February) to 139.3 mm (in April) for the period 1983 to 2016 (Figure ). The higher mean monthly rainfall of all stations occurred in April that ranged from 82.6 to 182.4 mm (Figure ). On the other hand, the minimum monthly rainfall of all stations occurred in February except for Basketo, Beto, and Arfide for which it was recorded in January and for Erbore in July. The maximum monthly rainfall during the autumn rainy season occurred in October (Figure ).
Figure 3. Mean monthly rainfall of weather stations in southwest Ethiopia for the period 1983 to 2016. The stations were grouped into four based on their geographical location to see the mean monthly rainfall distribution across different corners of the study area.
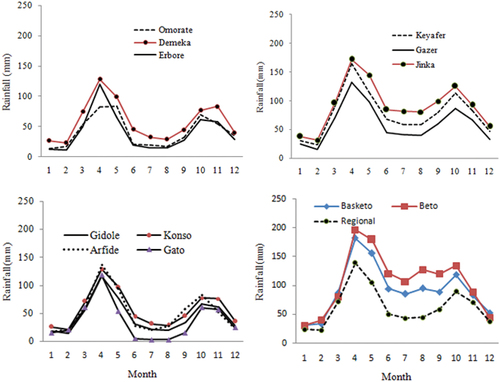
Table 2. Contribution of seasonal rainfall to the mean annual rainfall of weather stations in Southwest Ethiopia for the period 1983 to 2016
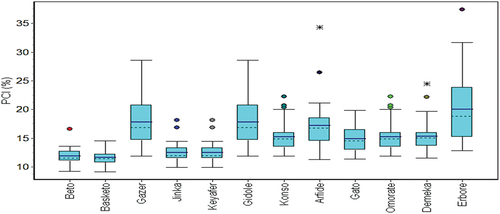
The PCI values of the weather stations across the region varied over the period 1983 to 2016. Weather stations found in northern part of the region experienced lowest PCI than the rest (Figure ). The PCI of the weather station varied from 9.15 to 37.41% (Figure ). The lowest values of PCI were observed for weather station such as Beto, Basketo, Jinka, and Keyafer, while Erbore, Gazer, Gidole, and Arfide had the highest PCI values.
Figure 4. PCI of annual rainfall of weather stations in Southwest Ethiopia for the period 1983 to 2016. Boxes indicate the lower and upper quartiles. The solid and dote lines within the box are the mean and median, respectively. Whiskers indicate the minimum and maximum values, and dots are outliers.
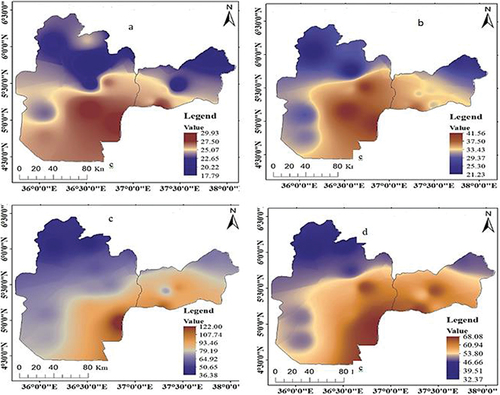
Variability of annual rainfall of the study area varied from low to moderate, 17.79 to 29.93%, for the period 1983 to 2016 (Figure ). The southern region showed higher variability of annual rainfall than the remaining parts over this period. The highest and lowest values of CV were recorded at Jinka and Erbore, respectively. Similarly, the seasonal rainfall had similar trends of CV across different parts of the region (Figure ). The CV for spring rainfall ranged from 21.23 to 41.56%. Furthermore, CV of summer and autmun rainfall varied from 36.38 to 122.00 and 32.37 to 68.08%, respectively.
Figure 5. CV for annual and seasonal rainfall in southwest Ethiopia over the period 1983 to 2016. a= CV of annual rainfall, b= CV of Belg (spring) rainfall, c= CV of Kiremt (summer) rainfall, and d= CV of autumn (Tseday) rainfall.
3.2. Seasonal rainfall events
The seasonal rainfall events such as SOS, EOS, and LGP were explored only for the main growing season (for the spring rainfall) that contributes to nearly half of the annual rainfall. There were spatial and temporal variations of SOS for the spring rainy season over the region, with March being the earliest month of SOS for majorities of the stations except Omorate, Demeka, and Erbore over the period 1983 to 2016 (Figure , Table ). The SOS of the region varied from 65 (March 5) to 129 (May 8) DOY (Table ). Early start of spring rainfall was observed at Jinka, Keyafer, Beto, Basketo, and Arfide, while weather stations like Omorate, Demeka, and Erbore experienced late start of the season over the period 1983 to 2016. The CV of SOS varied from11.5 to 20.5% with mean regional value of 15.9% over the period 1983 to 2016 (Table ).
Figure 6. Start of spring season at weather stations in Southwest Ethiopia. Boxes indicate the lower and upper quartiles. The solid and dotted lines within the box are the mean and median, respectively. Whiskers indicate the minimum and maximum values.
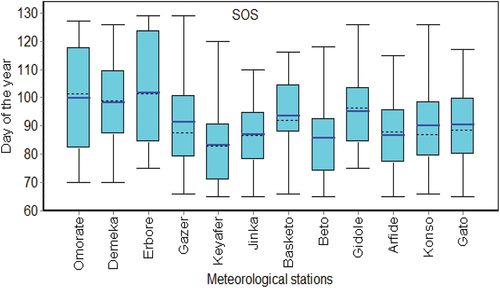
Table 3. Variability of SOS, EOS, and LGP of Belg (spring) rainfall in southwest Ethiopia for the period 1983 to 2016
a and b indicate the lowest and highest day of the year, respectively, for SOS and EOS. x and y represent shortest and longest LGP, respectively. c and CV indicate mean and coefficient of variation.respectively.
Weather stations such as Omorate and Erbore had moderate variability in the onset of spring season, while the remaining stations showed lower fluctuations in the start of rain in this season (Table ). The lowest value of 25 percentile (days for occurrence of SOS once in 4 years) was 71 DOY (Keyafer), while the highest value of the 25 percentile was 87 (Basketo and Demeka) (Figure ). Similarly, the lowest value of the 50 (days of occurrence of SOS twice in 4 years) and 75 percentiles (days of occurrence of SOS thrice in 4 years) was 83 and 91 DOY (Keyafer), respectively, while the highest value of 50 and 75 percentiles was 125 DOY (Erbore), respectively (Figure ).
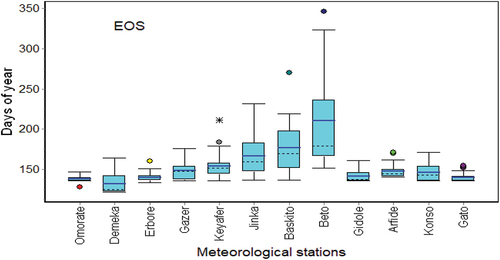
The variability of EOS across weather stations ranged from 4.2 to 27.2% over the period 1983 to 2016. The EOS varied from 122 (May 1) to 346 DOY (December 11) (Table , Figure ). The highest and lowest variabilities of EOS were observed at Beto and Erbore, respectively. The lowest values of 25 (122 DOY) and 50 (126 DOY) percentiles were recorded at Demeka (Figure ). Similarly, the lowest 75 (141 DOY) percentile was recorded at Omorate. On the contrary, the highest value of 25 (165 DOY), 50 (180 DOY), and 75 (238 DOY) percentile were recorded at Beto.
Figure 7. End of spring season of weather stations in Southwest Ethiopia. Boxes indicate the lower and upper quartiles. The solid and dotted lines within the box are the mean and median, respectively. Whiskers indicate the minimum and maximum values, and dots are outliers.
The LGP of the region showed high variability ranging from 26.8% (Gato) to 48.9% (Beto) with mean of 29.4% over the period 1983 to 2016 (Table ). The shortest growing period over the weather stations varied from 10 to 40 days with mean of 22 days, while the longest growing period ranged from 59 to 258 days with an average of 118 days (Table , Figure ). The shortest growing period was recorded at Omorate and Demeka, while Beto experienced the longest LGP. The LGP at the regional level was strongly correlated with both SOS (r = −0.77) and EOS (r = 0.77) (Figure ). The LGP was increased as the season starts early and vice versa. However, individual weather stations showed different results to some extent (data not shown). For instance, LGP at Beto was strongly and weakly correlated with EOS (r = 0.97) and SOS (r = −0.37), respectively, while it had weak and moderate correlations with EOS and SOS, respectively, at Demeka. Generally, LGP had strong correlation with SOS and EOS at weather stations in Southern and Northern parts of the region, respectively.
Figure 8. Length of growing season in Southwest Ethiopia for the period 1983 to 2016. Boxes indicate the lower and upper quartiles. The solid and dotted lines within the box are the mean and median, respectively. Whiskers indicate the minimum and maximum values, and dots are outliers.
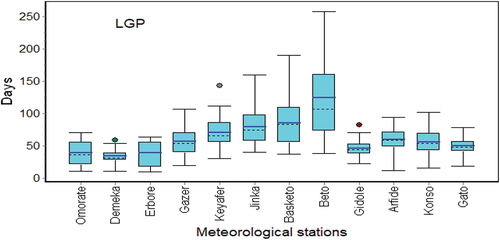
Figure 9. The relation between LGP with (a) SOS and (b) EOS for South West Ethiopia over the period 1983 to 2016. r is Pearson’s correlation coefficient.
3.3. Risks associated with rainfall variability
3.3.1. Dry spell
The probability of dry spells longer than 5, 7, 10, and 15 days is shown in Figure for selected weather stations representing different parts of the region. The region experienced two long dry spell periods over the year except the northern parts (Figure ). The first drought period occurred between June and August and peaked in July. The second extended dry spells period happened between December to February and peaked in January. One dry spell period occurring between December to February was observed at Basketo. In addition, the probability of dry spells occurrence in spring and autumn seasons was lower than that of the remaining seasons. Furthermore, the probability of dry spells occurrence was lower during spring than autumn season in all parts of the region except the northern part. Longer dry spells had lower duration than shorter dry spells. Stations in southern part of the region experienced longer duration of all dry spell categories than the remaining stations indicating that southern part of the region had a higher probability of drought occurrence throughout the year.
Figure 10. Length of dry spells of selected weather stations in Southwest Ethiopia over the period 1983 to 2016.
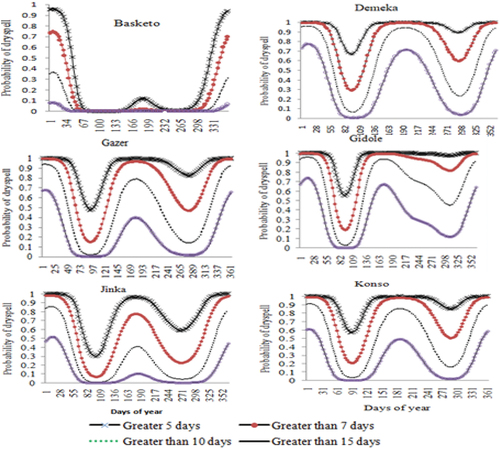
The probability of dry spells longer than 5 days started to increase after 97 and 298 DOY for Demeka, Gazer, and Gidole, 100 and 298 DOY for Konso, 103 and 277 DOY for Jinka, and 145 and 277 DOY for Basketo (Figure ). Similarly, the probability of dry spells longer than 15 days started to increase after 112 and 307 DOY for Demeka, 115 and 301 DOY for Gazer, 115 and 316 DOY for Gidole, 112 and 301 DOY for Konso, 136 and 298 DOY for Jinka, and 334 DOY for Basketo. On the contrary, the probability of dry spells length longer than 5 days started to decrease after 52 and 252 DOY for Demeka, 49 and 214 DOY for Gazer, 58 and 262 DOY for Gidole, 49 and 244 DOY for Konso, 46 and 235 DOY for Jinka, and 19 and 238 DOY for Basketo (Figure ). Similarly, the probability of dry spells length longer than 15 days started to decrease after 19 and 202 DOY for Demeka, 13 and 184 DOY for Gazer, 19 and 181 DOY for Gidole, 19 and 196 DOY for Konso, 19 and 196 DOY for Jinka, and 10 DOY for Basketo. Generally, the probability of dry spell curves for more than 5, 7, 10, and 15 days converge to their maximum and minimum during the peak dry and rain seasons, respectively, at two time slots.
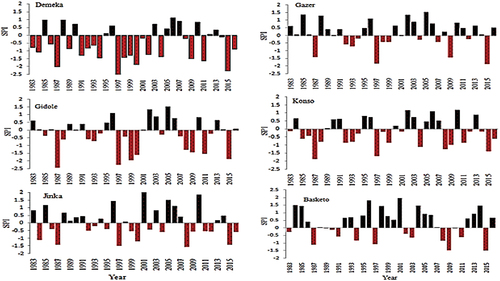
Figure 11. Sandard precipitation index of spring season (March to May) for selected weather stations over the period 1983 to 2016.
3.3.2. Drought occurrence
The region experienced very wet to extremely dry (extreme drought) conditions in spring and autumn seasons over the period 1983 to 2016 (Figures , Tables ). Higher number of wet and dry years was observed at stations found in northern and southern parts of the region, respectively, over this period. There was no occurrence of wet years beyond moderately wet conditions during the spring season at all weather stations except Basketo, Beto, and Jinka for which only 2 years out of 34 years (6%) experienced very wet conditions (Table ). Higher number of wet years was observed at Beto (18%), Basketo (15%), and Gazer (15%), while no moderately wet years were recorded for Omorate, Erbore, and Demeka. Mostly near-normal conditions were observed in the region, with the percentage of years that fell into this category ranged from 50 to 74% (17 to 25 years out of 34 years). All parts of the region was vulnerable to moderate and severe drought with frequency of 2 to 10 and 1 to 6 years, respectively, over the period 1983 to 2016 (Table ). Similarly, extreme drought events were observed in the region with frequency of 1 to 6 years over 34 years, while Basketo, Beto, Gazer, Konso, and Jinka have not experienced such drought intensity.
Figure 12. Standard precipitation index of autumn season (September to November) for selected weather stations over the period 1983 to 2016.
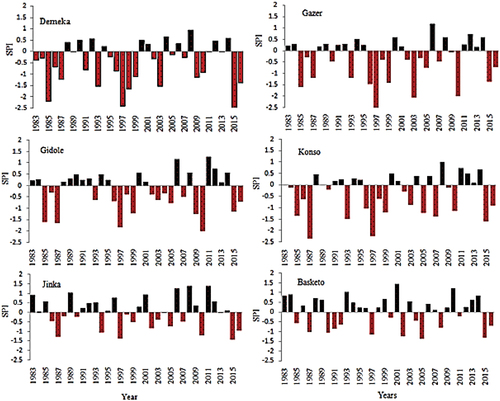
Table 4. Percentage (%) occurrence of spring season (March to May) dry and wet conditions of weather stations in Southwest Ethiopia over the period 1983 –2016
Table 5. Percentage (%) occurrence of autumn season dry and wet conditions of weather stations in Southwest Ethiopia over the period 1983–2016
Very wet spring season was recorded at Basketo in 1996 and 2001 and at Jinka in 2001 and 2010 (Fig 3.12). Similarly, moderately wet spring season was recorded at Basketo in 1984, 1985, 1998, 2004, 2008, and 2014; at Jinka in 1985, 1996, 2005, and 2006; at Gzer in 1985, 1988, 1996, 2002, and 2005; at Gidole in 1996, 2002, and 2005; at Konso in 2002, 2006, and 2010; and at Demeka in 2006. On the contrary, extremely dry spring season was recorded at Demeka in 1997 and 2015 and at Gidole in 1987 and 1997 (Fig 3.12). Similarly, severely dry spring season existed at Demeka in 1987, 2000, and 2011; at Konso in 2004, 2008, and 2015; at Gazer in 1997 and 2015; and at Gidole in 1999, 2000, 2011, and 2015. In addition, moderately dry spring season was recorded at Demeka in 1984, 1991, 1994, 1998, 1999, 2002, 2004, and 2009; at Konso in 2004, 2008, and 2015; at Jinkain 1984, 1987, 1997, 2004, and 2015; at Basketo in 1987, 1997, 2009, and 2015; at Gazer in 1987 and 2009; and at Gidole in 2008 and 2009.
Similar to the spring season, higher wet and dry conditions were observed more frequently during autumn at stations found in northern and southern parts of the region, respectively, for the period 1983 to 2016 (Table ). The region experienced moderately wet autumn season with frequency of 1 (at Gazer) to 5 (at Beto) years out of 34 years while no wet autumn season existed at stations such as Arfide, Erbore, Konso, and Omorate. Severely and extremely dry autumn seasons existed at stations such as Arfide, Demeka, Erbore, Gazer Gato, Gidole, Keyafer, Konso, and Omorate with frequency of 1 to 4 years out of 34 years. On the contrary, there was no severe and extreme drought at stations such as Basketo, Beto, and Jinka. The occurrence of near-normal years in autumn season ranged from 59 to 88% over the year 1983 to 2016. Extremely wet and very wet autumn seasons existed at any part of the region. The number of dry years was higher than wet years in this season over the period 1983 to 2016 . Moderately wet autumn season existed at Gazer in 2006; at Jinka in 1989, 2006, 2008, and 2011; at Basketo in 1993, 2001, and 2010; and at Gidole in 2006 and 2011. On the contrary, extremely dry season existed at Gazer in 1997 and 2003; at Konso in 1987 and 1997; at Gidole in 2010; and at Demeka in 1985, 1997, and 2015. Similarly, severely dry autumn season existed at Gazer in 1985 and 2010; at Gidole in 1985, 1987, 1997, and 2010; and at Demeka in 1993, 1998, and 2003. In addition, moderately dry autumn seasons were recorded at Gazer in 1987, 1993, 1996, 1999, and 2015; at Jinka in 1987, 1994, 1997, and 2015; at Basketo in 1987, 1990, 1997, 2002, 2005, and 2015; at Konso in 1985, 1993, 1996, 1999, 2005, 2007, and 2010; at Gidole in 1999, 2009, and 2015; and Demeka in 1987, 1999, 2009, and 2016 (Fig. 13).
4. Discussion
4.1. Annual and seasonal rainfall pattern and variability
The region had bimodal rainfall pattern occurring from March to May (main rainy season) and September to November (short rainy season). The contribution of spring rainfall was higher than autumn season to the annual rainfall all over the region. In line with this result, Alhamshry et al. (Citation2020) reported that the region experienced long rainfall season (March to May) with peaks in April/May and short rainfall cycle from October to November. In addition, Diro et al. (Citation2008), Araro et al. (Citation2019), and Wakjira et al. (Citation2021) indicated the existence of two distinct rainfall seasons (spring and autumn) in this region. The seasonal migration of the Inter-Tropical Convergence Zone and associated atmospheric circulations bring the rainfall during these seasons (Dunning et al., Citation2016; Mera, Citation2018; Recha et al., Citation2012). For instance, the eastern Atlantic and western Indian Ocean monsoon systems become stronger and displacement of the equatorial trough directed northward during the spring season and southward during autumn season, which all together are some of the triggers for precipitation in these seasons. The existence of a bimodal rainfall pattern provides the opportunity for producing crops in two seasons and enables farmers growing crops with higher water requirement during the spring and those with low water requirement in autumn season. However, risks associated with rainfall variability are the main challenge of crop production in the region at both seasons (Habte et al., Citation2021a and b).
There was temporal variation of annual and seasonal rainfall ranging from low to higher magnitude over the period 1983 to 2016. The variability of annual rainfall was 17.79 to 29.93%, while the spring, autumn, and summer rainfall variability ranged from 21.23 to 41.56, 36.38 to 122.00, and 32.37 to 68.08%, respectively. In addition, there was divergence on the variability of both annual and seasonal rainfall across weather stations in the region. Similarly, the PCI analysis indicated that some parts of the region had relatively uniform distribution of rainfall while other parts had irregular and strongly irregular distribution over the period 1983 to 2016. These situations confirm that most parts of the region had variable and unpredictable annual and seasonal rainfall that affects agricultural activities, especially rainfed crop production. Similarly, Bekele et al. (Citation2018) and Teshome and Zhang (Citation2019) reported that annual and seasonal rainfall of different parts of Ethiopia including the current study area showed inter-annual and inter-seasonal variabilities.
Variability of rainfall and its concentration in a few months shorten the crop growing period and constrain the production and productivity of crops, ultimately affecting food security of farmers (Kyei-Mensah et al., Citation2019; Sujariya et al., Citation2020). There are different factors relating to the variability of rainfall in Ethiopia. For instance, ENSO that occurs every 2 to 4 years results in low rainfall and in extreme cases flood and drought (Gleixner et al., Citation2017; Mera, Citation2018). Similarly, oceanic influence related to sea surface temperature of Atlantic and Indian Oceans and low-level winds from these oceans via westerly and easterly winds, as well as teleconnections from the tropical Pacific plays role in the inter-annual rainfall variability of Ethiopia (Ummenhofer et al., Citation2009).
4.2. Seasonal events
The seasonal rainfall events especially SOS and LGP across weather stations showed spatial variability over the period 1983 to 2016. Higher variability of SOS and LGP with their strong association was observed in southern and eastern parts of the study area. On the contrary, the EOS was more variable in the northern and central parts and the LGP mainly depended on the cessation of the rain than its onset. Supporting the current findings, Legese et al. (Citation2018) reported that temporal variability on the onset and cessation of rainy seasons exists in different parts of Ethiopia. The timing of onset of seasons and its cessation is linked with sea level pressure and surface temperature over Indian and Atlantic Oceans. Lower pressure associated with higher temperature over these seasons correlate with the onset of the season, while higher pressure along with lower temperature is associated with dry and cool air, which is a cause of the late onset and also cessation of the rainy season (Alhamshry et al., Citation2020; Nicholson, Citation2017). Therefore, in the southern and eastern parts of the current study area, care should be given to the timing of early agricultural activities such as planting and fertilizer application. On the other hand, in the central and northern parts activities such as harvesting and storage must be carried out by considering the cessation of rainfall. The SOS had higher variability than the EOS, indicating the probability of predicating SOS is less than EOS. In line with this result, Ademe et al. (Citation2020) reported that inter-annual variability of the onset of rainfall is higher than its cessation in Ethiopia and Eastern Africa. Therefore, decisions related to early crop management practices such as planting and fertilizer application are made at certain degree of risk. Supporting this result, Mamo (Citation2005) reported that decisions related to harvesting, transporting, and storage could be made more easily than the decision related to planting due to instability of SOS than EOS. Furthermore, Kassie et al. (Citation2013) asserted that the variability in SOS accompanied with false SOS that brings failure of early planting. In addition, short LGP with higher CV for most parts of the region revealed that rainfed crop production is undertaken with risks. Under such unreliable conditions, the farming activities have to be harmonized with the existing situation by introducing suitable interventions (Habte et al., Citation2021a & Citation2021b).
4.3. Associated with rainfall variability
The annual and seasonal rainfall patterns of the region are accompanied with occurrence of dry spells of more than 5 to 15 days at two periods except the northern parts for which only one dry season existed between December and February. Although the highest probability of extended dry spells occurred during the dry periods (summer and winter), dry spells were also found in the spring and autumn seasons. This indicated that there was probability of risk occurrence in relation to soil moisture deficit and crop growth during the spring and autumn rainy seasons of the region. In addition, the higher probability of dry spell occurrence in southern and western parts of the region indicated less suitability of these area for rainfed farming system specially crop production. The degree of associated risks on crop growth during the occurrence of dry spells varies with initial soil moisture at the onset of the season and soil characteristics, especially water holding capacity and crop types. For instance, the effect of dry spells will be lower when sufficient soil moisture at onset of the season is available, soil has good water holding capacity, and crop mature early and has higher water use efficiency (Mupangwa et al., Citation2016).
The prolonged dry spells (more than 15 days) during spring and autumn seasons resulted in moderate to extreme drought in the region over the period 1983 to 2016. Drought at its different levels of severity and frequency occurred over different parts of the region. Supporting the current findings, Gebremichael et al. (Citation2014) reported that recurrent drought is observed in the region. Furthermore, Habte et al.,(Citation2021a) explained that drought is one of the manifestations of climate change and challenges peoples’ livelihood in southwest Ethiopia. In addition, the drought years in the current findings are similar to those years reported for different parts of the country (Esayas et al., Citation2019; Teshome & Zhang, Citation2019; Viste et al., Citation2013). The drought occurrence in Ethiopia is mostly associated with the year of dry El Niño episodes and its subsequent year. For instance, the years 1984, 1987, 1991, 1997, 2002, 2009, and 2015 were considered as years of drought and coincide with El Niño events (Viste et al., Citation2013). In addition, Zeleke et al. (Citation2017) reported that the drying trend in the south and southwest Ethiopia is associated with Atlantic ocean warming and sea surface temperature gradients across the western Pacific ocean.
5. Conclusion
The region experiences bimodal rainfall patterns that result in two rainy seasons, spring (March to May) and autumn (September to November). From 1983 to 2016y, the main rainy season (spring) contributed to nearly half of the annual rainfall while the autumn took one-third of it. The annual and seasonal rainfall of the region showed low to high variability over this period. In addition, the analysis of PCI indicated that there were relatively uniform to strongly irregular distribution of rainfall between years over the region. The main season (spring) mostly started in the first week of March while it showed temporal variability over the period 1983 to 2016. In addition, there was variability on the cessation of rainfall across weather stations. The growing period was rather shorter throughout the region except northern and central parts. The region experienced dry spells of more than 5 to 15 days and peaked at two peaked periods (summer and winter) except northern part. In addition, there was high frequency of drought ranging from moderate to strong intensity over the period 1983 to 2016. Hence, planned interventions such as climate advisory service, water conservation practices, supplemental and deficit irrigation, using drought tolerant and early maturing crops, and using multiple cropping and livelihood diversification have to be introduced to the area to cope with the effect of risks associated with rainfall variability in addition to farmers’ own adaptive strategies.
Acknowledgments
The work is an output of a PhD scholarship at the Hawassa University, in the framework of the German-Ethiopian SDG Graduate School “Climate Change Effects on Food Security (CLIFOOD)” between the Food Security Center, University of Hohenheim (Germany) and the Hawassa University (Ethiopia), supported by the DAAD with funds from the Federal Ministry for Economic Cooperation and Development (BMZ).
Disclosure statement
No potential conflict of interest was reported by the author(s).
Data availability statement
All the raw and processed data are available from the corresponding author upon request. However, permission is required from the National Meteorological Agency of Ethiopia to provide raw rainfall and temperature data.
Additional information
Funding
References
- Adane, G. B., Hirpa, B. A., Song, C., & Lee, W.-K. (2020). Rainfall characterization and trend analysis of wet spell length across varied landscapes of the upper Awash River Basin, Ethiopia. Sustainability, 12(21), 9221. https://doi.org/10.3390/su12219221
- Ademe, F., Kibret, K., Beyene, S., Getinet, M., & Mitike, G. (2020). Rainfall analysis for rain-fed farming in the great rift valley basins of Ethiopia. Journal of Water and Climate Change, 11(3), 11(3).812–20. https://doi.org/10.2166/wcc.2019.242
- Alemu, D., & Berhanu, K. (2018). The political economy of agricultural commercialization in Ethiopia: Discourses, actors and structural impediments. Agricultural policy research in Africa Working Paper 14. https://opendocs.ids.ac.uk/opendocs/handle/20.500.12413/16691?
- Alhamshry, A., Fenta, A. A., Yasuda, H., Kimura, R., & Shimizu, K. (2020). Seasonal rainfall variability in Ethiopia and its long-term link to global sea surface temperatures. MS Binici and E Acs Water, 12(1), 55. https://doi.org/10.3390/w12010055
- Araro, K., Legesse, S. A., & Meshesha, D. T. (2019). Climate change and variability impacts on rural livelihoods and adaptation strategies in Southern Ethiopia. Earth Systems and Environment, 4(1), 15–26. https://doi.org/10.1007/s41748-019-00134-9
- Asfaw, A., Simane, B., Hassen, A., & Bantider, A. (2018). Variability and time series trend analysis of rainfall and temperature in north central Ethiopia: A case study in Woleka sub-basin. Weather and Climate Extremes, 19, 29–41. https://doi.org/10.1016/j.wace.2017.12.002
- Bahiru, W., Wende, E., Mohammed, L., Mohammed, Y., Adem, H., & Demmisie, Y. (2020). Assessing the impact of rainfall variability on teff production and farmers perception at Gubalafto district, North Eastern, Ethiopia. International Journal of Earth Science and Geophysics, 6(2), 042. https://doi.org/10.35840/2631-5033/1842
- Bekele, B. E., Thiaw, W. M., & Korecha, D. (2018). Sub-seasonal variability of the Belg rains in Ethiopia. International Journal of Climatology, 38(7), 2940–2953. https://doi.org/10.1002/joc.5474
- Bjornlund, V., Bjornlund, H., & Van Rooyen, A. F. (2020). Why agricultural production in sub-Saharan Africa remains low compared to the rest of the world – a historical perspective. International Journal of Water Resources Development, 36(S1), S20–S53. https://doi.org/10.1080/07900627.2020.1739512
- CSA (2020) Agricultural sample survey report on area and production of crops (private peasant holdings, meher season). Statistical bulletin 587. Central Statistical Agency, Addis Abeba, Ethiopia. https://www.statsethiopia.gov.et/agriculture/area-and-production-for-major-crops-private-peasant-holdings-meher-season-2019-20-2012-e-c/
- De Luis, M., González-Hidalgo, J. C., Brunetti, M., & Longares, L. A. ((2011)). Precipitation concentration changes in Spain 1946–2005. Natural Hazards and Earth System Sciences, 11, 1259–1265. https://doi.org/10.5194/nhess-11-1259-2011
- Diro, G. T., Black, E., & Grimes, D. I. F. (2008). Seasonal forecasting of Ethiopian spring rains. Meteorological Applications, 15(1), 73–83. https://doi.org/10.1002/met.63
- Dunning, C. M., Black, E. C. L., & Allan, R. P. (2016). The onset and cessation of seasonal rainfall over Africa. Journal of Geophysical Research: Atmospheres, 121(11), 405–424. https://doi.org/10.1002/2016JD025428
- Enyew, B. D., & Hutjis, R. (2015). Climate change impact and adaptation in South Omo Zone. Ethiopia Journal of Geology & Geophysics, 4, 208. https://doi.org/10.4172/2381/8719.1000208
- Esayas, B., Simane, B., Teferi, E., Ongoma, V., & Tefera, N. (2018). Trends in extreme climate events over three agroecological zones of Southern Ethiopia. Advances in Meteorology, 2018, 1–17. https://doi.org/10.13140/RG.2.2.29790.89921
- Esayas, B., Simane, B., Teferi, E., Ongoma, V., & Tefera, N. (2019). Climate variability and farmers’ perception in Southern Ethiopia. Advances in Meteorology, 2019, 1–19. https://doi.org/10.1155/2019/7341465
- Gbangou, T., Ludwig, F., vanSlobbe, E., Hoang, L., & Kranjac-Berisavljevic, G. (2019). Seasonal variability and predictability of agro-meteorological indices: Tailoring onset of rainy season estimation to meet farmers’ needs in Ghana. Climate Services, 14, 19–30. https://doi.org/10.1016/j.cliser.2019.04.002
- Gebrechorkos, S. H., Hülsmann, S., & Bernhofer, C. (2019). Long term trends in rainfall and temperature using high-resolution climate datasets in East Africa. Scientific Reports, 9(1), 11376. https://doi.org/10.1038/s41598-019-47933-8
- Gebremichael, A., Quraishi, S., & Mamo, G. (2014). Analysis of seasonal rainfall variability for agricultural water resource management in Southern region, Ethiopia. Journal of Natural Sciences Research, 4(11), 56–79.
- Gemeda, D. O. (2019). Climate Change variability analysis in and around Jinka, Southern Ethiopia. With special emphasis on temperature and rainfall. Journal of Agricultural Sciences – Sri Lanka, 14(3), 145–153. https://doi.org/10.4038/jas.v14i3.8598
- Gleixner, S., Keenlyside, N., Viste, E., & Korecha, D. (2017). The El Niño effect on Ethiopian summer rainfall. Climate Dynamics, 49(5–6), 1865–1883. https://doi.org/10.1007/s00382-016-3421-z
- Habte, A., Worku, W., Gayler, S., Ayalew, D., & Mamo, G. (2021a). Model-based yield gap analysis and constraints of rainfed sorghum production in Southwest Ethiopia. The Journal of Agricultural Science, 158(10), 855–869. https://doi.org/10.1017/S0021859621000435
- Habte, A., Worku, W., Gayler, S., Ayalew, D., Mamo, G., & Diaz, J. (2021b). Spatial variability and temporal trends of climate change in Southwest Ethiopia: Association with farmers’ perception and their adaptation strategies. Advances in Meteorology, 2021, 1–13. https://doi.org/10.1155/2021/3863530
- Kassie, B. T., Rötter, R. P., Hengsdijk, H., Asseng, S., Ittersum, M. K. V., Kahiluoto, H., & Van Keulen, H. (2013). Climate variability and change in the central rift valley of Ethiopia: Challenges for rainfed crop production. The Journal of Agricultural Science, 152(1), 58–74. https://doi.org/10.1017/S0021859612000986
- Kebede, M., Shimbir, T., Kasa, G., Abera, D., & Girma, T. (2017). Description, characterization and classification of the major soils in Jinka Agricultural Research Center, South Western Ethiopia. Journal of Soil Science and Environmental Management, 8(3), 61–69. https://doi.org/10.5897/JSSEM2015.0498
- Kipkorir, E. C., Raes, D., Bargerei, R. J., & Mugalavai, E. M. (2007). Evaluation of two risk assessment methods for sowing maize in Kenya. Agricultural and Forest Meteorology, 144, 193–199. https://doi.org/10.1016/j.agrformet.2007.02.008
- Kyei-Mensah, C., Kyerematen, R., & Adu-Acheampong, S. (2019). Impact of rainfall variability on crop production within the worobong ecological area of Fanteakwa District, Ghana. Advances in Agriculture, 2019, 1–7. https://doi.org/10.1155/2019/7930127
- Legese, W., Koricha, D., & Ture, K. (2018). Characteristics of seasonal rainfall and its distribution over Bale Highland, Southeastern Ethiopia. Journal of Earth Science & Climatic Change, 9(2), https://doi.org/10.4172/2157-7617.1000443
- Mamo, G. (2005). Using seasonal climate outlook to advice on sorghum production in the central Rift valley of [ Ethiopia.PhD Thesis]. Blomefontein, Republic of South Africa. 85p
- McKee, T. B., Doesken, N. J., & Kleist, J. (1993). Drought monitoring with multiple time scales. In Proceedings of the 9th Conference on Applied Climatology, Dallas, TX, USA, 233–236.
- McKee, T. B., Doesken, N. J., & Kleist, J. (1995). Drought monitoring with multiple time scales. Preprints, 9th Conference on Applied Climatology 15-20, January, Dallas, Texas, American Meteorological Society: 233–236.
- Megers, G., Tesfaye, K., Getnet, M., Tana, T., Jaleta, M., & Lakew, B. (2019). Rainfall variability and its implications for wheat and barley production in central Ethiopia. Ethiopian Journal of Crop Science, 7(2), 89–111.
- Mera, G. (2018). Drought and its impacts in Ethiopia. Weather and Climate Extremes, 22, 24–35. https://doi.org/10.1016/j.wace.2018.10.002
- Moges, D. M., & Bhat, H. G. (2021). Climate change and its implications for rainfed agriculture in Ethiopia. Journal of Water and Climate Change, 12(4), 1229–1244. https://doi.org/10.2166/wcc.2020.058
- Mugalavai, E., Kipkorir, E. C., Raes, D., & Rao, M. S. (2008). Analysis of rainfall onset, cessation and length of growing season for western Kenya. Agricultural and Forest Meteorology, 148(6–7), 1123–1135. https://doi.org/10.1016/j.agrformet.2008.02.013
- Muluneh, A., Stroosnijder, L., Keesstra, S., & Biazin, B. (2017). Adapting to climate change for food security in the Rift Valley dry lands of Ethiopia: Supplemental irrigation, plant density and sowing date. The Journal of Agricultural Science, 155(5), 703–724. https://doi.org/10.1017/S0021859616000897
- Mupangwa, W., Walker, S., Masvaya, E., Magombeyi, M., & Munguamb, P. (2016). Rainfall risk and the potential of reduced tillage systems to conserve soil water in semi-arid cropping systems of southern Africa. AIMS Agriculture and Food, 1(1), 85–101. https://doi.org/10.3934/agrfood.2016.1.85
- National Meteorological Services Agency (NMSA). (2001). Initial national communication of Ethiopia to the United Nations Framework Convention on Climate Change (UNFCCC). Addis Ababa.
- Nicholson, S. E. (2017). Climate and climatic variability of rainfall over eastern Africa. Reviews of Geophysics, 55(3), 590–635. https://doi.org/10.1002/2016RG000544
- Oliver, J. E. (1980). Monthly precipitation distribution: A comparative index. The Professional Geographer, 32(3), 300–309. https://doi.org/10.1111/j.0033-0124.1980.00300.x
- Recha, C. W., Makokha, G. L., Traore, P. S., Shisanya, C., Lodoun, T., & Sako, A. (2012). Determination of seasonal rainfall variability, onset and cessation in semi-arid Tharaka district, Kenya. Theoretical and Applied Climatology, 108(3–4), 479–494. https://doi.org/10.1007/s00704-011-0544-3
- Reda, A. T. (2015). SMHI-RCA model captures the spatial and temporal variability in precipitation anomalies over East Africa. Journal of Climatology & Weather Forecasting, 3(03), 138. https://doi.org/10.4172/2332-2594.1000138
- Shimeles, A., Verdier-Chouchane, A., & Boly, A. (2018). Introduction: Understanding the challenges of the agricultural sector in sub-Saharan Africa. In A. Shimeles, A. Verdier-Chouchane, & A. Boly (Eds.), Building a resilient and sustainable agriculture in Sub-Saharan Africa. Palgrave Macmillan. https://doi.org/10.1007/978-3-319-76222-7
- Stern, B. R. D., & Cooper, P. J. M. (2011). Assessing climate risk and climate change using rainfall data – a case study from Zambia. Experimental Agriculture, 47(2), 241–266. https://doi.org/10.1017/S0014479711000081
- Stern, R. D., Dennett, M. D., & Dale, I. C. (1982). Analysis daily rainfall measurement to give agronomically useful results. I. Direct methods. Experimental Agriculture, 18, 223–236. https://doi.org/10.1017/S001447970001379X
- Sujariya, S., Jongrungklang, N., Jongdee, B., Inthavong, T., Budhaboon, C., ShuFukai, & Fukai, S. (2020). Rainfall variability and its effects on growing period and grain yield for rainfed lowland rice under transplanting system in Northeast Thailand. Plant Production Science, 23(1), 48–59. https://doi.org/10.1080/1343943X.2019.1698970
- Teshome, A., & Zhang, J. (2019). Increase of extreme drought over Ethiopia under climate warming. Advances in Meteorology, 2019, 1–18. https://doi.org/10.1155/2019/5235429
- Ummenhofer, C. C., Sen Gupta, A., & England, M. H. (2009). Contribution of Indian Ocean sea surface temperatures to enhance east African rainfall. Journal of Climate, 22, 993–1013. https://doi.org/10.1175/2008JCLI2493.1
- Viste, E., Korecha, D., & Sorteberg, A. (2013). Recent drought and precipitation tendencies in Ethiopia. Theoretical and Applied Climatology, 112(3–4), 535–551. https://doi.org/10.1007/s00704-012-0746-3
- Wakjira, M. T., Peleg, N., Anghileri, D., Molnar, D., Alamirew, T., Six, J., & Molnar, P. (2021). Rainfall seasonality and timing: Implications for cereal crop production in Ethiopia. Agricultural and Forest Meteorology, 310, 108633. https://doi.org/10.1016/j.agrformet.2021.108633
- Wendimu, G. Y., & Tejada Moral, M. (2021). The challenges and prospects of Ethiopian agriculture. Cogent Food & Agriculture, 7(1), 1923619. https://doi.org/10.1080/23311932.2021.1923619
- Zeleke, T. T., Giorgi, F., Diroc, G. T., & Zaitchikd, B. F. (2017). Trend and periodicity of drought over Ethiopia. International Journal of Climatology, 37(13), 4733–4748. https://doi.org/10.1002/joc.5122
- Zhang, X., & Yang, F. (2004). RClimDex (1.0) user manual. Climate research branch. Environment Canada. https://acmad.net/rcc/procedure/RClimDexUserManual.pdf