
 ?Mathematical formulae have been encoded as MathML and are displayed in this HTML version using MathJax in order to improve their display. Uncheck the box to turn MathJax off. This feature requires Javascript. Click on a formula to zoom.
Abstract
The panicle architecture is a critical determinant of the reproductive success of rice plants and has a direct impact on grain production. In this study, we evaluated the genetic variation of panicle parameters in fifteen rice genotypes and compared them with five commonly grown cultivars in the study area to assess their potential for crop improvement initiatives. The selection of the 15 genotypes was based on specific criteria, including diversity in origin, grain type, and adaptation to local conditions. Significant morphological variations were observed among the rice accessions for panicle parameters, including panicle length, weight, test weight, panicle number, grains/panicle, chaffs/panicle, and flag leaf area. Principal component analysis (PCA) revealed that the first two axes explained 59.8% of the total variance, indicating substantial variability in panicle features across the genotypes. Panicle length, panicle weight, and flag leaf area were identified as significant variables contributing to phenotypic variation. Multiple correlation analysis indicated that panicle weight was strongly positively correlated with panicle length, flagleaf area, grains/panicle, and test weight but was negatively correlated with panicle number, chaffs/panicle, and panicle angle. Genetic advance as a percentage of the mean (GAM) ranged from 7.226% for panicle number to 70.728% for chaffs/panicle. Traits such as grain/panicle, panicle length, flag leaf area, chaffs/panicle, and test weight exhibited high GAM and heritability, highlighting their significance for selection during crop improvement. Certain rice accessions, namely SVIN123, IR106523-25-34-3-2-13-1-2, Radha-13, and IR15L17315, demonstrated superior panicle weight, larger grains/panicle, and panicle length, making them attractive candidates for future rice breeding projects.
PUBLIC INTEREST STATEMENT
This research on the genetic variability of panicle architecture traits in rice accessions addresses a topic of great importance to rice breeders, farmers, and policymakers. Rice is a staple crop in Nepal, and understanding the genetic basis of panicle architecture traits is crucial for improving rice productivity and ensuring food security. This research aims to provide valuable insights for the development of high-yielding rice varieties suitable for the local agro-climatic conditions. These findings can have direct implications for enhancing crop resilience, increasing yield potential, and improving the overall agricultural productivity in the region. Furthermore, this study highlights the significance of preserving and utilizing local germplasm, including traditional rice varieties, which are rich sources of genetic diversity and hold potential for future breeding programs. The outcomes of this research are expected to contribute to sustainable rice cultivation practices, strengthen local agricultural systems, and ultimately benefit the broader community by ensuring a more secure and sustainable rice production in the Eastern Terai region of Nepal.
1. Introduction
Rice (Oryza sativa L.) is a fundamental crop that serves as a staple food for more than half of the world’s population. However, global rice production is currently insufficient to meet the increasing demand for food, which is expected to rise by 1–2.4% by 2050 (A. Gautam & Shrestha, Citation2023). According to the Food and Agriculture Organization (FAO), Nepal’s rice production reached approximately 5.8 million metric tons in 2020. However, recent data obtained in 2021 indicate a reduction in rice production by 8.7% (FAO, Citation2022). Nepal is positioned as the 17th largest producer of rice globally, while its rice productivity ranks at the 64th position. The Nepal Agriculture Research Council (NARC) has successfully developed 82 distinct rice varieties, and an additional 48 hybrid rice varieties have been officially registered with the Government of Nepal (Choudhary et al., Citation2022). However, when compared to neighbouring countries like Bangladesh (4.4 t ha−1) and China (6.7 t ha−1), the productivity of the rice sub-sector in Nepal (3.5 t ha−1) falls behind. It is worth noting that Nepal’s rice productivity is on par with India (3.7 t ha−1) and Pakistan (3.5 t ha−1) (FAOSTAT, Citation2019). Rice is cultivated extensively in different agro-climatic conditions globally, and to meet the growing demand, it is crucial to enhance its grain yield (Mishra et al., Citation2021). The structure of the rice panicle and the grains/panicle are crucial breeding targets that affect overall grain yield and the development of new rice plant types with desirable panicle-related traits (Zhi et al., Citation2021). The grain yield of rice is a complex trait influenced by several factors, such as panicle size, panicle/plant, grains/panicle, grain weight, and spikelet fertility (Saito et al., Citation2023).
Panicle architecture is a major determinant of reproductive success and plays a direct role in grain yield. As a result, it has been a significant focus of cereal crop domestication (Lu et al., Citation2017). The rice panicle architecture is a type of inflorescence that exhibits limited growth and comprises primary branches, secondary branches, and spikelets on the branches (Li et al., Citation2021). The central axis of the rice panicle typically consists of 8–10 nodes with intervals of 2–4 cm. Each primary branch usually has 2–4 secondary branches at its basal part. At maturity, each fertile spikelet bears a grain (Pk, Citation2013). In the last two decades, significant progress has been made in understanding the genetic basis of panicle development in rice. Genes that play crucial roles in regulating panicle length, branch number, and grains per panicle have been identified and functionally characterized (Bai et al., Citation2021). Moreover, recent research by Zhong et al. (Citation2021) has reported the discovery of a novel candidate gene (Os01g0140100) that is associated with the total spikelet number per panicle (TSNP). Furthermore, Zhong et al. (Citation2019) conducted research on grain traits in rice and found that five main grain traits were closely associated with each other. They observed that specific allelic combinations of seven key genes (GL7, GS3, GW8, GS5, TGW6, WTG1, and An-1) significantly influenced these grain traits. These favourable alleles were identified as factors that promote desirable panicle traits. Together, these studies highlight the ongoing efforts to unravel the genetic basis of panicle development and grain traits in rice. Additionally, plant hormones such as auxin, cytokinin, and gibberellin can also play crucial roles in panicle development, and several panicle trait genes affect tillering, panicle length, branch number, grain size, and number (Bai et al., Citation2021; Zhi et al., Citation2021). It is important to determine and consider panicle morphological traits to maximize the diversity of rice panicle resources (Prakash et al., Citation2022). Pedicel length is also critical to the diversity of inflorescence architecture (Lu et al., Citation2017). Therefore, it is essential to explore and preserve diverse genetic resources for enhancing crop yield through genetic improvement (Saito et al., Citation2023).
The Eastern Terai region of Nepal is characterized by unique agro-climatic conditions that significantly influence rice cultivation. In this study, we specifically selected rice accessions to assess the genetic variability of panicle architecture traits under these specific conditions. The selection of these rice accessions was driven by the need to capture the genetic diversity present in locally adapted genotypes and popular rice varieties commonly cultivated in the Eastern Terai region. However, a significant research gap exists in our understanding of the genetic variability in panicle architecture traits among rice accessions adapted to these conditions, as only a few studies have thoroughly investigated this aspect in rice. Furthermore, no previous studies have focused on the genetic variability of panicle architecture traits in rice accessions under the specific agro-climatic conditions of the Eastern Terai region. By studying these selected accessions, we aim to fill this knowledge gap and enhance our understanding of the genetic basis underlying panicle architecture traits. This research will provide valuable insights for rice breeders in their efforts to develop improved varieties suited for the unique agro-climatic conditions of the Eastern Terai region.
Thus, the specific objective of the study is: (i) To evaluate the genetic variability of panicle architecture traits in different rice accessions under the Eastern terai conditions of Nepal; (ii) To identify the rice accessions that exhibit superior panicle architecture traits under the given agro-climatic conditions; (iii) To determine the extent of correlation among the various panicle architecture traits and their contribution towards overall panicle structure; and (iv) To provide useful information (such as understanding the genetic basis of panicle architecture traits, assessing the extent of genetic diversity, and informing breeding strategies) to rice breeders for the development of high-yielding rice varieties with desirable panicle architecture traits suited for cultivation in the Eastern terai region of Nepal.
2. Materials and methods
2.1. Plant materials
The study selected 15 different genotypes and five rice varieties, namely Radha-13, Jeera masino, Bas dhan, Subarna sub-1, and Ranjeet, which are commonly cultivated in the area. Fifteen rice genotypes were specifically chosen for this study based on several criteria. Firstly, we aimed to include genotypes with diverse geographical origins to capture a wide range of genetic diversity. Additionally, we considered the adaptability of the genotypes to the local environmental conditions in the Eastern Terai region. By incorporating these factors, we ensured a representative sample of rice genotypes for assessing genetic variability in panicle architecture traits. Furthermore, genotypes with different grain types, such as long rice, short rice, and aromatic rice, were selected to encompass various rice types grown in the region. These rice accessions, including the fifteen genotypes and five rice varieties, belong to Oryza sativae indica subspecies. Table provides information about the sources and symbols of each rice accession. These rice accessions were acquired from the National Agricultural Research Council (NARC) in Tarahara, Morang, Nepal.
Table 1. List of rice accessions used for the study with their source and symbols
2.2. Experimental site
The study was conducted between June 2022 and October 2022 at the research field of Girija Prasad Koirala College of Agriculture and Research Centre, located in the Eastern region of Nepal in the Morang district’s Gothgaun Municipality. The site’s geographic coordinates are 26° 40’ 37.96“N latitude and 87° 20’ 55.95” E longitude, and it is situated at an elevation of 150 m above sea level. A visual representation of the experimental site is provided in Figure . Further, the meteorological parameters were recorded throughout the study period, which is represented in Table .
Figure 1. Map illustrating the experimental site of the study.
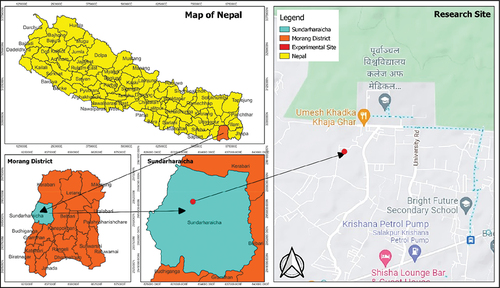
Table 2. Meteorological parameters throughout the study period
2.3. Experimental design and cultural practices
The experiment involved the evaluation of twenty rice accessions in a Randomized Complete Block Design (RCBD) replicated three times, which included 60 experimental plots. Each plot measured 2 × 2 m2, with ten rows of rice and ten hills per row. The spacing was maintained at 20 × 20 cm (row–row and plant–plant). Before sowing, the rice seeds were soaked in carbendazim @2 g/kg seed for 18 hours and were then sown in a wet seed bed. After 25 days, the seedlings were transplanted directly into the main field with 2–3 seedlings per hill. The seedlings were provided with 50:25: 25 NPK kg/ha to cover their nutrient requirements. Before sowing, 10 tons/ha of well-decomposed farmyard manure (FYM) was mixed into the soil of the main field, and 100:30:30 kg NPK Kg/ha was applied through Urea, Diammonium Phosphate (DAP), and Muriate of Potash (MOP) (MOALD, Citation2019). A half dose of N, a full dose of P, and a full dose of K was administered during the final land preparation. The remaining half of the N dose was applied in two splits during tillering and panicle initiation stages. Weeds were managed in the rice growing season with the pre-emergence application of Pendimethalin 50% EC, followed by two hand weeding sessions 30 and 45 days after transplanting. The crop was irrigated at each stage, including the pre-planting stage, tillering stage, panicle initiation stage, booting stage, and flowering and grain-filling stage, using the canal irrigation system. It’s worth noting that flooding irrigation was not employed. All intercultural practices were followed under the guidance and governance of the National Agricultural Research Council (NARC) in Tarahara, Morang, Nepal.
2.4. Data collection and observation
In the third week of October 2022, ten samples of rice panicles were collected from healthy plants after the grains had matured. During collection, the panicles were cut 1–2 inches below the flag leaf with a sharp scissor and photographed using a DSLR camera. The panicle samples were then taken to the laboratory for morphological analysis (Panda et al., Citation2020). The panicle length was measured from the base to the tip of the panicle using a scientific ruler. Further, panicle number per hill refers to the number of panicles produced by individual rice plants within a hill, with a hill representing a small cluster of closely grown rice plants. It is a measure of the reproductive capacity and tillering ability of the rice plants (Haque et al., Citation2006). Thus, the panicle number per hill was determined by counting the total number of panicles in the sample and hills and applying the formula (EquationEq. 1(1)
(1) ). The number of filled grains in each panicle was measured to determine Grains/panicle. In contrast, the number of unfilled grains was counted to analyze Chaffs/panicles for each accession. During collection, the angle between each sample’s flag leaf and panicle was measured using a protractor. The panicle’s weight was determined using a digital electronic weighing balance, while 1000 healthy grains from each accession were obtained to determine the test weight. Flag leaf area was calculated by measuring the length and width of the leaf sample and using the formula (EquationEq. 2
(2)
(2) ).
These formula EquationEq.1(1)
(1) & EquationEq. 2
(2)
(2) , were suggested and adopted by Gharib et al. (Citation2011) and Ahmad et al. (Citation2015) to calculate the panicle number per hill and leaf area, respectively.
2.5. Data analysis
The data collected from the field experiments was entered into Microsoft Excel (version 2019) for further analysis. Statistical analysis was carried out using software tools such as Palaeontological Statistics (PAST) software (Version 4.03) and R-Studio (Version 4.2.2). To analyze the panicle traits, R-Studio statistical software (with datasets and agricolae packages) was employed, utilizing analysis of variance (ANOVA). The objective of this analysis was to determine significant distinctions between the treatments, following the methodology outlined by Gomez and Gomez (Citation1984). In the case of significant differences, post-hoc tests such as Duncan’s Multiple Range test (DMRT) were performed at a significance level of p ≤ 0.05, to identify specific treatment effects. The genetic variability of panicle traits (Tiwari et al., Citation2019), principal component analysis (Kashyap & Yadav, Citation2020), the relationship between different panicle traits by multiple correlation analysis (Saleh et al., Citation2020), and cluster analysis of genotypes based on panicle traits (Iqbal et al., Citation2018) were performed. The genetic diversity of panicle traits was analysed using R-studio via the “variability” package. Cluster analysis was conducted using the Paired Bray-Curtis similarity in PAST software to determine the similarity index among various rice genotypes. Principal component analysis (PCA) was also performed on different traits to identify the underlying sources of variability using the “factoextra” packages in R-studio. Additionally, multiple correlation analyses were analysed using several R-studio packages, including readxl, ggplot2, dplyr, FSA, psych, and performance analytics to examine the relationship between various panicle traits. The collected data, results of the statistical analysis, and significant findings were organized and presented in tabular format using appropriate formatting tools in MS Word (2019 version).
3. Results
3.1. Morphological variation of panicle traits
The morphological variation of panicles of different rice accessions is shown in Table & Figure . The summary statistics of morphological variation of panicle traits of varying rice genotypes are shown in Table . The panicle length ranges from 23.52 to 30.02, with an average length of 26.72. The larger panicle length was observed in the NR2192-16-1-1-1-1 (30.02), whereas the lowest panicle length was observed in the Swarna Sub-1 (23.52). The panicle angle was found to be ranged from 32.66° to 40.33° with an average of 36.24°. The larger panicle angle was observed in the NR2187-33-1-2-1-1-1 (40.33), and a lower angle was observed in the IR106523-25-34-3-2-13-1-2 (32.66). The panicle weight ranges from 2.76 to 4.50, with a mean weight of 3.676 g. The highest panicle weight was found in SVIN123 (4.50 g), and the lowest was observed in IR14D134 (2.76 g). The test weight of different genotypes ranged from 17.58 to 33.41, with a mean weight of 23.20 g. The highest test weight was obtained in IR15L17315(33.41 g), and the lowest was obtained in the Jeera Masino (17.58 g) (Figure ). The panicle number ranges from 10.10 to 15, with the mean number of panicles being 11.89. The grains/panicle and chaffs/panicle range from 83.730 to 176.30 and 13.0 to 56.70, with mean of 119.97 and 24.47, respectively. The maximum number of grains/panicle and chaffs/panicle was observed in IR106523-25-34-3-2-13-1-2 (176.30) and NR2188-13-5-2-5-1 (56.70), respectively, and the minimum number of grains/panicle and chaffs/panicle was observed in IR14D134 (83.70) and NR2182-33-3-2-1-1-1 (13.0). The flag leaf area ranges from 18.23 to 46.82, with a mean of 32.54. The highest flag leaf area was observed in Radha-13 (46.82) and Swarna Sub-1 (18.23) (Figure ). Likewise, the variance and standard deviation were highest in grains/panicle, followed by chaffs/panicle and flag leaf area. The lowest variance and standard deviation were observed in panicle weight. The panicle length and flag leaf area are negatively skewed, whereas panicle angle, panicle weight, test weight, panicle number, grains/panicle, and chaffs/panicle show positive skewness. The kurtosis seems to be highest on chaffs/panicle (8.080), followed by flag leaf area (1.574) and test weight (1.086), whereas the lower kurtosis was observed in panicle angle (−1.10) (Table ). Further, the highest coefficient of variation was observed in panicle angle (19.362), followed by panicle weight (13.524), chaffs/panicle (13.292), flag leaf area (12.535), and panicle number (12.512). In contrast, the lowest coefficient of variation was found in panicle length (4.606). The F-value was observed to be highly significant (P < 0.001) on grains/panicle (12.68), chaffs/panicle (23.56), flag leaf area (6.95), panicle length (5.98) and test weight (16.09). In contrast, F-value was obtained significantly in panicle number (1.99) and panicle weight (2.47) at (P < 0.01) and (P < 0.05), respectively (Table ).
Figure 2. Morphological diversity of panicles in studied rice accessions.
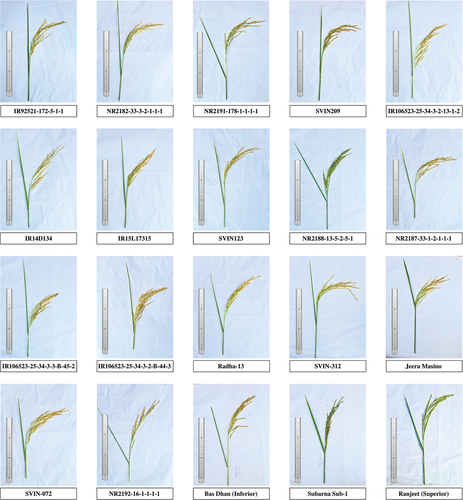
Figure 3. Comparing panicle architecture traits in rice accessions, top five and bottom five performers for each trait including (a)panicle length, (b)panicle angle, (c)panicle weight and (d)test weight.
Figure 4. Comparing panicle architecture traits in rice accessions, top five and bottom five performers for each trait including (e)panicle number, (f)grains/panicle, (g)chaffs/panicle and (h)flagleaf area.
Table 3. Evaluation of major panicle traits of various rice accessions tested under Eastern terai region of Nepal
Table 4. Statistical overview of panicle traits variation among investigated rice accessions
3.2. Genetic variability of panicle traits
The genetic variability parameters of different panicle traits are shown in Table . The phenotypic variance (σ2P) was higher than the genotypic variance (σ2G) for the entire trait. In contrast, the environmental variance (σ2E) is lower than the phenotypic trait for panicle length, panicle weight, test weight, grains/panicle, chaffs/panicle, and flag leaf area. All the variance was observed to be the highest for grains/panicle and the lowest for panicle length. The GCV and ECV are lower than PCV for all the panicle traits, and the ECV is lower than GCV for panicle length, test weight, grains/panicle chaffs/panicle, and flag leaf area. The ECV was observed higher in panicle angle (18.242) and panicle length (4.3174). The GCV, as well as PCV, was observed to be higher in chaffs/panicle (36.4760) and (38.7515) and lowest in panicle length (6.0082) and (7.3896), respectively. In various accessions, the range of broad-sense heritability (h2bs) varied from 0.242 (panicle number) to 0.886 (chaffs/panicle). The GAM value ranged from 7.22% to 70.72%, with chaffs/panicle exhibiting the highest GAM (70.72%), followed by grains/panicle (33.31%), test weight (30.90%), and flag leaf area (29.46%).
Table 5. Analysis of genetic variability parameters for panicle traits in rice accessions, including genotypic variation (σ2G), phenotypic variation (σ2P), environmental variance (σ2E), environmental coefficient of variation (ECV), genotypic coefficient of variation (GCV), phenotypic coefficient of variation (PCV), broad sense heritability (h2bs), genetic advance (GA), and genetic advance as percentage of the mean (GAM)
3.3. Principal component analysis
The study investigated variations in panicle traits among different paddy genotypes through principal component analysis (PCA) (Table ). The results revealed that three principal components (PC) had an Eigenvalue of more than one (Figure ). PC1 had the highest variation in flag leaf area (0.525), followed by panicle length (0.464) and panicle weight (0.426). PC2 had the highest positive loading of 0.618 in grains/panicle followed by panicle weight (0.310), and the highest negative loading of −0.633 was observed in panicle number, followed by test weight (−0.260). PC3 had the highest positive loading of 0.653 in test weight, followed by panicle weight (0.393). The biplot between PCA1 and PCA2 demonstrated distinct patterns among the different paddy genotypes regarding panicle traits (Figure ). The first two axes of PCA accounted for 59.8% of the total variation. Based on the PCA-biplot, five rice genotypes were grouped in the first quarter and effectively separated from others based on panicle weight and grains/panicle traits. Similarly, four rice genotypes were grouped in the second quarter based on panicle angle and chaffs/panicle traits. Five genotypes were grouped in the third quarter based on panicle number. Finally, six genotypes were grouped in the fourth quarter and effectively separated from others based on test weight, panicle length, and flag leaf area.
Figure 5. Scree plot of eigen values after principal component analysis (PCA).
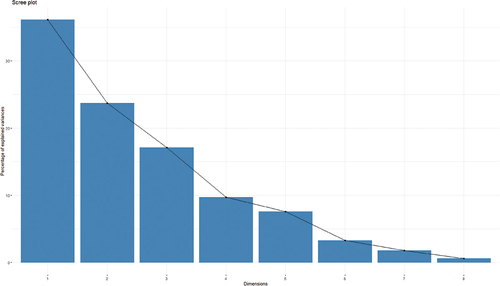
Figure 6. Principal component analysis (PCA) of studied rice accessions showing the genotypic relationship in a graphical representation (biplot) on the basis of different panicle traits.
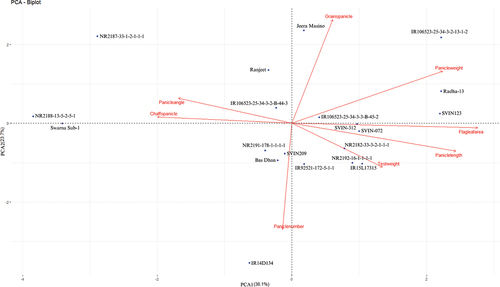
Table 6. Principal component analysis (PCA) of diverse morphological traits in investigated rice accessions
3.4. Relationship between different panicle traits
Figure illustrates the connection between different panicle traits in the analyzed rice accessions. The multiple correlation analysis results indicate a positive association between panicle length, grains/panicle, test weight, and panicle number. However, panicle length and angle showed a negative correlation. Panicle angle, on the other hand, showed a positive correlation with chaffs/panicle and test weight and a negative correlation with panicle number, grains/panicle, flag leaf area, and panicle weight. Additionally, flag leaf area had a positive correlation with grains/panicle, test weight, and panicle number. Furthermore, chaffs/panicle and test weight had a positive correlation with panicle number. According to Pearson’s correlation coefficient, panicle length had a significant positive correlation with panicle weight (r = 0.26*) and flag leaf area (r = 0.56***), but a significant negative correlation with chaffs/panicles (r = −0.40**). Similarly, panicle weight had a significant positive correlation with flag leaf area (r = 0.31*), grains/panicle (r = 0.31*), and test weight (r = 0.40**), but a negative correlation with chaffs/panicle (r = −0.26*). Flag leaf area had a significant negative correlation with chaffs/panicle (r = −0.37**), while grains/panicle had a significant negative correlation with test weight (r = −0.43***) and panicle number (r = −0.35**).
Figure 7. Relationship of different panicle traits in studied rice accessions by multiple correlation analysis [*Significant at 5% level of significance, **Significant at 1% level of significance, ***Significant at 0.1% level of significance, ▪Significant at 10% level of significance].
![Figure 7. Relationship of different panicle traits in studied rice accessions by multiple correlation analysis [*Significant at 5% level of significance, **Significant at 1% level of significance, ***Significant at 0.1% level of significance, ▪Significant at 10% level of significance].](/cms/asset/f6060945-3efe-496f-b0cf-fd8697b3b8d9/oafa_a_2238420_f0007_oc.jpg)
3.5. Cluster analysis of accessions based on panicle traits
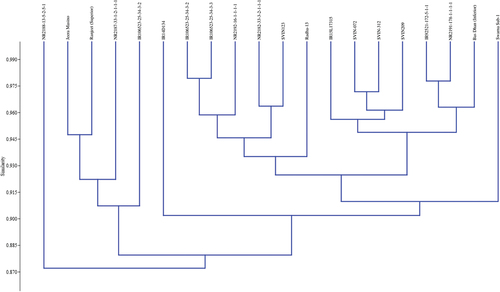
Bray-Curtis Similarly Index was used to analyze the relationship among 20 rice genotypes in our experiment, shown in Figure . The cluster analysis presented the rice genotypes into two major groups, each with several subgroups based on the study of variation in valuable panicle traits. The largest cluster accounted for 19 accessions, with a similarity index of 88% among them. Apart from this, a cluster of 19 accessions is found to hold a similarity of 87% with another cluster containing only one genotype, i.e., NR2188-13-5-2-5-1. The sub-cluster of cultivated varieties of “Jeera Masino” and “Ranjeet” have shown a similarity of about 95%. The rice genotypes such as “IR92521-172-5-1-1” and “NR2191-178-1-1-1-1” are present with “Basdhan” (inferior variety) in a small cluster with a similarity of 96%. Similarly, the genotypes IR106523-25-34-3-2 and IR106523-25-34-3-3 are very close, with 98% similarity.
Figure 8. Dendrogram illustrating the similarity index among various rice accessions based on diverse panicle traits.
4. Discussions
4.1. Morphological variation of panicle traits
The panicle architecture, such as panicle structure, size, and panicle number, are major components that determine rice yield rice (Panda et al., Citation2020). Similar to that of Panda et al. (Citation2020), genotypes such as NR2192-16-1-1-1-1, and SVIN123 resulted in superior panicle lengths than that of the other varieties. Our results indicate an opposite relationship between the panicle length and angle, which is supported by the finding of Yan et al. (Citation2007). Furthermore, Yan et al. (Citation2007) demonstrated that the panicle length lies between 22 and 35 centimeters, whereas this experiment reported that the panicle length lies between 23 and 30; these differences might be due to the difference in the cultivation area or varieties. The observations done by Ikeda et al. (Citation2010), on grain numbers aligns with the present findings. The present findings show that the chaffs/panicle and test weight lie between 13–32 and 17–29, which is supported by Reza et al. (Citation2022). Reza et al. (Citation2022) has reported chaffs/panicle and test weight in 12–31 and 20–27, respectively. The finding shows that the panicle numbers do not significantly affect the panicle weight, which coincides with Panda et al. (Citation2020). Max and min test weight observed in this experiment is supported by Lei et al. (Citation2018). The present findings are associated with decreased quantities of chaff per panicle and increased flag leaf area, suggesting a positive correlation between flag leaf area and panicle numbers, which is consistent with the findings of Panda et al. (Citation2020). Unlike Venkatesan et al. (Citation2019), this finding does not show a direct and positive correlation with test weight and grain yield per plant. The test weight obtained in the genotypic trail of performed by D. Gautam et al. (Citation2018), is higher and has the lowest difference between genotypes than that of the above finding. Similarly, Anis et al. (Citation2017) has also observed panicle per plant, which is higher than the above experimental finding might be due to differences in genotype and location of cultivation.
4.2. Genetic variability of panicle traits
Analysis of genetic variability includes panicle length, panicle angle, test weight, panicle weight, grains/panicle, chaffs/panicle, and flag leaf area; these data represent moderate PCV and GCV values in this experiment. Obtained GCV was lower than PCV, and their differences were also low for the studied panicle traits, i.e., environmental factors, less influenced traits, and genetic effects are more prevalent for phenotypic expression of panicle traits was already reported in Sahu et al. (Citation2017). Both PCV and GCV are high for chaffs/panicle, moderate for test weight, grains/panicle, flag leaf area, and lower for panicle length and panicle number, whereas Bhandari et al. (Citation2019) reported high PCV and GCV for test weight and low for fertility percentage these differences might be due to difference in varieties, site of experimental plot, or genetic character of the plant. Like that of Lamichhane et al. (Citation2021), this experiment also resulted in different magnitudes of PCV and GCV for different traits and grains/panicles showed higher heritability linked with higher genetic advance. The value of heritability (h2bs) was observed higher for test weight, grains/panicle, and chaffs/panicle. Jiban et al. (Citation2021) also observed high heritability for test weight and grain yield, and the value range also seems to be at a similar range. The influence of the environment on different traits can be detected by analyzing the heritability of the traits, which helps the plant breeder during the improvement of the genetic characteristics of the plant (Sahu et al., Citation2017). The genetic variability of the plant is associated with its panicle characteristics, which are further utilized during breeding purposes and understanding the richness of available germplasm (Lei et al., Citation2018).
4.3. Principle components analysis
Principal component analysis (PCA) can be used to find patterns in data sets and eliminate redundant information (Maji et al., Citation2012). The principal components of the traits are analyzed to identify the traits responsible for maximum variability (Anis et al., Citation2017). The results performed by Anis et al. (Citation2017), indicate that traits such as grain per panicle, test weight, chaffs per panicle, panicle length, and panicle numbers are the primary principal components responsible for variability. The findings of the present study also coincide with the responsible traits. The major components in PC1 are the Flag leaf area, and in PC2 are grains/panicle and panicle weight; most of the variation was observed due to the PC1 and PC2; this finding is supported by Anis et al. (Citation2017). According to the screen plot graph below, PC1 expresses the greatest variation compared to eight principle components, whereas PC1, PC2, and PC3 show the greatest variation as the eigenvalue is more than one, which shows similarity with the result obtained by Gour et al. (Citation2017). PC1 shows the highest variability with a 0.3613 proportion of variance and eigenvalue 2.8905, which shows the gradual decline in value with an increase in PC numbers similar to that of Gour et al. (Citation2017). Nachimuthu et al. (Citation2014) reported that grain quality, such as weight, volume, or length, is one of the most important agronomic traits showing greater variability in this study; grain/panicle, chaffs/panicle, and test weight has highly contributed towards variation.
4.4. Relationship between different panicle traits
The multiple correlation analysis shows the relationship between panicle weight and leaf area, grain per panicle, test weight, and chaffs per panicle, as reported in Panda et al. (Citation2020). The results of our study indicate that panicle length is positively correlated with both flag leaf area and panicle weight but negatively correlated with chaffs per panicle. These findings are consistent with the results reported in a previous study by Maji et al. (Citation2012). Our results also show a negative relationship between leaf area and chaff per panicle, which agrees with Maji et al. (Citation2012). Akter et al. (Citation2018) also reports a negative relationship between test weight and grain weight, similar to our findings of a relationship between grain per panicle, test weight, and panicle length. These results suggest that leaf area has a positive relationship with grain yield, with higher leaf area resulting in higher grain yield and vice versa, a finding supported by Bhandari et al. (Citation2019). Our results regarding the relationship between grain per panicle, test weight, and panicle length are consistent with Venkatesan et al. (Citation2019), but differ from the relationship reported between test weight and grain weight.
4.5. Cluster analysis of accessions based on panicle traits
The present study conducted a cluster analysis on the studied rice accessions, identifying two major clusters, with the larger cluster comprising 19 accessions and a similarity index of 88% among them. This clustering may be due to shared genetic characteristics or similar ecotypes (Anis et al., Citation2017; Maji et al., Citation2012; Panda et al., Citation2020). Similar to the results obtained by Lei et al. (Citation2018), our findings also revealed higher similarity between two genotypes, specifically IR92521-172-5-1-1 and NR2191-178-1-1-1-1 (97.87%), as well as a local variety, Bas Dhan (96.37%). Additionally, our study identified a cluster of two genotypes with the highest similarity of 98%, namely IR106523-25-34-3-2 and IR106523-25-34-3-3, which is consistent with the results observed by Sathish and Senapati (Citation2017). These findings suggest that genetic and ecological factors influence the clustering of rice accessions and may have important implications for rice breeding and conservation programs.
5. Conclusion
Our study demonstrates substantial variability for different panicle traits among the studied rice accessions. Panicle length, flag leaf area, and panicle weight were identified as the key determinants of phenotypic diversity among the rice accessions. Some rice accessions, including SVIN123, IR106523-25-34-3-2-13-1-2, Radha-13, and IR15L17315, exhibited superior panicle weight and higher grains/panicle and panicle length, making them promising candidates for future rice breeding programs. Furthermore, our findings suggest that panicle weight is primarily regulated by panicle length, flag leaf area, grains/panicle, and test weight rather than panicle number, panicle angle, or chaffs/panicle. Among the studied traits, grains/panicle chaff/panicle, flag leaf area, panicle weight, and test weight are valuable for breeding and can be used for direct selection in crop improvement. However, further assessment of genetic diversity in terms of molecular markers is necessary for utilizing these genotypes in rice breeding programs.
Acknowledgments
We would like to sincerely thank Girija Prasad Koirala College of Agriculture and Research Centre (GPCAR) for their invaluable support in providing necessary supplies and learning platforms. Their contribution was instrumental in the successful completion of our study.
Disclosure statement
No potential conflict of interest was reported by the author(s).
Data availability statement
Data included in article/supplement material/referenced in the article. https://drive.google.com/file/d/1A2e12TV6JedCicfl2dcHL4XkeNnuh376/view?usp=sharing
Additional information
Funding
Notes on contributors

Shubh Pravat Singh Yadav
Shubh Pravat Singh Yadav is an agricultural research scholar and author affiliated with G.P. Koirala College of Agriculture and Research Centre (GPCAR), PU, Nepal. He specializes in various subjects within the field of agriculture, including plant breeding, invasive pests, sustainable agriculture, agronomy, consumer preferences, horticulture, and more. He has conducted research, written reviews, and contributed to several projects in these areas.
Dipesh Kumar Mehata
Dipesh Kumar Mehata, Susmita Bhattarai, Sujan Bhandari, Netra Prasad Ghimire, Soni Kumari Majhi, and Pratima Chaudhary are affiliated with G.P. Koirala College of Agriculture and Research Centre (GPCAR), PU, Nepal. They are esteemed researchers who have contributed to the advancement of agricultural sciences.
Susmita Bhattarai
Dipesh Kumar Mehata, Susmita Bhattarai, Sujan Bhandari, Netra Prasad Ghimire, Soni Kumari Majhi, and Pratima Chaudhary are affiliated with G.P. Koirala College of Agriculture and Research Centre (GPCAR), PU, Nepal. They are esteemed researchers who have contributed to the advancement of agricultural sciences.
Sangita Bhujel is an Assistant Professor at G.P. Koirala College of Agriculture and Research Centre (GPCAR), PU, Nepal. She is dedicated to the field of plant breeding.
Sujan Bhandari
Dipesh Kumar Mehata, Susmita Bhattarai, Sujan Bhandari, Netra Prasad Ghimire, Soni Kumari Majhi, and Pratima Chaudhary are affiliated with G.P. Koirala College of Agriculture and Research Centre (GPCAR), PU, Nepal. They are esteemed researchers who have contributed to the advancement of agricultural sciences.
Sangita Bhujel is an Assistant Professor at G.P. Koirala College of Agriculture and Research Centre (GPCAR), PU, Nepal. She is dedicated to the field of plant breeding.
Netra Prasad Ghimire
Dipesh Kumar Mehata, Susmita Bhattarai, Sujan Bhandari, Netra Prasad Ghimire, Soni Kumari Majhi, and Pratima Chaudhary are affiliated with G.P. Koirala College of Agriculture and Research Centre (GPCAR), PU, Nepal. They are esteemed researchers who have contributed to the advancement of agricultural sciences.
Sangita Bhujel is an Assistant Professor at G.P. Koirala College of Agriculture and Research Centre (GPCAR), PU, Nepal. She is dedicated to the field of plant breeding.
Soni Kumari Majhi
Dipesh Kumar Mehata, Susmita Bhattarai, Sujan Bhandari, Netra Prasad Ghimire, Soni Kumari Majhi, and Pratima Chaudhary are affiliated with G.P. Koirala College of Agriculture and Research Centre (GPCAR), PU, Nepal. They are esteemed researchers who have contributed to the advancement of agricultural sciences.
Sangita Bhujel is an Assistant Professor at G.P. Koirala College of Agriculture and Research Centre (GPCAR), PU, Nepal. She is dedicated to the field of plant breeding.
Pratima Chaudhary
Dipesh Kumar Mehata, Susmita Bhattarai, Sujan Bhandari, Netra Prasad Ghimire, Soni Kumari Majhi, and Pratima Chaudhary are affiliated with G.P. Koirala College of Agriculture and Research Centre (GPCAR), PU, Nepal. They are esteemed researchers who have contributed to the advancement of agricultural sciences.
Sangita Bhujel is an Assistant Professor at G.P. Koirala College of Agriculture and Research Centre (GPCAR), PU, Nepal. She is dedicated to the field of plant breeding.
Sangita Bhujel
Sangita Bhujel is an Assistant Professor at G.P. Koirala College of Agriculture and Research Centre (GPCAR), PU, Nepal. She is dedicated to the field of plant breeding.
References
- Ahmad, S., Ali, H., Ur Rehman, A., Khan, R. J. Z., Ahmad, W., Fatima, Z., Abbas, G., Irfan, M., Ali, H., Khan, M. A., & Hasanuzzaman, M. (2015). Measuring leaf area of winter cereals by different techniques: A comparison. Pakistan Journal of Life and Social Sciences, 13(2), 117–20.
- Akter, N., Khalequzzaman, M., Islam, M., Mamun, M., & Chowdhury, M. (2018). Genetic variability and character association of quantitative traits in jhum rice genotypes. SAARC Journal of Agriculture, 16(1), 193–203. https://doi.org/10.3329/sja.v16i1.37434
- Anis, G. B., Hassan, H. M., Mazal, T. M., & Elgamal, W. H. (2017). Development and characterization of new integrated lines for use in two-way inbred and hybrid rice. International Journal of Agricultural and Environmental Sciences, 2(2), 15–24.
- Bai, S., Hong, J., Li, L., Su, S., Li, Z., Wang, W., Zhang, F., Liang, W., & Zhang, D. (2021). Dissection of the genetic basis of rice panicle architecture using a genome-wide association study. Rice, 14(1). https://doi.org/10.1186/s12284-021-00520-w
- Bhandari, K., Poudel, A., Sharma, S., Kandel, B. P., & Upadhyay, K. (2019). Genetic variability, correlation and path analysis of rice genotypes in rainfed condition at Lamjung, Nepal. Russian Journal of Agricultural & Socio-Economic Sciences, 92(8), 274–280. https://doi.org/10.18551/rjoas.2019-08.30
- Choudhary, D., Banskota, K., Khanal, N. P., McDonald, A. J., Krupnik, T. J., & Erenstein, O. (2022). Rice subsector development and farmer efficiency in Nepal: Implications for further transformation and food security. Frontiers in Sustainable Food Systems, 5, 740546. https://doi.org/10.3389/fsufs.2021.740546
- FAO. (2022). GIEWS - Global Information and Early Warning System, Country brief: Nepal. Retrieved May 6, 2022: Food and Agriculture Organization(FAO) https://www.fao.org/giews/countrybrief/country.jsp?code=NPL&lang=en
- FAOSTAT. (2019). Food and agriculture organization of the United Nations Information sheet on rice. Rome, URL: http://faostat.fao.org.
- Gautam, D., Kandel, B. P., & Adhikari, B. B. (2018). Performance of rice genotypes in western mid hill of Nepal. Journal of Plant Breeding and Genetics, 6(3), 111–116. https://doi.org/10.33687/pbg.006.03.2791
- Gautam, A., & Shrestha, A. (2023). Evaluation of panicle architecture traits in rice genotypes using PTRAP. Nepal Agriculture Research Journal, 15(1), 115–124. https://doi.org/10.3126/narj.v15i1.51533
- Gharib, H. S., Metwally, T. F., Naeem, S. S., & Gewaily, E. E. (2011). Influence of some stimulating compounds and nitrogen fertilizer levels on growth and yield of hybrid rice. Zagazig Journal Agricultural Resources, 38(1), 2011.
- Gomez, K. A., & Gomez, A. A. (1984). Statistical procedures for agricultural research (Vol. 6, 2nd ed.). John Wiley & Sons, Ltd.
- Gour, L., Maurya, S., Koutu, G. K., Singh, S. K., Shukla, S., & Mishra, D. (2017). Characterization of rice (Oryza sativa L.) genotypes using principal component analysis including scree plot & rotated component matrix. International Journal of Chemical Studies, 5(4), 975–983.
- Haque, K. M. S., Khaliq, K. A., Aktar, J., & Shamsuddula, A. M. (2006). Yielding ability of aromatic rice under stacking and non-stacking conditions with different nitrogen fertilization. International Journal Sustains Crop Production, 1(1), 01–05.
- Ikeda, M., Hirose, Y., Takashi, T., Shibata, Y., Yamamura, T., Komura, T., Doi, K., Ashikari, M., Matsuoka, M., & Kitano, H. (2010). Analysis of rice panicle traits and detection of QTLs using an image analyzing method. Breeding Science, 60(1), 55–64. https://doi.org/10.1270/jsbbs.60.55
- Iqbal, T., Nazir Ahmad, I. H., Muhammad Zia, M. N. M. A. S. S., & Ali, F. (2018). Genetic variability, correlation and cluster analysis in elite lines of rice. Journal of Scientific Agriculture, 2, 85. https://doi.org/10.25081/jsa.2018.v2.900
- Jiban, S., Subash, S., Naba, R. S., Sudeep, S., Ujjawal, K. S., Bidhya, M., & Mahesh, S. (2021). Assessment of variability, heritability and correlation in rice (Oryza Sativa L.) Genotypes. Natural Resources and Sustainable Development, 11(2), 181–192. https://doi.org/10.31924/nrsd.v11i2.077
- Kashyap, A., & Yadav, V. K. (2020). Principal component analysis and character association for yield components in rice (Oryza sativa L.) genotypes of salt tolerance under alkaline condition. International Journal of Current Microbiology and Applied Sciences, 9(10), 481–495. https://doi.org/10.20546/ijcmas.2020.910.059
- Lamichhane, S., Adhikari, N. R., Bishwas, K. C., & Thapa, S. (2021). Estimating variability, heritability, and genetic advance of rice genotypes in Mid-Hills of Nepal. Indonesian Journal of Agricultural Science, 22(2), 92–101. https://doi.org/10.21082/IJAS.V22N2.2021.P92-101
- Lei, Q., Zhou, J., Zhang, W., Luo, J., Wu, K., & Long, C. (2018). Morphological diversity of panicle traits in Kam fragrant glutinous rice (Oryza sativa). Genetic Resources and Crop Evolution, 65(3), 775–786. https://doi.org/10.1007/s10722-017-0570-9
- Li, G., Zhang, H., Li, J., Zhang, Z., & Li, Z. (2021). Genetic control of panicle architecture in rice. The Crop Journal, 9(3), 590–597. https://doi.org/10.1016/j.cj.2021.02.004
- Lu, H., Dai, Z., Li, L., Wang, J., Miao, X., & Shi, Z. (2017). Osramosa2 shapes panicle architecture through regulating pedicel length. Frontiers in Plant Science, 8(September), 1–11. https://doi.org/10.3389/fpls.2017.01538
- Maji, A. T., Shaibu, A. A., & Cereals, N. (2012). Application of principal component analysis for rice germplasm characterization and evaluation. Journal of Plant Breeding and Crop Science, 4(6), 87–93. https://doi.org/10.5897/JPBCS11.093
- Mishra, R., Zheng, W., Joshi, R. K., & Kaijun, Z. (2021). Genome editing strategies towards enhancement of rice disease resistance. Rice Science, 28(2), 133–145. https://doi.org/10.1016/j.rsci.2021.01.003
- MOALD. (2019). Statistical information on nepalese agriculture. Singha Durbar.
- Nachimuthu, V. V., Robin, S., Sudhakar, D., Raveendran, M., Rajeswari, S., & Manonmani, S. (2014). Evaluation of rice genetic diversity and variability in a population panel by principal component analysis. Indian Journal of Science and Technology, 7(10), 1555–1562. https://doi.org/10.17485/ijst/2014/v7i10.14
- Panda, D., Sahu, N., Behera, P. K., & Lenka, K. (2020). Genetic variability of panicle architecture in indigenous rice landraces of Koraput region of Eastern Ghats of India for crop improvement. Physiology & Molecular Biology of Plants, 26(10), 1961–1971. https://doi.org/10.1007/s12298-020-00871-6
- Pk, M. (2013). A physiological approach to design rice panicle architecture in the quest for high grain yield. In Muralidharan, K. & Siddiq, E. A. (Eds.), International Dialogue on Perception and Prospects of Designer Rice, Chandler (pp. 131–142).
- Prakash, H. P., Rawte, S., Saxena, R. R., Verulkar, S. B., & Saxena, R. R. (2022). Electronic journal of plant breeding 122 RILs using P-TRAP software for spikelet related traits. Electronic Journal of Plant Breeding, 13(4), 1226–1233. https://doi.org/10.37992/2022.1304.167
- Reza, M. S., Ahmed, B., Alim, S. M. A., Islam, M. M., Hoque, M. M., & Nadim, M. K. A. (2022). Morphological characterization and adaptive trail of two prominent T. Aman Rice (Oryza sativa L.) lines under different locations of Bangladesh. Asian Journal of Environment & Ecology, 19(4), 1–8. https://doi.org/10.9734/ajee/2022/v19i4414
- Sahu, P. K., Sharma, D., Mondal, S., Kumar, V., Singh, S., Baghel, S., Tiwari, A., Vishwakarma, G., & Das, B. K. (2017). Genetic variability for grain quality traits in indigenous rice landraces of Chhattisgarh India. Journal of Experimental Biology and Agricultural Sciences, 5(4), 439–455. https://doi.org/10.18006/2017.5(4).439.455
- Saito, H., Orn, C., Thub, V., Ouk, M., Tomita, A., Sasaki, K., Obara, M., Kobayashi, N., & Fukuta, Y. (2023). Diversity of traits related to panicle architecture and grain size in cambodian rice germplasm and newly developed mini-core collection. Japan Agricultural Research Quarterly: JARQ, 57(1), 21–35. https://doi.org/10.6090/jarq.57.21
- Saleh, M. M., Salem, K. F. M., & Elabd, A. B. (2020). Definition of selection criterion using correlation and path coefficient analysis in rice (Oryza sativa L.) genotypes. Bulletin of the National Research Centre, 44(1). https://doi.org/10.1186/s42269-020-00403-y
- Sathish, V., & Senapati, B. K. (2017). Study of genetic diversity in some newly developed rice genotypes. International Journal of Current Microbiology and Applied Sciences, 6(10), 2693–2698. https://doi.org/10.20546/ijcmas.2017.610.317
- Tiwari, D. N., Tripathi, S. R., Tripathi, M. P., Khatri, N., & Bastola, B. R. (2019). Genetic variability and correlation coefficients of major traits in early maturing rice under rainfed lowland environments of Nepal. Advances in Agriculture, 2019, 1–9. https://doi.org/10.1155/2019/5975901
- Venkatesan, M., Karthikeyan, P., & Thilagavathi, T. (2019). Component analysis for grain yield in rice (oryza sativa l.) under natural saline condition. Plant Archives, 19(1), 1023–1026. http://plantarchives.org/PDF%20SUPPLEMENT%202019/168__1023-1026_.pdf
- Yan, C. J., Zhou, J. H., Yan, S., Chen, F., Yeboah, M., Tang, S. Z., Liang, G. H., & Gu, M. H. (2007). Identification and characterization of a major QTL responsible for erect panicle trait in japonica rice (Oryza sativa L.). Theoretical and Applied Genetics, 115(8), 1093–1100. https://doi.org/10.1007/s00122-007-0635-9
- Zhi, H., He, Q., Tang, S., Yang, J., Zhang, W., Liu, H., Jia, Y., Jia, G., Zhang, A., Li, Y., Guo, E., Gao, M., Li, S., Li, J., Qin, N., Zhu, C., Ma, C., Zhang, H., Chen, G., & Liu, J.… Diao, X. (2021). Genetic control and phenotypic characterization of panicle architecture and grain yield-related traits in foxtail millet (Setaria italica). Theoretical and Applied Genetics, 134(9), 3023–3036. https://doi.org/10.21203/rs.3.rs-159458/v1
- Zhong, H., Liu, C., Kong, W., Zhang, Y., Zhao, G., Sun, T., & Li, Y. (2019). Effect of multi-allele combination on rice grain size based on prediction of regression equation model. Molecular Genetics and Genomics, 295(2), 465–474. https://doi.org/10.1007/s00438-019-01627-y
- Zhong, H., Liu, S., Meng, X., Sun, T., Deng, Y., Kong, W., Peng, Z., & Li, Y. (2021). Uncovering the genetic mechanisms regulating panicle architecture in rice with GPWAS and GWAS. BMC Genomics, 22(1), 1–13. https://doi.org/10.1186/s12864-021-07391-x