
 ?Mathematical formulae have been encoded as MathML and are displayed in this HTML version using MathJax in order to improve their display. Uncheck the box to turn MathJax off. This feature requires Javascript. Click on a formula to zoom.
Abstract
A total land suitability analysis was carried out through FuzzyAHP technique for rice and potato crops in West Bengal, India. Around 21 most relevant crop suitability parameters were selected and classified under five primary criteria, such as terrain distribution parameter, static soil parameter, available soil nutrient, agriculture practice parameter, and local variation parameter for the study. The factors such as NDVI and SAVI values were estimated from Sentinel 2B images in “SNAP” toolbox software environment, whereas soil nutrients were estimated through standard laboratory methods. Individual parameter weights were assigned through the FuzzyAHP technique for sub-criteria as well as for primary criteria. The final crop suitability map was developed showing nearly 20% of the total area as highly suitable for rice crop, whereas nearly 39% of the area was found suitable for the potato crop. Comparing the prediction map with yield distribution, it was found that the southwest region of the study area is very suitable for both rice and potato crop with higher crop yields in the range of 5 t/ha and 20 t/ha, respectively. Six different machine learning models, namely random forest, support vector machine, AdaBoost, extreme gradient boosting, logistic regression, and naïve Bayes, were utilized for validation of the suitability maps. The support vector machine (SVM) learning model with the highest AUC (~80%) was found efficient for testing both rice and potato crop suitability. The economic status of farmers can be rejuvenated by selecting the best crop rotation through land suitability analysis.
1. Introduction
Agriculture, having a contribution of 17% of the Indian GDP, plays very important roles in ensuring food security and stabilizing rural economy of the country. Population explosion, urbanization, industrialization, and climate change could negatively impact the natural resources and crop production (Jain et al., Citation2020; López-Blanco et al., Citation2018). It is also widely believed to attend the food security through the development of sustainable agriculture. Land suitability analysis (LSA) can help to update the decisions that are made concerning the practice of rural land (Khan et al., Citation2022; Park et al., Citation2011). LSA stabilizes the soil ecological and biophysical mechanism and improves land productivity (Everest et al., Citation2021; Gyekye et al., Citation2021; Mugiyo et al., Citation2021). In developing countries, rice has been a staple food along with what. Nearly, 90% of the world’s rice production comes from wetlands in Asia. India is the second-largest producer of the rice in the world and also the largest rice exporter. From FY 1980 to FY 2020, the production of rice has increased from 53.6 million tons to 120 million tons (Agricoop India, Citation2020). On the other hand, potato is consumed and cultivated all over the world. Leading states producing potato in India are Uttar Pradesh, West Bengal, Bihar, etc., where potato is grown in the winter season.
The AHP is designed to provide a comprehensive analysis of the various factors that affects the decision-making process for choosing the best farming practices (Özkan et al., Citation2020; Rodcha et al., Citation2019). The AHP is a pair-wise comparison method that is utilized to estimate the overall weight of each of the selected criterion or element. Integration of the AHP and GIS techniques assists in decision-making by creation of suitability maps (Das et al., Citation2017; Eastman et al., Citation1995). Perveen et al. (Citation2008) used AHP with GIS for land suitability evaluation of wheat-cultivated irrigated fields in Haripur Upazila, Bangladesh considering relevant biophysical variables such as soil texture, soil moisture, soil drainage, soil depth, soil pH, soil organic matter, slope, land type, and supplementary water resources (Pandey et al., Citation2011). Shaloo Singh et al. (Citation2022) used the GIS-AHP method with multiple geo-environmental factors in assisting the cereal crops’ suitability study in Haryana, India. Amini et al. (Citation2019) implemented the ensemble fuzzy-AHP-GIS technique for rice suitability evaluation in Iran. The topographical, climatological and soil factors are the most important input parameters for a building GIS-AHP-fuzzy set model for crop suitability mapping (Dengiz, Citation2019; Everest & Gür, Citation2022; Jamil et al., Citation2018; Kahsay et al., Citation2018; Mandal et al., Citation2020; Pilevar et al., Citation2020; Singha et al., Citation2020; Tashayo et al., Citation2020). Debesa et al. (Citation2020) demonstrated the elevation, rainfall, and temperature are the most influential factors that affect the area’s potential to yield high-quality cereals-based physical land suitability analysis in South-West Ethiopia. They are utilized a multi-criteria evaluation technique and a GIS-RS-based approach to evaluate the land suitability of the various crops (wheat, teff, maize, and barley) in the study region. The results of the evaluation revealed that the total area which includes 20.34% is highly suitable for all types of cereals. In another study, the GIS-based Multi-criteria system revealed that from the total area, 0.51% and 77.42% are highly suitable and moderately suitable for both barley and wheat crops in Ethiopia region (Yohannes & Soromessa, Citation2018). In this study, temperature, erosion hazard, soil texture, and depth were identified as limiting factors for crop land suitability analysis.
Sarkar et al. (Citation2022) utilized the weightage of the 18 criteria through the FuzzyAHP method for identified the areas that are suitable for paddy cultivation in West Bengal, India. The results of the evaluation revealed that 14.54% and 46.07% of the study region have the potential to highly suitable and moderately suitable for paddy suitability. The AUC value (86%) of the FuzzyAHP method is a confirmation of its reliability in LSA.
Integrated RS-GIS-AHP technique estimates land suitability for potato crop in Amazonas region with the help of various socioeconomic and biophysical input factors (Trigoso et al., Citation2020). The Saaty’s AHP coupled with the GIS-RS has been extensively used in potato land suitability study (Keshavarzi et al., Citation2020). Trapezoidal FuzzyAHP method integrated with GIS accomplished nearly 90.16% accuracy for cash crop suitability mapping in Thailand (Rodcha et al., Citation2019; Singha & Swain, Citation2016). The increasing status of level of farm mechanizations has been a vital factor for higher crop output and better profit margin from a farm. The major factors for better farm mechanization include the availability of credit, the farmer’s experience, and the government’s support services (Ghosh, Citation2010). Farm mechanization can also assist in optimizing the use of natural resources required for growing crops in the farm (Seyedmohammadi et al., Citation2019). The decision to adopt a farm practice management system can also be influenced by various factors of status of farm mechanization, such as the farmer’s household characteristics, farm biophysical characteristics, and financial and local management factors (Baumgart-Getz et al., Citation2012). One of the most widely used techniques in agriculture science is multi-criteria-based decision making, which involves in using an ensemble Geographic Information System (GIS), Remote Sensing (RS), and a computer to perform LSA (Kumar et al., Citation2020). Various literature described remote sensing techniques successfully used to monitor crop yield, soil nutrient status, soil moisture, crop health, and cropland use management (Magri et al., Citation2005; Pasqualotto et al., Citation2019). Fine spatiotemporal Sentinel data have greater potentiality for crop phenology, moisture stress, yield estimation, and cropland acreage at the field level (Ali & Aboelghar, Citation2019; Son et al., Citation2020). Baroudy et al. (Citation2020) designed a novel method for land suitability based on soil quality indicators and Sentinel-2 RS derived NDVI data, to evaluate the rice suitability map in Nile Delta. GIS along with RS can easily compute the soil scheme-based LSA for low land rice in Ghana region. The artificial intelligence-based architecture has better accuracy compared to a traditional statistical algorithm for crop yield prediction on a local to global scale, in recent times (Radočaj & Jurišić, Citation2022; Whitmire et al., Citation2021). Various reviews showed that crop LSA concerning with many multicriteria evaluation techniques, i.e., order performance by similarity to ideal solution (AHP, Rashidi & Sharifian, Citation2022) (TOPSIS, Bagherzadeh & Gholizadeh, Citation2016), analytical network process (ANP, Mohammadi et al., Citation2015), maximum entropy (MaxEnt, Estes et al., Citation2013), simple additive weighting (SAW, Seyedmohammadi et al., Citation2018), artificial neural network (ANN, Jiao & Liu, Citation2007; Pourkhabbaz et al., Citation2014), criteria important through inter-criteria correlation (CRITIC, Mishra et al., Citation2021), genetic algorithm methods (Hamzeh et al., Citation2016), adaptive neuro-fuzzy inference system (ANFIS, Houshyar et al., Citation2017), and hybrid neural-fuzzy model (Dang et al., Citation2019), was used for socio-ecological development at individual farm level. Multi-criteria evaluation technique along with machine learning can work as a great tool for LSA (Suruliandi et al., Citation2021). The FuzzyAHP technique will act as guideline for estimating overall suitability of land for particular crops as all possible parameters were included in the study.
The current study proposed the alternative FuzzyAHP models to support farmers’ adoption of suitable farm management practice among smallholder rice and potato producers in Hooghly, West Bengal, India. The total land suitability scheme integrates the GIS-RS-FuzzyAHP weightage technique and field yield data to evaluate LSA for rice and potato crops, utilizing topographical, soil, climatic, and socio-economic parameters.
2. Materials and methods
2.1. Field description
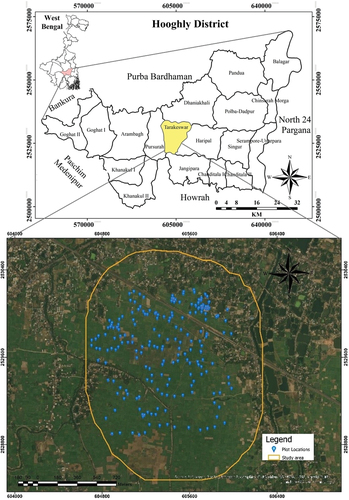
The study was accomplished for Gangetic-alluvial plain in the southern part of West Bengal at Tarakeswar Block, Hooghly district, West Bengal, India, covering approximately 300 ha. The study area is bounded by the coordinates 2,528,500 to 2,530,600 N-latitude and 604,500 to 606,500 E-longitude (45 Zone in UTM m WGS84,) and at the altitude of 40 m above mean sea level (Figure ). The study area is come under tropical monsoon type climate. The seasonal mean temperature fluctuates between 15°C and 29°C, and annual rainfall is 1200 mm and 1700 mm. There are two main soil groups in the area, namely loamy type (48%) and sandy loam (32%), which reaps high productivity from rice and potato crops (IRRI, Citation1985). Additionally, the study area has some imitating factors, such as acidic soil, low organic carbon, and high electrical conductivity (Rado et al., Citation2020; Singha & Swain, Citation2022). So, intensive LSA study is required for long-term sustainability of agricultural crop growth and management in the study area.
Figure 1. Study area location.
2.2. Selection of evaluation criteria
According to FAO guidelines and the expert’s opinion on decision-making for rice and potato cultivation, five main criteria were selected composed of 21 sub-criteria. The five main classes are I) terrain distribution parameters (TD): normalized vegetation index (NDVI), saturated vegetation index (SAVI), temperature, precipitation, slope, and elevation, II) static soil nutrients parameters (SP): soil texture (ST), soil pH, organic carbon (OC), and electrical conductivity (EC), III) available soil nutrient parameters (AS): available potassium (K), available nitrogen (N), available phosphorus (P), and available zinc (Zn), IV) agricultural practice parameters (AP): seed rate, mechanization level, irrigation frequency, and pesticide rate, and) local variation parameter (LV): farmer financial status, pest affected, source of irrigation, and use of FYM. These parameters were selected based on previous literature as well as their importance on growing the crops, such as rice and potato.
2.3. Soil sampling and laboratory analysis
Soil surveys were conducted in the study area from 2019 to 2020 after harvesting of the crops. Direct field information was collected through questionnaire followed by soil sample collection at different locations to obtain plot level readings. Soil samples were collected at a depth of 0–30 centimeters (Soil Survey Staff, Citation1993) based on expected root zone depth. The location information of the soil samples was also recorded using a handheld GPS receiver (e-trex 20 Garmin receiver).
The 70 soil samples that were collected during the survey were air-dried and crushed. They were then passed through a 2-mm sieve to retain the fine material. Various soil chemical properties were analyzed including the pH level of the soil with pH meter, available nitrogen by the Kjeldahl process (Subbaiah & Asija, Citation1965); available phosphorus (P) by Olsen system (Olsen et al., Citation1954); SOC estimation through Walkley and Black method (Walkley & Black, Citation1934), available zinc estimation through PerkinElmer Atomic Absorption Spectrophotometer utilizing the DTPA technique, etc. The USDA triangle system was implemented for estimation of soil texture through the values of sand (>50 μm), silt (2 to 50 μm), and clay (<2 μm) in percentage.
2.4. Image processing
The cloud-free Sentinel-2B MSI ground range detected scenes (10 m spatial resolution, 5 days temporal resolution, orbit no 3205 and 290 km field of view) were acquired from Copernicus open access hub (https://scihub.copernicus.eu) during peak vegetative and heading stages (17 October 2019 for rice and 1 February 2020 for potato). The preprocessing steps of Sentinel-2B image includes calibration, atmospheric correction, cloud masking, and clipping using Sentinel application platform (SNAP Tools v8.0) in Google Earth Engine platform. Sentinel-2B derived NDVI and SAVI indices have been extensively utilized for crop growth monitoring and mapping applications (Sitokonstantinou et al., Citation2018). The unsupervised classification was carried out along with NDVI estimation for each rice farm plot (EquationEquation 1(1)
(1) ). NDVI analysis revealed that the agricultural cropping area existed within the range of 0.45 to 0.57 index value in the study area. SAVI analysis for both the crops in the study area was also carried out. The formulas used for the estimations are as follows (EquationEquation 1
(1)
(1) and EquationEquation 2
(2)
(2) .
where R ~ reflectance values of red (band 4), NIR~ reflectance values of near-infrared (band 8).
2.5. FuzzyAHP analysis for rice and potato land suitability evaluation
The fuzzy set theory was used to develop the FuzzyAHP (FAHP). Its members have knowledge about the various functions of fuzzy membership (Ling, Citation2007, EquationEqs.3(3)
(3) -Equation7
(7)
(7) ). The value of the standardization sub-function is determined by taking into account the degree of fuzzy membership (FMFs). By incorporating FMFs, the sub-criteria’s value will be changed to a range of 0–1, which ensures that every criterion’s value matches.
where
where
where
These include the ability to compute any number in the interval between 0 and 1 (Tahria et al., Citation2022). Here “F” can be demarcated with a fuzzy set number (FN) as follows (EquationEquation 8(8)
(8) ).
where denoted a real number within -∞< x < +∞ and R represented a universal set of the real number µF(x) within a membership function. µF(x) denoted a degree of membership between 0 to 1.
The FAHP was constructed using the hierarchical construction, which takes into account the multiple sub-criteria and criteria. Prioritization was carried out; the values of the pairs were compared with the values of the criteria. Each criterion was then specified by a FN value (Table ), which then led to the identification of the membership function (Mallick et al., Citation2019). The FAHP process employed by comparing the values of the pairs in the hierarchical model. The triangular fuzzy numbers (TFN) are then used to carry the values of the criteria in the construction (EquationEquation 9(9)
(9) ). These values can then be used to perform a rice and potato land suitability analysis (Wijitkosum, Citation2018).
Table 1. The fuzzy linguistic parameters for LSA
where l ≤ m ≤ u. If l = m = u, the FN gets a crisp number. Succeeding, observation could state an area <l or >u, this value (m) not used within the modal value (Chang, Citation1996).
TFN is implemented in a pair-wise comparison matrix à (aij) which could be designed by EquationEquation 10(10)
(10)
i,j = 1, …… n and i ≠ j
The third step includes the eigenvalue estimation and matrix (Ã) creation which finalizes the vector X Equationequation (13)(13)
(13)
where à denoted the n × n matrix which also comprises of (ãij) FNs. X represented a nonzero eigenvector, 1 × n in size, and comprehending Xi of FN. “l” denoted a scalar number (Wang & Luoh, Citation2000). The next step involves identifying the consistency ratio (CR) of the pairs in the comparison matrix. This is done by comparing the values of the pairs with the fuzzy (Eq.14).
and CI represented the consistency index (Eq.15)
where λmax signifies the highest consequence from EquationEquation 9(9)
(9) and n specifies the size of the matrix. Random index (RI) is the weights derived from matrix (n) and its evaluation with the fuzzy number which are agreed with CR value (≤0.1) (Saaty, Citation1980).,
The TFN characterized as a trio (a1; a2; a3) are defuzzified derived from the Yager estimation (Eq.16).def(
The fuzzy linguistic parameters used in the pairwise comparison were then defined for each level of preference (Table ). The ability of the FAHP to merge different types of data was also used to perform a simultaneous comparison of two parameters to classify rice and potato LSA.
2.6. Methodological framework
The study area was surveyed during the planning phase for the analysis of total LSA. Through the use of informal discussions and key informative interviews, the researchers were able to locate an homogeneous farming zone. The resulting map of total LSA may be used to develop a comprehensive representation of the crop status estimation parameters. The current study was to develop a LSA model that would represent the various steps that affect the production of rice and potato (Figure ). The resulting map of total land suitability was then used to develop a comprehensive representation of the crop status estimation parameters using the Inverse Distance Weighting (IDW) method.
Figure 2. Steps of LSA model for rice and potato crop.
The study was performed in four phases: I) data collection and database formation, II) FAHP application, III) rice and potato crop estimation status, and IV) finally, the crop land suitability maps validation with six different machine learning techniques. The criteria for the study were then set up in five hierarchical levels. The main group of criteria that were used for the LSA evaluation included the various factors, namely terrain distribution parameters, static soil parameters, available soil nutrients parameters, agricultural practice parameters, and local variation parameters. Soil parameters are also important to consider in the multi-criteria analysis of total land suitability. After collecting and analyzing the various parameters based on experts/reviewers’ opinion, the researchers were able to come up with a total of 21 sub-criteria that were used for the LSA evaluation. Suitability for the main criteria was estimated by combining corresponding sub-criteria in terms of their suitability ranges and FAHP weights. The resulting map of total land suitability was then used to combine the various primary parameters that were used for the LSA evaluation. The weights of these parameters were then used to determine the relative importance of each land unit.
2.7. Data collection and database formation
The total LSA status of a region is defined by various parameters and indices which may include technical, economic, ergonomic, environmental, and cultural aspects of agricultural farm mechanization (AFM) resulting in the decision-making process. Each parameter is divided into four suitability classes, such as highly suitable, (S1); moderately suitable, (S2); marginally suitable, (S3); and not suitable, (N) (Tables ; Figure ).
Table 2. LSA for the suitability ranges of rice crop
Table 3. LSA for the suitability ranges of potato crop
2.7.1. Terrain distribution parameters
The presence of various terrain features is important to consider in the multi-criteria analysis of total LSA. It can help determine the optimal cropping area and the variety of crops that are grown. Besides these, other factors such as the slope and elevation were additionally taken into account to analyze the contribution of these factors to LSA (Otgonbayar et al., Citation2017). Terrain distribution parameters had six sub-criteria such as NDVI, SAVI, precipitation, temperature, slope, and elevation. The precipitation along with slope and elevation decides the runoff and erosion rates. The vegetation index (NDVI and SAVI) is also used to analyze the various biophysical properties to determine the optimal crop productivity in the study area (Mostafiz et al., Citation2021; Purnamasari et al., Citation2018). The various agro-climatic factors that can affect the growth of certain plants have been identified as the quantitative link between the plant’s environment and its physiological processes. One of the most important factors that can affect the development of plants is the availability of adequate precipitation and temperature (Kondhia et al., Citation2015). In this study, the elevation and slope map were produced from the shuttle radar topography mission (SRTM) DEM product through the GEE platform. The 20-year (2000–2020) Modern-Era Retrospective analysis for Research and Applications (MERRA v2.0) was used for developing the rainfall and temperature map with the help of IDW method in ArcGIS software.
2.7.2. Static soil parameters
The static soil parameter included pH, EC, OC, and ST parameters having significant influence on crop growth and crop yield. Mendas and Delali (Citation2012) created a wheat land suitability map using the static soil parameters through the MCE-based GIS technique.
2.7.3. Available soil nutrient parameters
Available soil nutrients parameters had four sub-criteria, such as available N, P, K, and zinc. All soil parameters’ distribution maps were then produced by assigning the score into four suitability classes. The reclassification of the aforementioned soil parameters was carried out by the FAHP weightage using natural Jenks mechanism through the ArcGIS software environment. In the LSA, the four suitability classes were named as S1, S2, S3, and N based on crop requirements.
2.7.4. Agricultural practice parameter
The modernization of farm activities is determined by a set of inter-related agricultural practices. In our study, agricultural practice parameters had five sub-criteria, such as seed rate, irrigation management, mechanization level, drainage status, and pesticide rate. The mechanization in agriculture has been a vital factor which contributes to the development of productive and profitable farming operations (Ghosh, Citation2010). Increasing land and labor efficiency by reducing the drudgery in farming operations brings in more land under cultivation, which saves energy and resources (seed, fertilizer, and water) for sustainable agricultural production (Lak & Almassi, Citation2011). The rate of seeding and pesticides are generally decided by the experts. Sometimes, the farmers vary the rates based on their observation of seed quality and the emergence of pests.
2.7.5. Local variation parameters
Local variation parameters had four sub-criteria, such as pest affected, FYM uses, source of irrigation, and farmer economic condition. The factors such as the lack of training and rural infrastructure are hindering the development of these regions’ risk-prone conditions (Islam et al., Citation2018). However, these factors were not directly included in the study. Behzad et al. (Citation1992) reported that cow manure is the best alternative for organic matter application in the field to improve soil health status. Antunes et al. (Citation2011) stated that the multi-criteria analysis could be used to determine the current state of the irrigation methods utilized by farmers. It was also used to identify the appropriate irrigation alternatives for each crop.
2.8. Crop status estimation parameters
The final crop status estimation could be carried out taking the suitability zone of all primary criteria suitability estimation. Before the final LSA map generated, it is important that the criteria for each mapping unit be identified and synchronized. For instance, a score of 1 means that the region is highly favorable while a score of 10 means that it is unfavorable. Total LSA is an evaluation and decision-support system developed by relating numerous biophysical and geo-environmental factors (Nigussie et al., Citation2019). The all-data layers that were used in the mapping process were categorized according to their degree of favorability. This process was then used to establish the suitability ranges of the rice and potato crop status estimation parameters. The five main parameter maps were then reclassified into four LSA suitability zone. These maps were then used to establish the final rice and potato crop estimation maps with four suitability ranges, namely S1, S2, S3, and N (Table and Figure ). The weight assigned to the various data layers in the mapping process was based on their relative importance. Through the pairwise comparison process, the criteria were assigned to their respective weights. The weights of these layers were then computed using the FAHP process. The total crop estimation status was then computed by taking the calculated weights of all the primary criteria and adding it to the spatial modeling environment of the LSA through the ESRI GIS package.
2.9. Validation
The current study result was validated with ground field-based crop yield data through six different machine learning (ML) models, namely random forest, support vector machine, adaBoost, extreme gradient boosting, logistic regression, and naïve Bayes (Ilyas et al., Citation2023). The farm-based yield data are divided into two parts: training ~ 70% and testing ~ 30%. The validation result is measured by the area under the curve (AUC) with a true positive rate (high suitability as “1”) and a false positive rate (low suitability as “0”) with binary level of the probability for crop suitability level. All the ML 10-fold validation analysis was used by the python Jupyter Notebook v6.4.5.
Random forest: The concept of the random forest technique involves combining the two components of tree classification: the regression and the classification. It can then be used to create groups of individuals that are homogeneous. The method utilizes a binary split method to achieve this. The average of the final tree output of the RF technique is then used at each node. The auxiliary variables used in the split are then utilized at each node (Taghizadeh-Mehrjardi et al., Citation2020).
Support vector machine: The support vector machine can be used to perform various types of kernel mechanism, namely sigmoid, linear, polynomial, and radial basis with numerous operations, such as classification and regression (Drucker et al., Citation1997). It can transform the data into a high-dimensional representation of the feature space (Cortes et al., 1995).
AdaBoost: The AdaBoost techniques take into account the training samples’ weighted factors and then generate a classification configuration that takes into account the training dataset events. The weights used in the adaBoost classification configuration are standardized for every training instance. A new subset is then generated to develop the next model-based model (Arabameri et al., Citation2020).
Extreme gradient boosting: The XGBoost technique is built on the gradient boosting principle, which combines the predictions of several weak lean models for developing a robust training strategy. It requires a set of parameter selections to perform its operations (Sahin, Citation2020).
Logistic regression: It is a type of multivariate analysis that takes into account the various independent factors and then produces a dichotomous one (McFadden, Citation1973). This method can be performed on various scales with the binary composition. The exact relationship between the independent and the dependent variables is not known.
Naïve Bayes: The Bayes’ theorem is commonly used to classify systems (Soria et al., Citation2011). This type of classification is relatively easy to implement and is ideal for various applications. One of the main advantages of this method is that it doesn’t require any complex parameter estimation techniques. The robust and irrelevant NB method also helps minimize the noise.
3. Results
Current research showed the integration of GIS-FAHP techniques to weigh the various criteria and sub-criteria for the analysis of potato and rice total land suitability. Then the most important factors that were selected for the evaluation were then filtered out using the FAHP matrix (Tables ). The different parameters that were used in the mapping process were then calculated based on the requirements of two major crops, namely, rice and potato. The weight of each criterion was then added to the mapping process to perform the total crop estimation status analysis. The use of GIS to match the suitability of different land utilization types was carried out based on the crop requirements. The various land quality parameters were then integrated using a sequence of map algebra operations. The resulting maps were then generated using the IDW method in the mapping software, ArcGIS.
Table 4. FAHP weightage estimation for each parameter of rice crop
Table 5. FAHP weightage estimation for each parameter of potato crop
3.1. Terrain distribution (TD) parameters
3.1.1. Rice
Aside from the physical factors, the decision-making process related to the land use can also be influenced by various factors that affect the production of crops. For instance, the terrain distribution parameters can play a significant role in limiting the production of certain types of crops.
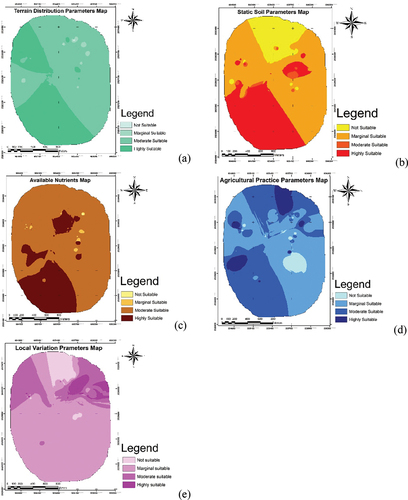
The CR value of the TD parameters was < 0.01 for rice crop. The weightage value of the NDVI parameters was highest at 0.395 and the lowest at 0.068 (elevation). This indicated that the total LSA performed based on these parameters was nominal. The climate and topographic parameters were also analyzed to determine the significance of these factors in the overall farm plot-based suitability. The terrain distribution parameters suitability map of the study area showed t, nearly 37.8 % of the area under highly suitable (S1), 62.16 % area under medium suitable, (S2-S3), and 0.04% of the area under not suitable (N) classes (Table ; Figure ).
Figure 3. Primary rice land suitability criteria map: (a) Terrain distribution parameters. (b) Static soil parameters. (c) Available soil nutrient. (d) Agricultural practice parameters. (e) Local variation parameter.
3.1.2. Potato
Similarly, the CR value of the TD parameters was < 0.01 for potato crop. Based on FAHP weightage, the SAVI parameter is highest at 0.399 and the lowest at 0.067 for elevation (Table ). The terrain distribution parameters of the potato suitability map of the study area presented nearly 40.624 % of the area under the highly suitable, (S1), 31.511% area under the moderate suitable, (S2), and nearly 1.30 % of the area under the not suitable (N) class (Table ; Figure ).
Figure 4. Primary potato land suitability criteria map: (a) Terrain distribution parameters. (b) Static soil parameters. (c) Available soil nutrient. (d) Agricultural practice parameters. (e) Local variation parameter.
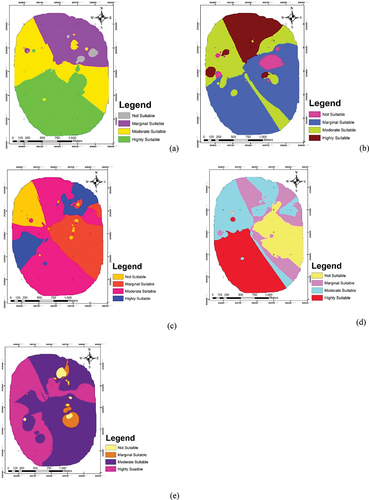
Table 6. FAHP weights for final rice crop status estimation
3.2. Static soil parameters
3.2.1. Rice
In this grouping, soil texture is the most influential parameter for the rice crop production, with the highest weightage of 0.45 and CR at 0.03. Based on the static soil parameters, the highly suitable class (S1) contained around 30.59% area, while the marginally suitable (S3) and not suitable (N) class covered by 52.92% and 15.04% area, respectively (Table ; Figure ).
3.2.2. Potato
Soil texture parameter has the highest weightage value (0.53) based on FAHP analysis for potato crop. For static soil parameters, the highly suitable (S1) class covered approximately 18.64% of the total area, whereas the marginal suitable (S3) class covered around 51.17% (Table ; Figure ).
3.3. Available soil nutrients parameters
3.3.1. Rice
Available N parameters demarcated the highest weightage (0.442) compared to others factors in the available soil nutrients group (Table ). In this group the maximum of the area under moderate suitable (S2) class of 74.57% for rice LSA (Table ; Figure ).
Table 7. FAHP weights for final potato crop status estimation
Table 8. Arial coverage in percentage of LSA map for rice and potato crop
3.3.2. Potato
In the available soil nutrients group, the available potassium parameter comprises the highest weightage value (0.54) and zinc contain the least weightage (0.06) for potato crop (Table ).
Results of available soil nutrients parameters showed that 14.6% of the land was under highly suitable, (S1), while 48.27% of the land was moderate suitable, (S2), and 11.83% area occurred not suitable, (N), for potato LSA (Table ; Figure ).
3.4. Agricultural practice parameters
3.4.1. Rice
In the agricultural practice parameters, the seed rate has highest weightage (0.44) while the lowest weightage value (0.10) is assigned to pesticide rate for rice crop (Table ). Results of agricultural practice parameters exhibited moderately suitable, (S2) class represented by 42.29%, and marginal suitable (S3) class represented by 47.57% area, for rice production (Table ; Figure ).
3.4.2. Potato
In agricultural practice parameters, the CR value was 0.02, while the seed rate had the highest weightage value of 0.44 and the pesticide rate had the lowest weightage value of 0.10 (Table ).
The potato LSA of agricultural practice parameters area coverage demarcated by the four suitability classes, namely S1, S2, S3, and N which falls into 38.69%, 37.51%, 18.68%, and 5.11%, respectively (Table ; Figure ).
3.5. Local variation parameter
3.5.1. Rice
In local variation parameters, farmer financial status has the highest weightage value of 0.482 and the use of FYM has the lowest weightage value of 0.088 (Table ). These cluster of parameters belong with the sigma max value of 4.02 and the CR value of 0.01. Local variation parameters set outcomes presented accordingly 3.90%, 19.63%, 69.77%, and 6.69% of the land which fallinto highly suitable, (S1) moderately suitable, (S2) marginal suitable, (S3), and not suitable (N) class for rice production, respectively (Table ; Figure ). Sometimes, farmers hide their original financial status.
3.5.2. Potato
In local variation parameters, farmer’s financial status has the highest weightage value of 0.482 and the use of FYM has the lowest weightage value of 0.088 for potato crop (Table ). These group of parameters had the sigma max value of 4.02 and the CR value of 0.01. Interestingly, local variation parameters outcome revealed that 36.59%, 58.42%, 3.45%, and 1.52% of the area under the highly suitable (S1), moderately suitable (S2), marginal suitable (S3), and not suitable (N) class for potato production, respectively (Table ; Figure ). Potato being a cash crop has the highest area under suitability class (S1-S2) for local variation parameters.
3.6. Final crop status estimation
3.6.1. Rice
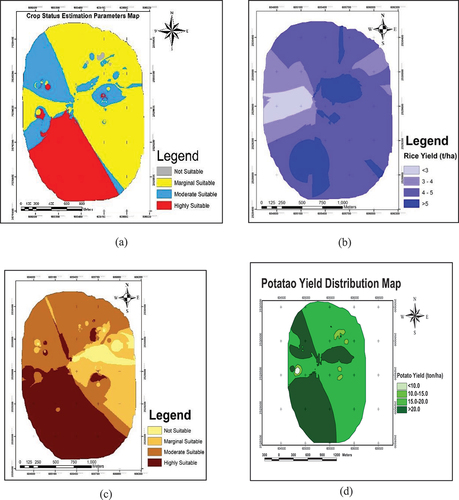
Finally, integrating all the parameters weights from the FAHP matrix, the final rice crop status estimation map was produced (Figure ). The final results indicated that the terrain distribution parameter was assigned the highest weighted (0.441), while the local variation parameter demarcated with lowest weighted (0.050), (Table , Figure ). The weighted values were overlaid to develop the final rice suitability map into four levels, where the sigma max and CR value are 5.05 and 0.01, respectively, under the acceptable limits (Table ; Figure ). The final rice crop estimation status revealed that the maximum area was found to be marginal suitable class (S3 ~ 52.87%) followed by highly suitable (S1 ~ 26.04%) class, moderate suitable (S3 ~ 20.74%) class, and not suitable (N ~ 0.35%) class, respectively. Currently, the highest suitable class (S1) is found in the southern part of the study area with higher level of farm mechanization compared to other parts.
Figure 5. Final crop suitability and yield distribution map; a) crop suitability map for rice (b) rice yield distribution map, c) crop suitability map for potato, d) potato yield distribution map.
3.6.2. Potato
Similarly, the final potato LSA outcome presented that the terrain distribution parameters had the highest weightage, while the local variation parameter demarcated with lowest weightage. The final potato crop estimation status was created with the FAHP weighted technique. The result of the final potato crop suitability assessment represented that highly suitable class constituted the most substantial proportion with 38.69% of the study area. Conversely, around 37.51% of the area under the marginal suitable, 18.68% of the area under the moderate suitable, and 5.11% of the area under the not suitable class are identified in the region. Currently the not suitable class (S1) was found in the northern part with low farm mechanization and acidic soil condition compared to other parts of the study area (Table ; Figure ).
3.7. Rice yield distribution map
The rice yield information of the study area was collected during the field visit to each farm plot. The yield distribution map was developed in ArcGIS 10.7.1 software environment using the IDW interpolation technique (Figure ). Nearly 17% of the total area was producing high rice yield (>5 tons/ha), mostly falling under the highly suitability class. Similarly, the majority of the area classified under moderately suitable that varied from 3 to 5 tons/ha. However, nearly 6% of areas falls into low rice yield class (<3 tons/ha) there may need to carry out field-based analysis through ground-truthing to ensure better return to the farmers.
3.8. Potato yield distribution map
The potato yield (t/ha) distribution map was also developed in ArcGIS 10.7 software environment (Figure ). The average potato yield found in the region is around 18 t/ha, which is sound compared to other areas in the region; however, the quality of potato needs to be monitored. The distribution map can also be used to identify the area giving low crop yield. For instance, 36.8% of the study area is considered highly suitable (>20t/ha), while 61.2% of the area is considered moderate suitable (15–20 t/ha), and 0.4% of the study area is considered not suitable (<10 t/ha) for growing potato. Almost 90% of the farms in the study area was suitable for growing potato crop. As, this study area is located in major potato growing region and significant numbers of farms grow the crop. The spatial pattern of the potato yield maps showed that the northeast part of the study area had lower crop yield than the southwest part, which may be due to low amount organic carbon, presence of acidic soil, and high electrical conductivity.
3.9. Validation
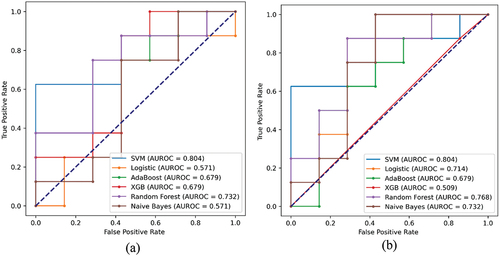
Based on ML validation outcome, the SVM method had the highest AUC for rice and potato (above 80%) land suitability analysis. Also, the RF and AdaBoost method (>67%) was found to have medium performance with the AUC value. Logistic regression method (71%) performed better for the potato land suitability estimation compared to the rice crop. Similarly, the XGB (67%) had better performance for rice crop yield model, whereas performed low for potato crop (Figure ).
Figure 6. Final land suitability map validation with AUROC; (a) rice, (b) potato.
4. Discussion
The identification of suitable land for growing crops is very important to meet the increasing demand in food in the current world scenario. Through the FuzzyAHP technique, a comprehensive land suitability analysis can be performed efficiently and effectively. This method allows the users to determine the weights of various parameters and their consistency. GIS is a powerful tool that can be used to create and manage a comprehensive land suitability analysis through mapping. The integration of the FAHP-GIS/RS and MCDM methods allows the users to assign proper weightage to the various parameters in the LSA. The logical FAHP technique-based land suitability analysis will enhance the adoption of technique for better crop selection.
The 21 parameters, including the cropping and non-cropping variables, can provide the best conditions for the crop suitability study. In addition to the multiple parameters, the study also evaluated the biophysical variables of the land. This method can be used to enhance the efficiency of crop management in the region. This study provides a biophysical evaluation that allows farmers to select the appropriate cropping patterns and long-term crop rotation. It will help the investigators to develop effective strategies to improve the efficiency of their operations. One of the most important factors, the study focused on, was the evaluation of the land grouped under not suitable class for alternative crops.
The suitability map for rice crop in terms of primary criteria was identified by FAHP weighted overlay using spatial analyst tools in ArcGIS 10.7.1. In final crop status parameters analysis, the majority of the area was found to be classified under marginally suitable class of 69.77% for rice. In contrast, the areas were characterized by: alluvial plain area, a mean value of soil organic of 0.54%, superior irrigation facility, texture class clay, and N, P, K levels good with average temperatures between 22–30 degrees Celsius which was considered as the ideal range for the crop. The LSA levels were also in agreement with the findings of the literature. Overall, the profit margin from rice cropping is somewhat low, which may allow for experiment with new crops. Generally, not suitable (N) areas were characterized with high EC condition, acidic pH level, and low mechanization level. So, as per the final LSA analysis, approximately 0.35% of the area classified under a not suitable group may be dedicated to an alternative crop for better profit margin. However, potato cropping has been successful in the study area with very high yield throughout the study area.
The result for the final potato crop suitability assessment showed that highly suitable constitutes the most substantial proportion, with 38.69% of the study region. Nearly, 90% of area had sound potato crop yield in the region. As expressed by the farmers, due to variation in weather, potato tuber quality somehow not maintained, which needs special attention. High potato yield sometimes causes low selling pricing leading to low profit margin for the farmers. Potato tuber quality needs to be improved through continuous monitoring of crop to ensure better return to the farmers.
The findings of the study provide effective recommendations for improving the land-use efficiency and the management of rice and potato in the Tarakeswar region, West Bengal, India. The results of the study can also be used to help policymakers to take informed decisions regarding the use of land resources. It can also help them identify areas where they can improve the efficiency of their operations and ensure that the land is used most effectively.
In India, the majority of small and marginal farmers grow rice and potato for their consumption. Sometimes, they do not estimate the loss or profit from rice farming. The wrong cropping practice and unfavorable surrounding weather and physical interferences along with traditional cropping practices cause losses, leading to economic setback for the farmer’s family. The soil health card (Government of India, Citation2017) system has provided farmers with a new hope of understanding their soil condition. The soil health card report may be used to evaluate the farm suitable for rice and potato crop or changes required in terms of crop inputs or crop replacement with a better alternative crop. The suitability analysis through FAHP may be extended to other areas through soil health card report for wider adaptability of the proposed technique.
Irrespective of the farm size, most of the farmers considered “high labour cost” as the most important problem in growing crops. Agriculture is considered a complicated system, which may be influenced by technical, economical, ergonomic, environmental, and cultural criteria. Sometimes a single criterion can cause major crop damage with a very low return to farmers. However, the FuzzyAHP is capable to rank the parameters and gives certain weightage to individual parameters, based on the individual level of influence as well as the combined influence of two or more parameters. Robertson and Oinam (Citation2023) model clearly indicated that GIS integrated with AHP technique had potential to decide the weights of each individual parameter using experts’ opinions which can serve as a versatile tool to carry-out suitability analysis which can aid policy makers.
It was recommended to use MCDM methods to make the best decisions according to the criteria with TOPSIS, VIKOR, LINMAP, SAW, WASPAS, and fuzzy logic. The criteria may ameliorate the decision according to real field conditions. Even the criteria can be extended to large field areas and for different crop rotations.
The study was conducted to provide a comprehensive analysis of the various factors that affect the crop growth and crop production in the study region. It also validated the importance of the sub-criteria that are used in the design and planning of agricultural projects in the area. Based on machine learning validation outcome, the SVM method had the highest AUC for rice and potato (above 80%) compared to other machine learning technique.
The future recommendation of this study could implement the near real-time basis big data-driven knowledge with the various precession agriculture technologies such as IoT, RADAR-based remote sensing, UAV, soil spectroscopy, hybrid MCDM, machine learning, deep learning, block chain, and cloud computing approach based on LSA multi-criteria evaluation.
5. Conclusion
Total land suitability analysis is an attempt to include all possible parameters having impact on crop growth and vegetation particularly for rice-potato cropping system in West Bengal. The Fuzzy- Analytical Hierarchy Process (FAHP)-based model to assign weightage to individual parameters and the primary criteria is a novel technique for carrying out final land suitability analysis. Based on this analysis, crop suitability distribution maps were developed for rice and potato crops in ArcGIS software environment. The land suitability maps were compared with field yield information through machine learning models. The SVM ML technique produced the best suited model with sound AUROC coefficient (>0.8) which can be used in future crops suitability analysis. The areas having low crop yield and classified as not suitable for a particular crop may be allotted for an alternative crop/crop rotation. The freely distributed high-resolution Sentinel-2 data may be used for near real-time crop monitoring.
The lack of links between the innovators and the farmers has been associated with the traditional approach to conducting agricultural research. By adopting new land suitability studies, farmers can now protect their crops from various threats such as water stress, climate change, and emergence of pests and diseases.
Authors’ contributions
Conceptualization and supervision were performed by CS, KCS, and SS; writing review and editing was performed by CS, KCS, SS, HGA, and HA; data curation and formal analysis were carried out by CS, KCS, SS, HGA, AAA, and HA; evidence collection, review, and editing were performed by CS, KCS, SS, HGA, JAA, AAA, and HA.
Availability of data
The data that support the findings of this study are available on request from the corresponding author.
Compliance with ethical standards
Disclosure of potential conflicts of interest
Acknowledgments
The authors are also grateful to editors and potential reviewers.
Disclosure statement
No potential conflict of interest was reported by the author(s).
Additional information
Notes on contributors
Chiranjit Singha
Dr. Chiranjit Singha, the first author, completed Ph.D. at the Visva Bharati University (A Central University), Department of Agricultural Engineering, India. His main research interests are the application of Precision agriculture (PA) and use of Geographic Information Systems (GIS) and Remote Sensing (RS) for applications in the ecological environment, disaster management to enhance the understanding of the Earth observation system science, in the context of geo-environmental and hydrometeorological shifts, which significantly interests him.
Kishore Chandra Swain
Dr. Kishore Chandra Swain, the second author, is an Assistant Professor at Visva Bharati University, Department of Agricultural Engineering, India who published around 50 research papers in internationally recognized journal and have also authored six books.
Satiprasad Sahoo
Dr. Satiprasad Sahoo, the third author, is a Water Resource Engineer in the GeoAgro at the International Center for Agricultural Research in the Dry Areas (ICARDA), Cairo, Egypt.
Hazem Ghassan Abdo
Dr. Hazem Ghassan Abdo, the fourth author, is a faculty member with a Ph.D. completed at the Geography Department, Tartous University, Syria. His main research interests are the use of Remote Sensing and Geographic Information Systems for applications in the terrestrial environment to enhance the understanding of the Earth system processes, in the context of environmental and geomorphological shifts, which significantly interests him.
Hussein Almohamad
Dr. Hussein Almohamad, the fifth author, received a PhD in Physical Geography from Justus Liebig University Giessen, Germany in 2009. He is a full professor at the Department of Geography, Qassim University, Saudi Arabia. His research interests include climatology, physical and human hazards, hydrology, data visualization and remote sensing.
Ahmed Abdullah Al Dughairi
Dr. Ahmed Abdullah Aldughairi, the sixth author, is a professor of environment Quaternary Science and Remote Sensing at the Department of Geography, Arabic Language and Social Studies Faculty, Qassim University, Saudi Arabia. His current research interests focus on flood risk, air quality assessment, forest fires, landslide susceptibility, urban environment quality, and different remote sensing applications.
Jasem A Albanai
Dr. Jasem A Albanai, the seventh author, is a geo-planner at the Environmental Public Authority in the State of Kuwait. His interests focus on using and validating remote sensing data in monitoring the surface dynamic and climate change consequences.
References
- Agricoop India. (2020). Agricultural Statistics at a Glance 2020. Accessed on 10 March https://agricoop.gov.in/en/Horticulturereports
- Ali, A. M., & Aboelghar, M. (2019). Comparative analysis of different methods of leaf area index estimation of Strawberry under Egyptian condition. International Journal of Advanced Remote Sensing and GIS, 8(1), 2963–30. https://doi.org/10.23953/cloud.ijarsg.405
- Amini, S., Rohani, A., Hossein, A. M., & Reza, A. M. (2019). Assessment of land suitability and agricultural production sustainability using a combined approach (fuzzy-AHP-GIS): A case study of Mazandaran Province, Iran. Information Processing in Agriculture, 7(3), 384–402. https://doi.org/10.1016/j.inpa.2019.10.001
- Antunes, P., Karadzic, V., Santos, R., Beça, P., & Osann, A. (2011). Participatory multi-criteria analysis of irrigation management alternatives: The case of the caia irrigation district, Portugal. International Journal of Agricultural Sustainability, 9(2), 334–349. https://doi.org/10.1080/14735903.2011.582358
- Arabameri, A., Saha, S., Mukherjee, K., Blaschke, T., Chen, W., Ngo, P. T. T., & Band, S. S. (2020). Modeling spatial flood using novel ensemble artificial intelligence approaches in northern Iran. Remote Sensing, 12(20), 3423. https://doi.org/10.3390/rs12203423
- Bagherzadeh, A., & Gholizadeh, A. (2016). Modeling land suitability evaluation for wheat production by parametric and TOPSIS approaches using GIS, northeast of Iran. Modelling Earth Systems and Environment, 2(3), 1–11. https://doi.org/10.1007/s40808-016-0177-8
- Baroudy, A. A. E., Ali, A. M., Mohamed, E. S., Moghanm, F. S., Shokr, M. S., Savin, I., Poddubsky, A., Ding, Z., Kheir Ahmed, M. S., Aldosari, A. A., Elfadaly, A., Dokukin, P., & Lasaponara, R. (2020). Modeling land suitability for rice crop using Remote sensing and soil quality indicators: The case study of the Nile Delta. Sustainability, 12(22), 9653. https://doi.org/10.3390/su12229653
- Baumgart-Getz, A., Prokopy, L. S., & Floress, K. (2012). Why farmers adopt best management practices in the United States: A meta-analysis of the adoption literature. Journal of Environmental Management, 96(1), 17–25. https://doi.org/10.1016/j.jenvman.2011.10.006
- Behzad, S., Razavi, M., & Mahajeri, M. (1992). The effect of various amounts of ammonium phosphate and urea on saffron production. Acta Horticulturae, 306(306), 337–339. https://doi.org/10.17660/ActaHortic.1992.306.44
- Chang, D. Y. (1996). Applications of the extent analysis method on fuzzy AHP. European Journal of Operational Research, 95(3), 649–655. https://doi.org/10.1016/0377-2217(95)00300-2
- Dang, K. B., Burkhard, B., Windhorst, W., & Müller, F. (2019). Application of a hybrid neural-fuzzy inference system for mapping crop suitability areas and predicting rice yields. Environmental Modelling & Software, 114, 166–180. https://doi.org/10.1016/j.envsoft.2019.01.015
- Das, J., Gayen, A., & Saha, S. (2017). Modelling of alternative crops suitability to tobacco based on analytical hierarchy process in Dinhata subdivision of Koch Bihar district, West Bengal. Modelling Earth Systems and Environment, 3(4), 1571–1587. https://doi.org/10.1007/s40808-017-0392-y
- Debesa, G., Gebre, S. L., Melese, A., Regassa, A., Teka, S., & Tejada Moral, M. (2020). GIS and remote sensing-based physical land suitability analysis for major cereal crops in Dabo Hana district, South-West Ethiopia. Cogent Food & Agriculture, 6(1), 1780100. https://doi.org/10.1080/23311932.2020.1780100
- Dengiz, O. (2019). Soil quality index for paddy fields based on standard scoring functions and weight allocation method. Archives of Agronomy & Soil Science, 66(3), 301–315. https://doi.org/10.1080/03650340.2019.1610880
- Drucker, H., Burges, C. J., Kaufman, L., Smola, A. J., & Vapnik, V. (1997). Support vector regression machines. Advances in Neural Information Processing Systems, 28, 779–784.
- Eastman, J. R., Jin, W., Kyemand, A. K., & Toledano, J. (1995). Raster procedures for multi-criteria/multi-objective decisions. Photogrammetric Engineering and Remote Sensing, 61(5), 539–547.
- Estes, L., Bradley, B. A., Beukes, H., Hole, D. G., Lau, M., Oppenheimer, M. G., Schulze, R., Tadross, M., & Turner, W. R. (2013). Comparing mechanistic and empirical model projections of crop suitability and productivity: Implications for ecological forecasting. Global Ecology and Biogeography, 22(8), 1007–1018. https://doi.org/10.1111/geb.12034
- Everest, T., & Gür, E. (2022). A GIS-based land evaluation model for peach cultivation by using AHP: A case study in NW Turkey. Environmental Monitoring and Assessment, 194(4), 241. https://doi.org/10.1007/s10661-022-09898-6
- Everest, T., Sungur, A., & Özcan, H. (2021). Determination of agricultural land suitability with a multiple-criteria decision-making method in Northwestern Turkey. International Journal of Environmental Science and Technology, 18(5), 1073–1088. https://doi.org/10.1007/s13762-020-02869-9
- Ghosh, B. K. (2010). Determinants of farm mechanisation in modern Agriculture: A case study of burdwan districts of West Bengal. International Journal of Agricultural Research, 5(12), 1107–1115. https://doi.org/10.3923/ijar.2010.1107.1115
- Government of India. (2017). Soil health card report by Department of Agriculture and Farmers Welfare, Minstry of Agriculture and Farmers Welfare, government of India. www.soilhealth.dac.gov.in. Accessed on 10 March.
- Gyekye, P. M., Domozoro, C. Y. F., Musah, M., Ababio, F. O., & Sadick, A. (2021). Soil and land suitability assessment for rice cultivation at Tono irrigation area in the Upper East region, Ghana. Open Journal of Applied Sciences, 11(11), 1230–1239. https://doi.org/10.4236/ojapps.2021.1111093
- Hamzeh, S., Mokarram, M., Haratian, A., Bartholomeus, H., Ligtenberg, A., & Bregt, A. (2016). Feature selection as a time and cost-saving approach for land suitability classification (case study of shavur plain, Iran. Agriculture, 6(4), 52. https://doi.org/10.3390/agriculture6040052
- Houshyar, E., Smith, P., Mahmoodi-Eshkaftaki, M., & Azadi, H. (2017). Sustainability of wheat production in southwest Iran: A fuzzy-GIS based evaluation by ANFIS. Cogent Food & Agriculture, 3(1), 1327682. https://doi.org/10.1080/23311932.2017.1327682
- Ilyas, Q. M., Ahmad, M., & Mehmood, A. (2023). Automated estimation of crop yield using artificial intelligence and Remote sensing technologies. Bioengineering, 10(2), 125. https://doi.org/10.3390/bioengineering10020125
- IRRI. 1985. Soil physics and Rice. 1985 International Rice Research Institute Los Baños Laguna: 1-397. ISBN 971-104-146-4.
- Islam, M. M., Ahamed, T., & Noguchi, R. (2018). Land suitability and insurance Premiums: A GIS-based multicriteria analysis approach for sustainable rice production. Sustainability, 10(6), 1759. https://doi.org/10.3390/su10061759
- Jain, R., Chand, P., Rao, S. C., & Agarwal, P. (2020). Crop and soil suitability analysis using multi-criteria decision making in drought-prone semi-arid tropics in India. Journal of Soil and Water Conservation, 19(3), 271. https://doi.org/10.5958/2455-7145.2020.00036.3
- Jamil, M., Ahmed, R., & Sajjad, H. (2018). Land suitability assessment for sugarcane cultivation in Bijnor district, India using geographic information system and fuzzy analytical hierarchy process. GeoJournal, 83(3), 595–611. https://doi.org/10.1007/s10708-017-9788-5
- Jiao, L., & Liu, Y. (2007). Model of land suitability evaluation based on computational intelligence. Geo-Spatial Information Science, 10(2), 151–156. https://doi.org/10.1007/s11806-007-0053-9
- Kahsay, A., Haile, M., Gebresamuel, G., Mohammed, M., & Tejada Moral, M. (2018). Land suitability analysis for sorghum crop production in northern semi-arid Ethiopia: Application of GIS-based fuzzy AHP approach. Cognet Food & Agriculture, 4(1), 1507184. https://doi.org/10.1080/23311932.2018.1507184
- Keshavarzi, A., Tuffour, H. O., Bagherzadeh, A., Tattrah, L. P., Kumar, V., Gholizadeh, A., & Rodrigo-Comino, J. (2020). Using fuzzy-AHP and parametric technique to assess soil fertility status in northeast of Iran. Journal Of, 7(4), 931–948. https://doi.org/10.1007/s11629-019-5666-6
- Khan, M. A., Ahmad, R., & Khan, H. H. (2022). Multi-criteria land suitability analysis for Agriculture using AHP and Remote sensing data of northern region India. In Y. Zhang & Q. Cheng (Eds.), Geographic Information Systems and applications in coastal studies. https://doi.org/10.5772/intechopen.102432
- Kondhia, A., Tabien, R. E., & Ibrahim, A. (2015). Evaluation and selection of high biomass rice (oryza sativa L.) for drought tolerance. American Journal of Plant Sciences, 06(12), 1962–1972. https://doi.org/10.4236/ajps.2015.612197
- Kumar, A., Singh, D., & Mahapatra, S. K. (2020). Current and potential soil suitability of Pearl Millet, wheat and mustard for sustainable production in Aravalli Foothills of Mewat region of Haryana, India. International Journal of Current Microbiology and Applied Sciences, 9(5), 3566–3583. ISSN : 2319-7706. https://doi.org/10.20546/ijcmas.2020.905.424
- Lak, M. B., & Almassi, M. (2011). An analytical review of parameters and indices affecting decision making in agricultural mechanization. Australian Journal of Agricultural Engineering, 2(5), 140–146. ISSN:1836-9448.
- Ling, W.-K. (2007). Reviews. Nonlinear Digital Filters, 8–31. https://doi.org/10.1016/b978-012372536-3/50002-8
- López-Blanco, J., Pérez-Damián, J. L., Conde Álvarez, A. C., Gómez-Díaz, J. D., & Monterroso-Rivas, A. I. (2018). Land suitability levels for rainfed maize under current conditions and climate change projections in Mexico. Outlook on Agriculture, 47(3), 181–191. https://doi.org/10.1177/0030727018794973
- Magri, A., Van Es, H. M., Glos, M. A., & Cox, W. J. (2005). Soil test, aerial image and yield data as inputs for site-specific fertility and hybrid management under maize. Precision Agriculture, 6(1), 87–110. https://doi.org/10.1007/s11119-004-0687-7
- Mallick, J., Khan, R. A., Ahmed, M., Alqadhi, S. D., Alsubih, M., Falqi, I. A., & Hasan, M. A. (2019). Modeling groundwater potential zone in a semi-arid region of aseer using fuzzy-AHP and geoinformation techniques. Water, 11(12), 2656–. https://doi.org/10.3390/w11122656
- Mandal, V. P., Rehman, S., Ahmed, R. M., & Kumar, M.P & Sajjad, H. (2020). Land suitability assessment for optimal cropping sequences in Katihar district of Bihar, India using GIS and AHP. Spatial Information Research, 28(5), 589–599. https://doi.org/10.1007/s41324-020-00315-z
- McFadden, D. (1973). Conditional logit analysis of quantitative choice behavior. In P. Zarembka (Ed.), Frontiers in Econometrics (pp. 105–142). Academic Press.
- Mendas, A., & Delali, A. (2012). Integration of multi criteria decision analysis in GIS to develop land suitability for agriculture: Application to durum wheat cultivation in the region of Mleta in Algeria. Computer Electronics in Agriculture, 83, 117–126. https://doi.org/10.1016/j.compag.2012.02.003
- Mishra, A. R., Rani, P., & Bharti, S. (2021). Assessment of Agriculture crop selection using Pythagorean fuzzy CRITIC–VIKOR decision-making framework. Published In: Pythagorean Fuzzy Sets, Springer Singapore. https://doi.org/10.1007/978-981-16-1989-2_7https://www.springerprofessional.de/en/a-survey-on-recent-applications-of-pythagorean-fuzzy-sets-a-stat/19384322
- Mohammadi, M. F., Najafi, A., & Ahmadlo, F. (2015). Using the analytical network process (ANP) based on BOCR model to select the most suitable region for forestation with almond species. Nusantara Bioscience, 7(2), 118–127. https://doi.org/10.13057/nusbiosci/n070210
- Mostafiz, R. B., Noguchi, R., & Ahamed, T. (2021). Agricultural land suitability assessment using satellite remote sensing-derived soil-vegetation indices. Land, 10(2), 223. https://doi.org/10.3390/land10020223
- Mugiyo, H., Chimonyo, V. G. P., Sibanda, M., Kunz, R., Masemola, C. R., Modi, A. T., & Mabhaudhi, T. (2021). Evaluation of land suitability methods with reference to neglected and under utilised crop species: A scoping review. Land, 10(2), 125. https://doi.org/10.3390/land10020125
- Nigussie, D., Mulugeta, W., Molla, A., Bishaw, Z., & Biradar, C. (2019). Land suitability mapping for production of Chickpea, Faba Bean and malt barley varieties in Ethiopia. International Center for Agricultural. Research in the Dry Areas (ICARDA. https://www.researchgate.net/publication/335797957
- Olsen, S. R., Cole, C. V., Watanabe, F. S., & Dean, L. A. (1954). Estimation of Available phosphorus in soils by extraction with Sodium Bicarbonate, USDA circular 939. United States Department of Agriculture.
- Otgonbayar, M., Atzberger, C., Chambers, J., Amarsaikhan, D., Bock, S., & Tsogtbayar, J. (2017). Land suitability evaluation for Agricultural cropland in Mongolia using the spatial MCDM method and AHP based GIS. Journal of Geoscience and Environment Protection, 5(09), 238–263. https://doi.org/10.4236/gep.2017.59017
- Özkan, B., Dengiz, O., & Turan, İ. D. (2020). Site suitability analysis for potential agricultural land with spatial fuzzy multi-criteria decision analysis in regional scale under semi-arid terrestrial ecosystem. Scientific Report, 10(1), 22074,–. https://doi.org/10.1038/s41598-020-79105-4
- Pandey, A., Chowdary, V. M., Mal, B. C., & Dabral, P. P. (2011). Remote sensing and GIS for identification of suitable sites for soil and water conservation structures. Land Degradation and Development, 22(3), 359–372. https://doi.org/10.1002/ldr.1012
- Park, S., Jeon, S., Kim, S., & Choi, C. (2011). Prediction and comparison of urban growth by land suitability index mapping using GIS and RS in South Korea. Landscape and Urban Planning, 99(2), 0–114. https://doi.org/10.1016/j.landurbplan.2010.09.001
- Pasqualotto, N., Delegido, J., Van Wittenberghe, S., Rinaldi, M., & Moreno, J. (2019). Multi-crop green LAI estimation with a new simple Sentinel-2 LAI index (SeLI). Sensors, 19(4), 904. https://doi.org/10.3390/s19040904
- Perveen, M. F., Nagasawa, R., Ahmed, A. O. C., Uddin, M. I., & Kimura, R. (2008). Integrating biophysical and socio-economic data using GIS for land evaluation of wheat cultivation: A case study in north-west Bangladesh. Journal of Food, Agriculture & Environment, 6(2), 432–437. https://doi.org/10.1234/4.2008.1274
- Pilevar, A. R., Matinfar, H. R., Sohrabi, A., & Sarmadian, F. (2020). Integrated fuzzy, AHP and GIS techniques for land suitability assessment in semi-arid regions for wheat and maize farming. Ecological Indicator, 110, 105887. https://doi.org/10.1016/j.ecolind.2019.105887
- Pourkhabbaz, H. R., Javanmardi, S., & Faraji Sabokbar, H. A. (2014). Suitability analysis for determining potential Agricultural land use by the multi-criteria decision making models SAW and VIKOR-AHP (case study: Takestan-qazvin plain). Journal of Agricultural Science and Technology, 16(5), 1005–1016. http://jast.modares.ac.ir/article-23-4889-en.html
- Purnamasari, R. A., Ahamed, T., & Noguchi, R. (2018). Land suitability assessment for cassava production in Indonesia using GIS, remote sensing and multi-criteria analysis. Asia-Pacific Journal of Regional Science, 3(5), 1–32. https://doi.org/10.1007/s41685-018-0079-z
- Radočaj, D., & Jurišić, M. (2022). GIS-Based cropland suitability prediction using machine learning: A novel approach to sustainable Agricultural production. Agronomy, 12(9), 2210. https://doi.org/10.3390/agronomy12092210
- Rado, D., Jurisi, M., Gasparovi, M., & Plascak, I. (2020). Optimal soybean (glycine max L.) land suitability using GIS-Based Multicriteria analysis and Sentinel-2 multitemporal images. Remote Sensing, 12(1463). https://doi.org/10.3390/rs12091463
- Rashidi, F., & Sharifian, S. (2022). A comparative analysis of three multi-criteria decision-making methods for land suitability assessment. Environmental Monitoring Assessment, 194(9), 657. https://doi.org/10.1007/s10661-022-10259-6
- Robertson, N., & Oinam, B. (2023). Rice suitability mapping using the analytic hierarchy process approach in a river catchment. Global Journal of Environmental Science and Management, 1(33), 141–156. https://doi.org/10.22034/GJESM.2023.01.11
- Rodcha, R., Tripathi, N. K., & Shrestha, P. (2019). Comparison of cash crop suitability assessment using parametric, AHP, and FAHP methods. Land, 8(5), 79–. https://doi.org/10.3390/land8050079
- Saaty, T. L. (1980). The analytic hierarchy process. McGraw-Hill.
- Sahin, E. K. (2020). Comparative analysis of gradient boosting Algorithms for landslide susceptibility mapping. Geocarto International, 37(9), 2441–2465. https://doi.org/10.1080/10106049.2020.1831623
- Sarkar, B., Das, P., Islam, N., Basak, A., Debnath, M., & Roy, R. (2022). Land suitability analysis for paddy crop using GIS-based fuzzy-AHP (F-AHP) method in Koch Bihar district, West Bengal. Geocarto International, 37(25), 8952–8978. https://doi.org/10.1080/10106049.2021.2007299
- Seyedmohammadi, J., Sarmadian, F., Jafarzadeh, A. A., Ghorbani, M. A., & Shahbazi, F. (2018). Application of SAW, TOPSIS and fuzzy TOPSIS models in cultivation priority planning for maize, rapeseed and soybean crops. Geoderma, 310, 178–190. https://doi.org/10.1016/j.geoderma.2017.09.012
- Seyedmohammadi, J., Sarmadian, F., Jafarzadeh, A. A., & McDowell, R. W. (2019). Integration of ANP and fuzzy set techniques for land suitability assessment based on remote sensing and GIS for irrigated maize cultivation. Archives of Agronomy & Soil Science, 65(8), 1063–1079. https://doi.org/10.1080/03650340.2018.1549363
- Shaloo Singh, R. P., Bisht, H., Suna, R., Jain, T., Bana, R. S., Godara, S., Shivay, Y. S., Bedi, N., Singh, J., Bedi, J., Begam, S., Tamta, M., & Gautam, S. (2022). Crop-suitability analysis using the analytic hierarchy process and geospatial techniques for cereal production in north India. Sustainability, 14, 5246. https://doi.org/10.3390/su14095246
- Singha, C., & Swain, K. C. (2016). Land suitability evaluation criteria for agricultural crop selection: A review. Agricultural Reviews, 37(2). https://doi.org/10.18805/ar.v37i2.10737
- Singha, C., & Swain, K. C. (2022). Rice and potato yield prediction using artificial intelligence techniques. In P. K. Pattnaik, R. Kumar, & S. Pal (Eds.), Internet of things and Analytics for Agriculture, 3. Studies in big data, 99 (pp. 185–199). Springer. https://doi.org/10.1007/978-981-16-6210-2_9
- Singha, C., Swain, K. C., & Swain, S. K. (2020). Best crop rotation selection with GIS-AHP technique using soil nutrient variability. Agriculture, 10(6), 213. https://doi.org/10.3390/agriculture10060213
- Sitokonstantinou, V., Papoutsis, I., Kontoes, C., Arnal, A., Andrés, A. P., & Zurbano, J. A. (2018). Scalable parcel-based crop identification scheme using Sentinel-2 data time-series for the Monitoring of the common Agricultural policy. Remote Sensing, 10(6), 911. https://doi.org/10.3390/rs10060911
- Soil Survey Staff. (1993). Soil survey manual. Agricultural handbook. No. 18. US Department of Agriculture, Soil Conservation Service.
- Son, N. T., Chen, C. F., Chen, C. R., & Guo, H. Y. (2020). Classification of multitemporal Sentinel-2 data for field-level Monitoring of rice cropping practices in Taiwan. Advances in Space Research, 65(8), 1910–1921. COSPAR. https://doi.org/10.1016/j.asr.2020.01.028
- Soria, D., Garibaldi, J. M., Ambrogi, F., Biganzoli, E. M., & Ellis, I. O. (2011). A “non-parametric” version of the naive Bayes classifier. Knowledge-Based Systems, 24(6), 775–784. https://doi.org/10.1016/j.knosys.2011.02.014
- Subbaiah, B. V., & Asija, G. L. (1965). A rapid procedure for determination of available nitrogen in soil. Current Science, 25, 259–260. https://www.scienceopen.com/
- Suruliandi, A., Mariammal, G., & Raja, S. P. (2021). Crop prediction based on soil and environmental characteristics using feature selection techniques. Mathematical and Computer Modelling of Dynamical Systems, 27(1), 117–140. https://doi.org/10.1080/13873954.2021.1882505
- Swain, K. C., & Singha, C. (2018). Soil profile based land suitability study for jute and lentil using AHP ranking. International Journal on Bio-Resource and Stress Management, 9(3), 323–329. https://doi.org/10.23910/IJBSM/2018.9.3.1869
- Taghizadeh-Mehrjardi, R., Nabiollahi, K., Rasoli, L., Kerry, R., & Scholten, T. (2020). Land suitability assessment and Agricultural production Sustainability using machine learning models. Agronomy, 10(4), 573. https://doi.org/10.3390/agronomy10040573
- Tahria, M., Maanan, M., Tahri, H., Kašpar, J., Purwestri, R. C., Mohammadi, Z., & Marušák, R. (2022). New fuzzy-AHP matlab based graphical user interface (GUI) for a broad range of users: Sample applications in the environmental field. Computer Geoscience, 158, 104951. https://doi.org/10.1016/j.cageo.2021.104951
- Tashayo, B., Honarbakhsh, A., Akbari, M., & Eftekhari, M. (2020). Land suitability assessment for maize farming using a GIS-AHP method for a semi- arid region. Iran Journal of the Saudi Society of Agricultural Sciences, 19(5), 332-338 S1658077X20300217–. https://doi.org/10.1016/j.jssas.2020.03.003
- Trigoso, D. I., Lopez, R. S., Briceño, N. B. R., López, J. O. S., Fernández, D. G., Oliva, M., Huatangari, L. Q., Murga, R. E. T., Castillo, E. B., & Gurbillón, M. A. B. (2020). Land suitability analysis for potato crop in the Jucusbamba and tincas microwatersheds. AHP and RS–GIS Approach, Agronomy. 10 1898. https://doi.org/10.3390/agronomy10121898
- Walkley, A., & Black, L. A. (1934). An examination of datjareff method for determining soil organic matter: And a proposed modification of the chromic acid titration method. Soil Science, 37(1), 29–38.
- Wang, W., & Luoh, L. (2000). Simple computation for the defuzzifications of center of sum and center of gravity. Journal of Intelligent & Fuzzy Systems, 9, 53–59. https://dl.acm.org/doi/10.5555/1314373.1314378
- Whitmire, C. D., Vance, J. M., Rasheed, H. K., Missaoui, A., Rasheed, K. M., & Maier, F. W. (2021). Using machine learning and feature selection for alfalfa yield prediction. AI, 2(1), 71–88. https://doi.org/10.3390/ai2010006
- Wijitkosum, S. (2018). Fuzzy AHP for drought risk assessment in Lam Ta Kong watershed, the north-eastern region of Thailand. Soil Water Research, 13(4), 218–225. https://doi.org/10.17221/158/2017-SWR
- Yohannes, H., & Soromessa, T. (2018). Land suitability assessment for major crops by using GIS-based multi-criteria approach in andit tid watershed, Ethiopia. Cogent Food & Agriculture, 4(1), 1470481. https://doi.org/10.1080/23311932.2018.1470481