
 ?Mathematical formulae have been encoded as MathML and are displayed in this HTML version using MathJax in order to improve their display. Uncheck the box to turn MathJax off. This feature requires Javascript. Click on a formula to zoom.
Abstract
Women empowerment in agricultural endeavors is deemed to be a powerful solution for improving global sustenance. Thus, this survey seeks to analyze the impact that women’s participation in agriculture has on the food security of 336 households from Anna Sorraa District, Guji zone of Oromia Region, Ethiopia. Quantitative and qualitative data were collected using household surveys, focus group discussions, and data collection methods using key informant interviews. Statistical measures such as the Women Empowerment in Agriculture Index and household calorie availability were used for descriptive analysis, while binary logistic regression and Propensity Scores Matching provided insights through econometric modeling. Results indicated that 58.6% of women’s were disempowered. Household calorie intake statistics revealed that 53.9% of those surveyed had food insecure households, while 46.1% had food intake available to them. A regression analysis found most factors, including age, female head of household, female education level, Husband’s education and annual household income positively impacted women empowerments—with one exception being whether subject lived near a market or not. Propensity Scores Matching further demonstrated that households with empowered women consumed 560.89 kcal/AE/day compared to those without such an asset. Research concluded that women’s involvement in agricultural activities is a crucial factor to improve food security in this area. Consequently, it was strongly recommended that government and other stakeholders focus their attention on empowering women. Additionally, further research should be conducted to gain an even more comprehensive understanding of how important female empowerment really is.
1. Background of the study
Hunger is an ever-increasing worldwide crisis. Recent statistics show that nearly 9.2% of the population suffers from severe nutritional deprivation. Asia accounts for over one billion people who are starving, while 676 million and 188 million individuals struggle with hunger in Africa and Latin America respectively (FAO, IFAD, UNICEF, W., and W, Citation2019). In East Africa, particularly Ethiopia, there is a continuous and substantial problem of lack of access to reliable sources of nutrition (Mohamed, Citation2017). A 2012 survey conducted by the FAO and other organizations revealed 3.2 million people were without adequate sustenance at that time. This number had risen to 4.5 million in 2015, 5.6 million in 2017, 8.13 million in 2019 (Food Security Information Network, Citation2020), and 12.1 million this past year (WFP and FAO, Citation2021).
Gender equality is deemed a major factor for global food security (Aziz et al., Citation2020). Various research studies, such as the one conducted by Quisumbing and Pandolfelli (Citation2010), demonstrate a strong connection between gender inequality and lack of access to food, specifically in the case of underprivileged or oppressed women who are often prevented from getting necessary resources. Moreover, according to the FAO on Gender equity in agriculture and rural development (Citation2009), females possess restricted opportunities for obtaining resources and their output is generally lower than their potential. The World Economic Forum (WEF), in its Global Gender Gap Report for 2019, ranked Ethiopia at 82nd out of 153 countries. The report also confirmed that the country also ranked 97th out of 156 countries in 2020. According to UN Women (Citation2018), women in Ethiopia face limitations in making decisions about matters affecting their lives and are strongly excluded from social, economic, and political spheres. They are also limited in accessing resources and services.
It has been widely established that food security can only be achieved through empowering rural women economically, socially, and politically while also achieving gender equality (Care, Citation2020; Van Dijk & Nkwana, Citation2021; Visser & Wangu, Citation2021). Statistics suggest that up to 30% of global agricultural productivity could be saved and 2.5–4% of agricultural output in underdeveloped countries eradicated with female access to productive resources. Moreover, a decrease of 12–17% in world hunger could be observed with equal opportunities for women. From a household standpoint, improved food allocation is more likely when a woman holds substantial decision-making power within her family unit—benefiting both health and happiness across all households involved.
Though many issues impede gender equality, including the technical, political and financial, the evidence in literature (e.g., CFS, Citation2017) is clear: social norms and systemic barriers are most responsible for preventing women empowerment and food security. Traditional roles assign men more paid work while assigning women a disproportionate amount of unpaid labor; it also restricts their access to assets, economic capital and markets—leading to low self-confidence among females. Additionally, research such as Didana’s (Citation2019) on socio-economic factors such as age, family size and education level has identified several elements which determine the degree of female empowerment within agriculture. These include things like household income, employment status, property ownership or even access to credit and market proximity.
The influence of female empowerment by way of agricultural labor is a priority in many development studies (Imai et al., Citation2014; Lépine & Strobl, Citation2013)., According to the findings reported in (Duflo, Citation2012), there is a clear alteration regarding wealth accumulation and spending habits between men and women. Women have been observed to provide far greater resources towards the health security of their loved ones. Despite arguments from Lépine and Strobl (Citation2013) and Imai et al. (Citation2014) that women empowerment is not a sufficient solution to ensure household food security, Akter et al. (Citation2017) suggest that this belief must be re-examined in light of contextual factors, particularly development policies and their implementations. It is essential, as argued by Akter et al., to consider both context-specific and multidimensional elements when assessing how much value can be attributed to women’s empowerment for aspects such as food security and nutrition. Furthermore, major policies on gender equality should take into account contextual circumstances in their formation according to Akter et al.‘s support.
It has been observed that there is a strong link between women’s empowerment and the outcome of family life, particularly in terms of food security. Studies like Schutter (Citation2013) and Sraboni et al. (Citation2014) have demonstrated this correlation by showing how decision-making power and assets enable women the leverage that makes them more likely for help secure household food security. Furthermore, Aziz et al. (Citation2020) found positive correlations with womens’ rights such as leadership ability, productivity in agriculture, ownership of assets, and time spent on farmland all having a significant impact on food security levels. Yet there is limited empirical evidence regarding this matter in Ethiopia due largely due in parts because most research studies have only focused on South Asia countries. Girma and Singh (Citation2019) did a study on factors affecting women’s empowerment in Ethiopia, and they found that many of the factors that affect women’s empowerment are socio-demographic and institutional. However, little attention has been given to economic factors such as asset ownership, and off-farm and non-farm income, which are assumed pertinent to ensuring household food security.
Yimer and Tadesse (Citation2016) link under the scope of the agriculture-food security development paths, women’s empowerment in agriculture contributes to household food security. These studies are primarily concerned with the relationship between women’s nutritional status and their ability to influence their children, thus they have limited scope in integrating women’s empowerment with overall household food security. In addition, it has been identified that there is a methodological gap in these studies: none of them have applied appropriate econometric models to evaluate the impact by using propensity score matching without considering unobserved factor covariates.
Accordingly, this study holds that an empirical and methodical investigation that established a fact-based relationship between women’s empowerment and farming household food security has contributed to a new body of knowledge relevant to the planning and implementation of effective development interventions.
2. Methods and materials
2.1. The study area’s description
2.1.1. Geographical location
The study was carried out in the Guji Zone, the Oromia National Region, and the Anna Sorra District. It is around 469 kilometers away from Addis Abeba. Arda Jila, Uraga, Bore, and Sidama are its neighbors to the east and the south. The administrative hub of the District is Irbaa Muda. Astronomically, the area lies between 380 and 390 degrees East and 60 to 70 degrees north.
2.1.2. Topography
Due to its varied topography, the District experiences a complex range of weather variations. The District’s numerous agro ecological zones are the main causes of the area’s complicated climate. In terms of vistas, the district’s elevation ranges from 1200 to 2800 meters above sea level.
2.1.3. The climate of the area
In lowland, middle, and highland regions of the district, there are agro ecological zones. 350–1830 mm of precipitation falls on the Sorra District annually, while the average annual temperature ranges from 11.2–210 c. The district’s two main rainy seasons are spring and fall, sometimes referred to as Ganna and Hagayya rains. Throughout the majority of the region, autumn brings both heavy and minor rains. In the spring, which runs from late February to early May, 78% of the annual rainfall is thought to fall. Autumn is the least rainy season in the area, with precipitation starting in September and lasting through November.
2.1.4. Economic activity
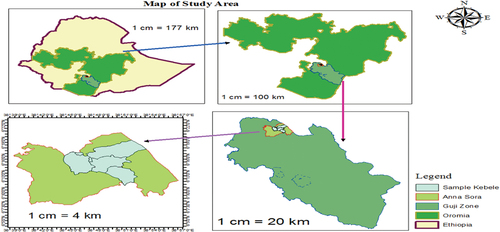
Enset is still a main food, and significant cereal crops are also farmed, including barley, wheat, maize (corn), teff, horse beans, and peas. Moreover, some parts of the district grow coffee. Moreover, the main economic activity in this District is livestock. In general, agriculture was the main industry in their region (Figure ).
Figure 1. Map of the study area.
2.1.5. Population and demographic characteristics
According to CSA (Citation2006), the District has a total population of 132,000, made up of 64,221 men and 67,779 women. 13601 people, or 8.15% of the total population, reside in urban areas, which is less than the average zone of 11.6%. According to estimates, Anna Sora has 1,196.88 square kilometers of population density, or 110.3 people per square kilometer, which is greater than the Zonal average of 21.1. The five main ethnic groups identified in Anna Soora are Oromo (86.92%), Amhara (4%), Gedeo (3.81%), Sidama (3.42%), and Siltee (0.99); all other ethnic groups make up 0.86% of the population. 86.41% of the respondents said that Oromiffa was their first language, followed by Amharic (5.57%), Gedeo (3.63%), and all other known first languages (4.39%). A traditional religion was practiced by 17.62% of the population, followed by 19% of Muslims, 8.47% of Ethiopian Orthodox Christians, 4.29% of Catholics, and 1.33% of Protestants (CSA, Citation2006).
2.2 Research design
Using quantitative and qualitative methods, this study used a cross-sectional research design to investigate the impact of women empowerment in agricultural work on household food security in the study area.
2.3 Study population, selection of the sample size and sample design
The Anna Sorra District was specifically selected for this study because it is one of the most heavily populated and agriculturally based regions. Subsequently, four kebeles were randomly chosen from a total of 20 kebeles within the district. Finally, 336 samples of female-only households were identified through a proportional probability sampling technique that accounted for varying household numbers among the kebeles. A straightforward random selection approach was then employed to acquire these samples from each respective region.
Utilizing Yemane’s equation, it is possible to determine a reliable sample size for any given survey. To ensure no more than a 5% margin of error, consider applying this formula to establish an appropriate sample size:
Where;
n is the sample size.
N represents all the target populations.
α = level of precision (sampling error) at a 5% level of significance, the error margin. The 95 percent level of confidence was chosen since the practical method significantly lowers the likelihood of nonresponse.
Therefore, the sample size was established using the Yamane method from a total of four Kebele families out of 20 rural Kebeles in the Anna Sorra District:
n = 2,102/1+ (0.052)* 2,102 = 336. Israel (Citation1992)‘s sample size determination formula was applied to divide the sample size among each Kebele. That is ns= (Kn/Ks)*n, where Ks is the sample size from each kebele, Kh is the population of each kebele as a whole, and Ks is the population of all the kebeles combined.
2.4 Data type and sources
Primary and secondary sources of qualitative and quantitative data were consulted to address the research question of the study. Respondent women provided primary data on a range of topics, including household issues, all other variables related to empowerment, and domains affecting women’s empowerment. In addition, questions were raised about the food security situation in the study area. Secondary data were also used to improve the amount of supporting evidence for the study. Data were collected from reports, articles, magazines, books, bulletins, statistical reports, government documents, published and unpublished materials (theses), websites, and files of district women and child affairs officers, agriculture office staff, and development agents.
2.5 Methods of data collection
The primary data was obtained through an interview utilizing a schedule to collect information from women household. Structured questionnaires were formulated and distributed to 336 respondents in order to obtain quantitative data.
2.6 Measuring of women empowerment status
In 2012, to measure economic empowerment and gender parity, OPHI developed a Women Empowerment in Agriculture Index (WEAI). Because true empowerment is complex, one solitary sign produced from this index was not sufficient. According to Malapit and Quisumbing (Citation2015), their research sought to uncover any associations between women’s empowerment, food security, and agricultural growth. In order to identify those who were truly empowered within their data set, Alkire et al. (Citation2012) decided that an individual must achieve sufficiency in more than 80% of all ten indicators used in WEAI; these included; participation in production decisions, relative autonomy in production decisions, ownership of land and property purchase sale and transfer of property access to credit control over use of income group membership public speaking workload chapter. To break up these categories further—as suggested by Alkire et al. (Citation2013)
2.7 Measuring food security status
Using the Adult Equivalent (AE) method, which is based on daily calorie consumption at a per-household level, food security in the study area was evaluated. Researchers gathered information on what types and quantities of food each sampled family consumed over seven days. These units were converted to a standard quantification and then transformed into kilocalories per AE. Finally, the overall daily kcals for each family were compared to Ethiopia’s government-defined minimum sustenance requirement of 2,200 Kcal/AE. Any households that met this cutoff were deemed “food secure”, while those that fell under it were marked as “food insecure”.
2.8 Binary logit model
Popular consensus leans towards the use of Logit and Probit models for examining the relationship between household characteristics and a dichotomous response variable. Owing to how probabilities are restricted between 0 and 1, these models are seen to trump the Linear Probability model. Further, they are most beneficial in determining nonlinear associations between the response and explanatory variables. Gujarati (Citation1995) states that while both methods have similar formulae; one key difference is seen in that logistic curves approach axes at a faster rate than their probit counterparts. In conclusion, it is simply an issue of mathematics when deciding which method best suits one’s needs.
The choice of the logit model over the probit model was made here. The logistic distribution is advantageous when analyzing dichotomous outcomes due to its versatility and ease of use, which renders it capable of producing meaningful interpretations as outlined by Hosmer et al. (Citation1989). Therefore, Gujarati (Citation1995) proposed a binary logit model, which this study adopted despite that both models could yield comparable results. Specifically, the binary logit model is described as:
EquationEquation 8(8)
(8) can be expressed by:
Where; Zi=β0+β1X¡
If Pi is the probability of being women empowered and the probability of disempowering 1- Pi, which is expressed, follows in equation 3.
Equation 4 is obtained by dividing the empowered to disempower:
8.1.1. Therefore
The odds ratio (the ratio of the probability that an individual would choose an alternative). Pi is the probability of women empowered from 0 to 1.
Taking natural logarithms of =
Where;.
Zi is a function of k-independent variables β0 = is the intercept or constant term
Xi = ith independent variable K = represents number of independent variables
Xk = Total number of independent variables.
2.9 Propensity score matching (PSM)
The rationale behind the use of Propensity Score Methods (PSM) was utilized in this study as a way of generating matched pairs between empowered and disempowered households. This single score allowed for the balance of observed covariates through careful pairing. The propensity score is based on the probability that someone will receive treatment, dependent on certain measurable Covariates. Subsequently, a matching pair could be developed for respondents with similar observable characteristics even without baseline data:
The propensity score method (E(x)) is a way to create balance between treated and untreated women respondents. It assigns a probability (P) based on whether they were in the treatment group or control group (D = 1). This will help ensure that any pre-test covariates used to calculate the propensity score are balanced, thus preventing any bias when estimating the effect of treatment. Caliendo and Kopeinig (Citation2008) identify certain steps needed for PSM such as predicting propensity scores, selecting a matching algorithm, restricting common support areas, testing matching quality or balancing tests and conducting sensitivity analysis.
2.10 Definition of variables and working hypothesis
The following variables were defined and hypothesized based on the analysis of the existing conditions of the study area.
2.11 Outcome variable
In this study, the outcome variable is food security which is continuous and measured in the calorie acquisition method, the resulting average kcal consumed per adult equivalent per day was compared to the Ethiopian government’s daily minimum subsistence requirement of 2,200 Kcal per AE (MoFED Ministry of Finance and Economic Development, Citation2012). As a result, the value of the minimum subsistence requirement was used as a cut-off point for determining if a household is food secure or food insecure, with a household being considered food secure if it meets this requirement and insecure if it does not.
2.12 Dependent variable
In this study, women empowerment was taken as a dependent variable, which is binary/dummy − 1 for women who are empowered and 0 otherwise. According to Alkire et al. (Citation2012) and Alkire et al. (Citation2013), female empowerment required adequate performance in more than 80% of indicators. For analysis purposes, any combination from 0 to 100% adhering to international standards set by (Alkire et al., Citation2012: 13) was acceptable; however, a cutoff point of 20% was employed.
2.13 Independent variables
The independent or explanatory variables are variables that tend to explain and influence the dependent variable. The explanatory variables that were hypothesized to affect women’s empowerment are presented in table below.
Table 1. Study sample size distribution proportion to respective kebeles
3 Results and discussion
3.1 Level of women empowerment
To analyze the difference between empowered and disempowered women, this section examines the Women Empowerment in Agricultural Index (WEAI). The WEAI for the study area is 0.737, which is calculated using five dimensions of empowerment. This value falls below the Bangladesh pilot study carried out by Malapit et al. (Citation2017) in southern and southwestern regions, yet is higher than that observed in Guatemala and lower than results obtained in Uganda’s trial studies according to Alkire et al. (Citation2012). Table and Table present details on women’s empowerment as identified through agricultural index measurement methodologies. A recent headcount ratio has revealed that 58.6 percent of women are disempowered, compared to 41.4 percent who are empowered. This is higher than in Uganda (58%), Guatemala (56.7%), and Nepal (58%) but lower than in Bangladesh (61%), and Pakistan (83%). Various studies on Ethiopian women have shown different figures with Yimer & Tadesse finding 69%, Didana 65.58%, and Belete & Melak 79%.
Table 2. Summary of definitions, measurement, and hypothesis of explanatory variables
Table 3. Level of women empowerment
Overall, 26.3% of women are disempowered in five domains of empowerment, which is higher than the comparable measure of disempowerment in Bangladesh (25.4%) and Uganda (21.1%) but lower than women’s disempowerment index of Guatemala (31%) by (Alkire et al., Citation2013) and in Amhara national regional state of Ethiopia (30.81%) by (Belete & Melak, Citation2020). On average, women who are not yet empowered have inadequate achievement in 45% of the domains. This infers that the disempowered woman had achieved adequacy in 55% of the 5DE indicators.
Table reveals a breakdown of 5DE indicating that women suffer from a high degree of disempowerment. Approximately 27% have no decision-making input in production, and about 25% are have lack of sole or joint decision-making autonomy over productive decisions. Evidence also suggests that 35%, 65%, and 36% respectively lack control over ownership of land, purchase/sale/transfer of assets, and access to credit—which serves as significant barriers for them in leveraging their resources, making market decisions, and using credit. Furthermore, it appears that a staggering 14% do not wield any authority over how income is distributed; most likely due to men controlling more wealth in this area.
A recent study revealed that more than a fifth of women are not part of any group and almost the same percentage doesn’t have the means to make public speeches. Furthermore, those who engage in group activities or express themselves publicly face restrictions when it comes to advancing in leadership roles due to gender biases present in social service institutions. The results also point towards a difference between workloads as well as input production decision-making among men and women, with 30% of female participants declaring an average working day of over 10.5 hours without any leisure time in rural areas. This is echoed by empirical findings gathered from southern Guatemala (Alkire et al., Citation2013) and (Malapit & Quisumbing, Citation2015). Evidently, this puts women at risk of being further marginalized within the production process.
3.2 Factors influencing women empowerment
Table and Table provide us with a summary of the mean values and the results of t-tests and χ2 tests in order to assess the impact of factors on women’s empowerment.
Table 6. Descriptive analysis result of dummy variables affecting women empowerment
3.2.1. Descriptive statistics for continuous and Dummy variables
3.3. Econometric model analysis results of on factors affecting women empowerment
VIF and CC were used to determine whether or not continuous independent variables were multicollinearity before moving on to the econometric estimation. Multicollinearity is the occurrence of two or more explanatory variables in a regression model and it is a sign that the independent variables are not independent. Multicollinearity affects the least squares estimators and renders them inefficient. The problem of multicollinearity must therefore be regarded as a “block mark” that reduces the confidence in conventional tests of least squares estimators. A decision rule for the multicollinearity test for the model stated is a variable whose VIF value is greater than 10 indicates the existence of a multicollinearity problem. As it is observed there is no multicollinearity between the explanatory variables. Since there is no multicollinearity found, this data set should be used for future research purposes because it can provide information about any future studies in which multicollinearity might occur (Table ).
3.3.1 Age (AGE)
It was hypothesized that age would positively influence the dependent variable. The Binary logit regression model showed that age had a positive effect on the dependent variable and was statistically significant at the 1% level. The odds of women’s empowerment increased by a factor of 1.068 for every year of age. Thus, it can be concluded that with increasing age, the probability of being empowered will also increase in this area. This result is consistent with those reported by Gebrat (Citation2013), Ahmed (Citation2013), Taye (Citation2014), Asmare et al. (Citation2017) and Didana (Citation2019). However, it opposes those of Mengistie et al. (Citation2014) and Tefera and Beyan (Citation2014), which demonstrated that age negatively affected female empowerment in agricultural activities.
3.3.2 Women head of household (HEAD)
It is statistically significant that a woman being head of the household positively affects women’s empowerment status, as evident by the 5% significance level and 1.85 odds ratio. This means that women whose households are headed by them have an increased chance of being empowered by 1.85 times. This likely happens because when a woman becomes head of the household, her responsibilities in making decisions for the family become more prominent, and thus their empowerment increases. This conclusion is in agreement with Moepeng and Tisdell (Citation2008), and Machio et al. (Citation2020), who found that having a husband decreases the chance of women’s empowerment while being widowed increases it compared to single status; however, this contradicts Chant (Citation2004).
3.3.3 The educational level of women respondents (EDUCWOMEN)
Education equips people with knowledge and skills essential to society, which is clear. Therefore, the more educated society is, the more likely it will be involved in various economic activities. Education is recognized as an essential prerequisite for women’s empowerment because it provides them access to and control over resources and information, assisting them in improving their lives and rejecting discrimination and subordination ideologies. The logit model results mentioned that the level of education of women was significantly correlated with their empowerment at a 1% significance level. The odds ratio indicated that when the number of years of schooling rises by one year, the chances of empowering women to increase by 1.144. This corroborates findings from Alkire et al. (Citation2012); Asmare et al. (Citation2017); Achandi (Citation2019), and Didana (Citation2019), that there is an important link between education and empowerment. Though this contradicts Ahmed’s (Citation2013) and Tefera and Beyan (Citation2014)‘s studies; no final conclusion can be drawn on the relationship between women’s education and their empowerment (Table ).
3.3.4. Education of husband (EDUHUSBAND)
Analysis of the logit model showed that husbands’ education level is positively associated with women’s empowerment at a 10% confidence level. The odds ratio for women’s empowerment increases by 1.1 when the number of years of schooling for men increases by one year; this suggests that women whose husbands have been educated have a higher degree of empowerment, compared to those whose husbands have not received schooling, after taking into account other variables. This finding is in line with results from research conducted in Myanmar (Thandar et al., Citation2020).
3.3.5. Distance from the nearest market (DSFNRMKT)
The research study showed that the distance from the nearest market had a negative effect on women’s empowerment, which was found to be statistically significant at a 1% probability level. As the distance from the market increased by one kilometer, the odds ratio for women’s empowerment decreased by 0.854. This implies that women living closer to markets were more likely to be empowered than those living farther away. This could be due to an increased awareness of their disempowerment through access to media, cross-cultural interactions, and general public knowledge. These results are in agreement with previous studies conducted by Achandi and Didana (Citation2019). However, this finding contradicts the results of Tefera and Beyan (Citation2014), suggesting there is no clear connection between distance from the market center and women’s empowerment. This notion was further supported by data collected from focus groups and key informant interviews with two females aged 56 and 42 from Kochore Besrisa kebele. From this, we can conclude that residence near markets is beneficial for households since it gives them access to information regarding market prices and quantity, leading to an increased likelihood of women’s empowerment.
3.3.6. Annual farm income (AHHFINCM)
Rural agricultural activities, such as different crops and livestock income sources, are used by respondents to supplement their incomes. It’s been theorized that these sources of income have a positive and significant effect on people’s empowerment in various development initiatives. This was supported by the model output in the study, showing that farm income had a positive and significant impact on women’s empowerment at a 10% probability level. The odds of women being empowered increased by one for every additional birr in income. This is likely due to higher-income households having greater bargaining power within the home, access to economic sectors, and mobility in their communities. This finding is consistent with other studies done by Gebrat (Citation2013), Mengistie (Citation2013), Asmare et al. (Citation2017), and Achandi (Citation2019).
3.3.7. The income from non/off farm (NON/OFFFRMINC)
The results of the binary logit regression model show that non/off-farm income has a positive effect on women’s empowerment and is statistically significant at the 5% level. The odds ratio indicates that having such income increases the likelihood of being empowered by a factor of 1.84. This is likely because women who have non/off-farm income tend to have more control over their earnings than those who rely solely on agriculture-related activities. This was in line with expectations, and these findings are supported by research conducted in Ethiopia by (Asmare et al., Citation2017; Didana, Citation2019), yet do not match those of (Gebrat, Citation2013).
3.3.8. Ownership property (OWNPPTY)
The binary logit regression model has indicated that the ownership of property is associated with an increase in women’s empowerment, and this relationship is statistically significant at a 5% level according to the odds ratio of 1.74. This suggests that women are more likely to be empowered if they own property, particularly land, and livestock, in rural societies, which are seen as indicators of prosperity and reputation. Consequently, it can be inferred that rural women’s access to owned property has a major effect on their empowerment. Didana (Citation2019) discovered similar findings related to property ownership and women’s empowerment. On the other hand, Thandar et al. (Citation2020) found no link between household ownership and overall female empowerment (Table ).
3.4. Food security status of households
In this study, the household caloric acquisition method was applied to measure household food security in terms of the physical consumption of food items. The amount of energy available for a household was compared with the minimum subsistence requirement per AE per day (2,200 kcal) according to MoFED (Citation2012). Results indicated that mean energy intakes for both food-insecure and secure households were 2006.748 Kcal/AE/day and 2925.686 Kcal/AE/day respectively. The minimum and maximum energy intakes for food-insecure households were 843.4714 Kcal and 2199 Kcal respectively (Table ), while those for food-secure households ranged from 2202.1 Kcal to 4867.775 Kcal. The average energy intake amongst all sample households was 2430.663 kcal and the t value (19.2653) proved that there is a notable difference between energy intakes of food-insecure/secure households.
Table 4. Women’s disempowerment decomposed by domains and indicators
3.4.1. Classification and decomposition by empowerment and food status
Table reveals the food security status of households based on women’s empowerment status which was assessed using descriptive analysis. The percentages of food insecure and secure households were calculated to be 53.9% (42.3 from disempowered and 11.6 from empowered) and 46.1% (16.40 from disempowered and 29.8 from empowered) respectively, with the minimum calorie intake being 2,200 Kcal/AE per day as recommended in MoFED (Citation2012). The chi-square results indicate that empowering women makes a significant difference in terms of household food security as measured by calorie intake per adult equivalent; in terms of calorie intake, empowered women households tend to have higher calorie intakes than disempowered ones.
Table 5. Descriptive analysis of continuous variables factors affecting women empowerment
3.5. Impact of women empowerment on households’ food security
3.5.1. Determining common support region
The common support region should be applied to the distribution of propensity scores for the treated and untreated groups after estimation. As seen in Table , the predicted scores used to match those who were both empowered and disempowered range from 0.0292167 to 0.910523. The propensity scores for disempowered people vary between 0.097270 and 0.839983, while the scores for empowered individuals range from 0.02921 to 0.910523 - meaning that the common support region, where the propensity scores of both groups were found, was between 0.0923964and 0.839983. As a result, 7 observations were removed from the treated group and 17 were taken away from the untreated group during the impact assessment process, totaling 24 or 7.14% of participants removed overall.
Table 7. Logit model analysis results of on factors affecting women empowerment
Table 8. Food security status of household
Table 9. Classification and decomposition by empowerment and food status
Table 10. Distribution of estimated propensity scores
Table details the amount of support given by the treated and untreated groups for the outcome variables. Of the 312 households surveyed, 92.86% demonstrated support from both treated and untreated groups. This data suggests that both Empowered (132) and Disempowered (180) groups have similar behaviors and matches. The decisions concerning on and off-support observations are based upon the summarized p-scores in each group, which shows how many units is off-support.
Table 11. Common support region
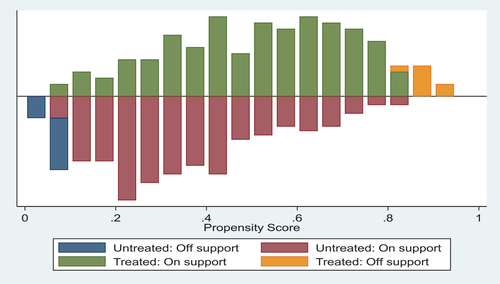
The diagram below utilizes color codes to distinguish between regions of common support. The upper green region represents the treated support observations, the upper yellow represents treated off support, the lower blue shows untreated off support and the lower red indicates untreated on support. It is evident that the vast majority of observations are concentrated within the region’s common support, verifying that there is enough overlap between treated and untreated components to effectively find matches (Heckman et al., Citation1998). This means that the assumption of common support has been satisfied (Figure ).
Figure 2. Common support for propensity score.
3.5.2. Testing the balance of propensity score and covariates
Once the best matching algorithm was chosen, the next step was to check the balancing of propensity score and covariate by employing the selected matching algorithm. To assess the power of the estimations’ balancing, different tests such as reduction in mean standardized bias between matched and unmatched households, equality of means using t-test, and chi-square test for joint significance of variables were used. The mean standardized bias prior to matching ranged from −30.3% to 99.5% in absolute value; however, after matching, these differences decreased from −6.1% to 6.9%. This is lower than the critical level (20%) established by Rosenbaum and Rubin (Citation1985). The treatment and control samples after matching have a high degree of balance in covariates which can be utilized during the estimation phase. The t-test further showed that after matching all covariates became insignificant, thus certifying an optimal balance for all covariates through propensity score matching.
3.5.3. Propensity score matching: quality test
After matching, the standardized mean difference for overall variables utilized in the propensity score decreased from 30.4 % to 4.1 %, which can be seen in Table . The joint significance of covariates was always rejected after matching, whereas it never was before. The low pseudo R2, insignificant p-values of the likelihood ratio tests, and high total bias reduction show that the specified propensity has been successful in balancing the covariates between treated and control groups.
Table 12. Propensity score matching: quality test
3.5.4. Estimating treatment effect on treated
The Kernel Matching (KM) result has demonstrated the statistically significant effect of empowering women on household food security in daily kcal consumption per adult equivalent per day. On average, households with empowered women achieved 560.89 kcal/AE/day more than those without empowerment (Table ). This shows that empowered women had higher daily calorie intake compared to those who were not. This is further corroborated by studies conducted in Bangladesh by Sraboni et al. (Citation2014); Ethiopia by Yimer and Tadesse (Citation2016); Tanzania by Gitungwa (Citation2018), Sinharoy et al. (Citation2019) and rural Azad Jammu & Kashmir, Pakistan by Aziz et al. (Citation2020), as well as a qualitative survey in Tanzania by Galiè et al. (Citation2019). In contrast, Galiè et al. (Citation2019) quantitative study in Tanzania concluded no significant relationship between women’s empowerment and household food security.
Table 13. The result of average treatment effect on the treated
6.. Conclusions and Policy implications
Women are disempowered, with an empowerment level of only 41.4% across the five domains. Limited access to assets, increased workloads, and lack of control over income are some of the areas where they may be particularly disadvantaged. More work needs to be done to empower women through different means. Strategic improvements in each indicator that contribute to their disempowerment, and understanding how they relate to empowerment, are key to achieving greater empowerment across all aspects. These findings may assist policymakers in understanding how to empower women through agriculture, helping form policies that would both boost women’s empowerment and drive economic growth in District.
This study indicates that older women are more empowered than younger women, with age having a significant positive effect on empowerment. To improve empowerment for future generations, it would be beneficial if the Anna Sorra District Women’s Affairs focused on educating young females about empowerment and its importance to them and society. With the majority of economic activity in their hands, providing them with education and training to better understand how female empowerment is beneficial could be the best way to go.
The study revealed that there was a strong correlation between empowerment and educational level; this is because better education leads to more positive attitudes and higher self-confidence in women. For this reason, society should prioritize the education of the girl child with the expectation that this will pave the way for female empowerment in the future. Additionally, both the Ministry of Education and the Ministry of Women & Children’s Affairs should devise more effective education programs for rural women.
Findings showed that non-farm/off-farm income had a positive, noteworthy effect on female empowerment. Subsequently, Anna Sorra should set up more frequent, consistent non-farm/off-farm operations, as well as instruct and aid local women in job creation and increasing earnings from those activities.
It is evident that owning property has a positive effect on the empowerment of rural women. This study supports the concept that female empowerment requires the accumulation of personal wealth. Therefore, women should aim to get involved in more productive activities to amass financial gains, and it is desirable for society to receive advice and guidance to build up their wealth by inheriting it from their families.
The study showed that being far from the nearest market had a detrimental effect on women’s empowerment. Women in rural areas may not be as aware of their lack of empowerment due to a lack of access to media, cross-cultural interactions, and public knowledge. A long distance from markets further hampers women’s empowerment, so it is essential that roads and markets are built that allow them to access these resources. Governmental and non-governmental organizations should take action in improving rural infrastructure and providing social media services in order to promote women’s empowerment.
It needs monitoring and evaluation to make sure that women benefit. For instance, feedbacks from focus groups suggest that women’s empowerment is mainly hindered by their heavy workloads. Therefore, project investments and related interventions should take steps to limit the workload of women.
The evaluation of this study’s impact revealed that giving women in agricultural activities more power had a significant positive effect on household food security. Households that allowed women to take part in agricultural pursuits saw the most advantages. Therefore, investing in women’s empowerment farming-wise is essential for gender equality and food security even though large gender disparities still persist in the area. To counter these disparities, broad, transformative strategies must be implemented. This research drew on a wealth of evidence to reveal which factors support or impede women’s empowerment, as well as potential policy recommendations. Consequently, further research needs to be conducted to better understand the importance of empowering women.
Authors’ contributions
GB design the research, preparing drafts analyzed and interpreted the data. AA and AE made significant contributions in review, comment and editing from the draft paper to the report. All authors read and approved the final manuscript.
Ethical approval and consent to participate
Ethical clearance was obtained from Jimma University and from the districts of study area. About the study was fully explained to the study participants to obtain consent and any information kept confidential.
Acknowledgments
This study authors would like to thank respondents of the study for their willingness and patience to be part of this research. We would also extend my grateful thanks Jimma University for sponsoring the data collection and other expenditure for this research
Disclosure statement
No potential conflict of interest was reported by the author(s).
Data availability statement
The data will be available upon request from the first author.
Additional information
Funding
Notes on contributors

Guduro Beriso
Guduro Beriso (Mr) is an academic staff of Jimma University Department of Rural Development and Agricultural Extension. He holds a bachelor’s degree in Rural Development and Agricultural Extension and MSc degree in Rural Development from Jimma University. His research focus includes food security, technology adoption, marketing and climate change.
Abayineh Amare
Abayineh Amare Assistant Professor of Environment and Development Studies Jimma University, College of Agriculture and Veterinary Medicine, Department of Rural development and Agricultural Extension. Research Fellow at African Climate Leadership Program (AfriCLP) University of Nairobi. His research mainly focuses on food security, livelihood, gender, Environment, and climate change.
Adugna Eneyew
Adugna Eneyew (Associate Professor) is a lecture at Jimma University Department of Rural Development and Agricultural Extension. His research mainly focuses on sustainable livelihoods, food, and nutrition security, land policy, adoption of agricultural innovations, climate change, value chain analysis, and gender analysis.
References
- Achandi, E. L. (2019). Women Empowerment, Technical Efficiency and Market Participation : A Study of Smallholder Rice Farmers in Kilombero District, Tanzania. [ Ph.D Dissertation presented to] University of Dar es Salaam.
- Ahmed, M. (2013). Microfinance and Rural Women’s Empowerment: A Cross-Sectional level Analysis (Evidence from Rural Woreda’s of Harari Region). [Master Thesis Mekele University],
- Akter, S., Rutsaert, P., Luis, J., Htwe, N. M., San, S. S., Raharjo, B., & Pustika, A. (2017). Women’s empowerment and gender equity in agriculture: A different perspective from Southeast Asia. Food Policy, 69, 270–22. https://doi.org/10.1016/j.foodpol.2017.05.003
- Alkire, S., Meinzen-Dick, R., Peterman, A., Quisumbing, A., Seymour, G., & Vaz, A. (2013). The women’s empowerment in agriculture index. World Development, 52, 71–91. https://doi.org/10.1016/j.worlddev.2013.06.007
- Alkire, S., Meinzen-Dick, R., Peterman, A., Quisumbing, A. R., Seymour, G., & Vaz, A. (2012). The women’s empowerment in agriculture Index. Poverty, Health & Nutrition Division, International Food Policy Research Institute, IFPRI Discussion Paper No. 01240.
- Asmare, A., Ketema, A., & Taddesse, M. (2017). The impact of microfinance on women’s empowerment in bench Maji Zone. International Journal of Management, IT & Engineering, 7(9), 50–62.
- Aziz, N., Nisar, Q. A., Koondhar, M. A., Meo, M. S., & Rong, K. (2020). Analyzing the women’s empowerment and food security nexus in rural areas of Azad Jammu & Kashmir, Pakistan: By considering the sense of land entitlement and infrastructural facilities. Land Use Policy, 94, 104529. https://doi.org/10.1016/j.landusepol.2020.104529
- Belete, B., & Melak, S. (2020). Impact of small-scale irrigation technology on women empowerment in amhara national regional state of Ethiopia. Cogent Economics & Finance, 8(1), 1837440.
- Caliendo, M., & Kopeinig, S. (2008). Some practical guidance for the implementation of propensity score matching. Journal of Economic Surveys, 22(1), 31–72. https://doi.org/10.1111/j.1467-6419.2007.00527.x
- Care. (2020). On Gender equality and women’s empowerment in the context of food security and nutrition.
- CFS. (2017). Forum on women’s empowerment in the context of food security and nutrition.
- Chant, S. (2004). Dangerous equations? How female-headed households became the poorest of the poor: Causes, consequences, and cautions. IDS bulletin, 35(4), 19–26.
- CSA (Central Statistical Authority). (2006). CSA (Central Statistical Authority).
- Didana, A. C. (2019). Determinants of rural women economic empowerment in agricultural activities: The case of Damot Gale Woreda of Wolaita Zone, SNNPRS of Ethiopia. Journal of Economics & Sustainable Development, 10(3), 30–49.
- Duflo, E. (2012). Women empowerment and economic development. Journal of Economic Literature, 50(4), 1051–1079. https://doi.org/10.1257/jel.50.4.1051
- FAO, IFAD, UNICEF, W., and W. (2019). Food security and nutrition in the World 2019, IEEE Journal of Selected Topics in Applied Earth Observations and Remote Sensing.
- Food Security Information Network. (2020). Global report on food crises. Technical report.
- Galiè, A., Teufel, N., Girard, A. W., Baltenweck, I., Dominguez-Salas, P., Price, M. J., Jones, R., Lukuyu, B., Korir, L., Raskind, I., & Smith, K. (2019). Women’s empowerment, food security, and nutrition of pastoral communities in Tanzania. Global Food Security, 23, 125–134. https://doi.org/10.1016/j.gfs.2019.04.005
- Gebrat, K., (2013). Determinants of Women’s Participation in Micro Finance and their Decision Making in Household Income. A case of Amhara credit and saving Institution (ACSI), [ Doctoral dissertation], Mekelle University.
- Gender equity in agriculture and rural development. (2009). A quick guide to gender mainstreaming in FAO’s new strategic framework.
- Girma, B., & Singh, M. (2019). Factor affecting women empowerment in Ethiopia public universities: Leadership perspectives. International Journal of African and Asian Studies, 56, 63–66. https://doi.org/10.7176/JAAS/56-05
- Gitungwa, H. (2018). The Relationship of Male and Female Pastoralist Income with Household Food Security and Nutrition Status in Tanzania: Maasai, Sukuma, and Barabaig Ethnic Groups. [ Dissertations and Theses in Agricultural Economics].
- Gujarati, D. N. (1995). Basic econometrics, McGraw-Hill, New York. Basic econometrics (3rd ed.). McGraw-Hill.
- Heckman, J. J., Ichimura, H., & Todd, P. (1998). Matching as an econometric evaluation estimator. The Review of Economic Studies, 65(2), 261–294. https://doi.org/10.1111/1467-937X.00044
- Hosmer, D. W., Jovanovic, B., & Lemeshow, S. (1989). Best subsets logistic regression. Biometrics, 45(4), 1265–1270. https://doi.org/10.2307/2531779
- Imai, K. S., Annim, S. K., Kulkarni, V. S., & Gaiha, R. (2014). Women’s empowerment and prevalence of stunted and underweight children in rural India. World Development, 62, 88–105. https://doi.org/10.1016/j.worlddev.2014.05.001
- Israel, G. D. (1992). Sampling the evidence of extension program impact. University of Florida Cooperative Extension Service, Institute of Food and Agriculture Sciences, EDIS.
- Lépine, A., & Strobl, E. (2013). The effect of women’s bargaining power on child nutrition in rural Senegal. World Development, 45, 17–30. https://doi.org/10.1016/j.worlddev.2012.12.018
- Machio, P. M., Kariuki, P. C., Njoroge, M. M., & Ng’ang’a, A. M. (2020). Social Capital and Women's empowerment in Kenya: Case study of Murang'a county.
- Malapit, H. J., Pinkstaff, C., Sproule, K., Kovarik, C., Quisumbing, A. R., & Meinzen-Dick, R. S. (2017). The abbreviated women’s empowerment in agriculture index (A-WEAI).
- Malapit, H. J. L., & Quisumbing, A. R. (2015). What dimensions of women’s empowerment in agriculture matter for nutrition in Ghana? Food Policy, 52, 54–63. https://doi.org/10.1016/j.foodpol.2015.02.003
- Mengistie, M. (2013). Analysis of factors influencing rural women participation in performing household farm management practices: the case of Enebsiesarmidir District, East Gojjam Zone, Ethiopia. [ Master Thesis Haramaya University].
- Mengistie, Z., Woldeamanuel, Y., Asrat, D., & Adera, A. (2014). Prevalence of bacterial vaginosis among pregnant women attending antenatal care in Tikur Anbessa University Hospital, Addis Ababa, Ethiopia. BMC Research Notes, 7, 1–5.
- Moepeng, P., & Tisdell, C. (2008). The socio-economic situation of female heads and poor heads of households in Rural Botswana: A village case study. 48, 1–32.
- MoFED (Ministry of Finance and Economic Development). (2012). Assessing progress towards the MDGs. MDGs report. Addis Ababa,
- Mohamed, A. A. (2017). The food security situation in Ethiopia: A review study. International Journal of Health Economics and Policy, 2(3), 86–96.
- Quisumbing, A. R., & Pandolfelli, L. (2010). Promising approaches to address the needs of poor female farmers: Resources, constraints, and interventions. World Development, 38(4), 581–592. https://doi.org/10.1016/j.worlddev.2009.10.006
- Rosenbaum, P. R., & Rubin, D. B. (1985). Constructing a control group using multivariate matched sampling methods that incorporate the propensity score. The American Statistician, 39(1), 33–38. https://doi.org/10.1080/00031305.1985.10479383
- Schutter, O. (2013). Gender equality and food security: Women’s empowerment as a tool against hunger. Asian Development Bank.
- Sinharoy, S. S., Waid, J. L., Ali, M., Yount, K. M., Thilsted, S. H., & Girard, A. W. (2019). Resources for women’s agency, household food security, and women’s dietary diversity in urban Bangladesh. Glob Food Sec, 23, 1–8.
- Sraboni, E., Malapit, H. J., Quisumbing, A. R., & Ahmed, A. U. (2014). Women’s empowerment in agriculture: What role for food security in Bangladesh? World Development, 61, 11–52. https://doi.org/10.1016/j.worlddev.2014.03.025
- Taye, C. (2014). The impact of microfinance financial services on the economic empowerment of women: The case study of wisdom micro-financing institution s.c, at woliso worda. [ Master thesis St], Mary’s university.
- Tefera, T., & Beyan, Z. (2014). Assessment of Women Empowerment Through Public Agricultural Extension Services: The Case of Meskan Woreda in the Southern Nations, Nationalities and Peoples’ Region of Ethiopia. [ Doctoral dissertation], Haramaya University.
- Thandar, M., Moe, H. H., & Naing, W. (2020). Women’s empowerment among married women aged 15 to 49 in Myanmar. Asia-Pacific Sustainable Development Journal, 2019(2), 57–81. https://doi.org/10.18356/c0408e57-en
- UN Women. (2018). The Gender Gap in agricultural productivity in Sub-Saharan Africa: C,auses. Costs and Solutions, 11, 5.
- Van Dijk, H. G., & Nkwana, H. M. (2021). The face of food Insecurity is female: A post-colonial feminist argument for rural women. African Journal of Gender, Society and Development (Formerly Journal of Gender, Information and Development in Africa, 10(1), 99–116. https://doi.org/10.31920/2634-3622/2021/v10n1a5
- Visser, J., & Wangu, J. (2021). Women's dual centrality in food security solutions: The need for a stronger gender lens in food systems' transformation. Current Research in Environmental Sustainability, 3, 100094.
- WFP and FAO. 2021. Hunger hotspots. FAO-WFP early warnings on acute food insecurity: March to July 2021 outlook. Is available at http://www.fightfoodcrises.net and https://www.fsinplatform.org.
- Yimer, F., & Tadesse, F. (2016). Synopsis: Women’s empowerment in agriculture and dietary diversity in Ethiopia (No. 55). International Food Policy Research Institute (IFPRI).