
 ?Mathematical formulae have been encoded as MathML and are displayed in this HTML version using MathJax in order to improve their display. Uncheck the box to turn MathJax off. This feature requires Javascript. Click on a formula to zoom.
Abstract
This study aims to analyze the short and long-term transmission of rice prices at the farmer and consumer levels in West Java Province. This study uses monthly data on rice prices at the producer (farmer) and consumer levels from 2014–2020 in West Java Province, Indonesia. Meanwhile, the method used in this study is Error Correction Model regression. The results show the existence of market integration and asymmetry in the vertical transmission of rice prices between farmers and consumers, both in the short and long term. The causes of asymmetric price transmission are the presence of uncompetitive behavior or abuse of market power among intermediary traders, especially in concentrated markets, as well as adjustment costs and menu costs. Therefore, the government needs to monitor rice prices regularly to ensure consumer affordability and profitability for farmers. In addition, the government must also have accurate information to identify irregularities or abuse of market power. Furthermore, the government needs to create policies encouraging the involvement of regionally-owned enterprises, the central government, and the private sector in the rice trading sector.
PUBLIC INTEREST STATEMENT
This article discusses the short and long-term transmission of rice prices at the farm and consumer levels in West Java Province. The issue of price transmission is important for public policy because it alters welfare redistribution through price changes and is useful for measuring the efficiency of a marketing system, particularly in rice. Research on rice price transmission in Indonesia still needs to be expanded at the national level and even less at the provincial level, especially in West Java, the most populous region in Indonesia.
1. Introduction
The survival of the Indonesian people still requires staple food, especially rice. However, a small portion of the upper middle class may have begun to reduce rice consumption and shift their consumption patterns from rice to bread or vegetarianism until now; rice is still an important commodity in people’s lives. Rice is a vital and significant commodity in the Indonesian economy due to its linkages between the upstream and downstream sectors, notably for producer and consumer farmers, making rice self-sufficiency crucial (Nuryanti, Citation2018). In 2019, rice consumption was still dominated by household consumption. This is a natural condition that the staple food of Indonesian people is rice, and most of it is consumed from home. Household rice consumption 2019 was 20,685,619 tons, approximately 77.5 kg per capita per year (Badan Pusat Statistik, Citation2019).
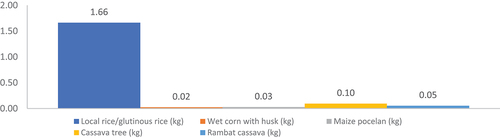
Badan Pusat Statistik (Citation2020) noted that rice is a basic need, with an average weekly per capita consumption from 2007–2019 reaching 1.66 kg. Meanwhile, the cassava tree, the second most frequently consumed food crop, is much smaller than rice, with an average of 0.1 kg, and occupies the second position among commonly consumed food commodities. The Average Weekly Per Capita Consumption of Several Important Foodstuffs, 2007–2019 can be seen in Figure .
Figure 1. Average weekly per capita consumption of some important foodstuffs, 2007–2019.
High rice consumption in Indonesia, with a lack of substitutes, drives consistent demand growth, necessitating continuous expansion of rice production. Rice is vital to Indonesia’s economy, leading to a national focus on self-sufficiency to reduce reliance on imports. This inelastic rice demand benefits farmers in microeconomics, giving them leverage to raise prices (Faharuddin et al., Citation2022). In microeconomics, this inelastic rice demand is beneficial for producers or, in this example, farmers. Rice farmers have a substantially stronger bargaining position than consumers; thus, they can increase rice prices without losing customers.
However, from a macroeconomic perspective, excessively high rice prices contribute to inflation, creating a dilemma for the government to balance farmer and consumer interests. The government currently suffers a “food pricing dilemma” in which producers desire high rice prices, but consumers desire the opposite (van Zyl & Coetzee, Citation1990). Effective policies should ensure high prices for farmers and affordable costs for consumers, but this balance is challenging in the Indonesian rice market.
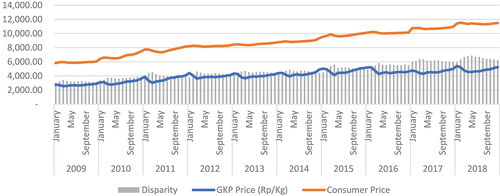
Figure shows that the price of rice at both the farmer and consumer level fluctuates and exhibits an upward price trend, with the price at the consumer level tending to grow more than the slope price at the farmer or producer level. This increases the price gap or margin between farmers and consumers. The substantial price difference between farmers and consumers may indicate anticompetitive conduct by intermediary merchants. According to Kumse et al. (Citation2021), the considerable discrepancy implies that neither farmers nor consumers benefit from the rice trade. However, intermediary merchants will likely enjoy the added value of processing and trading rice.
Figure 2. Development of rice prices at the farmer level (GKP) and consumer level in Indonesia, 2009–2018.
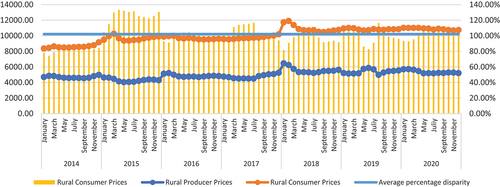
Meanwhile, Figure demonstrates that the price of rice fluctuates and tends to rise at both the farmer and consumer levels in West Java Province. In addition to fluctuating and increasing growth, the margin (price difference) between market levels in the marketing chain is a cause for concern for rice commodities. The price differential or margin between producer and consumer levels is 102% on average.
Figure 3. Development of farmer and consumer rice prices in West Java, 2016–2018.
The widening price gap between dry and unhusked rice indicates unequal vertical price transfer. Asymmetric price transmission, where responses to price increases differ from decreases, is crucial in public policy as it affects welfare redistribution and can lead to losses in the event of market failure (Meyer & von Cramon-Taubadel, Citation2004). One reason for such asymmetry in vertically connected markets, like in one marketing chain, is uncompetitive behavior among intermediary traders, particularly in concentrated markets (Vavra & Goodwin, Citation2005). These intermediaries aim to maintain profit margins by not adjusting prices in response to market signals, showing quicker responses to price increases than decreases. This creates competition constraints within the distribution channel, resulting in insufficient price transmission between producers and consumers, preventing them from having integrated prices.
Several studies related to rice price transmission, both horizontally and vertically, have been conducted. Deb et al. (Citation2020) investigated market integration and price transmission of rice along the vertical supply chain of rice in Bangladesh. The results show that farm, wholesale, and retail prices are integrated in the long run. In addition, prices are at the wholesale level for upstream and downstream markets. The asymmetry error correction model (ECM) found the existence of short-run and long-run asymmetries in price transmission in the vertical supply chain where both producers and consumers experience losses due to positive and negative asymmetries. His research confirmed the cointegration of thresholds and the effect of thresholds on asymmetric price transmission. Mulyana et al. (Citation2020) analyzed the vertical transmission of rice prices from consumers to farmers after the government’s setting of the price ceiling in September 2017. The results show that that the rice market in South Sumatra Province still needs to be more efficient because prices are transmitted asymmetrically, both for premium and medium rice. Chulaphan et al. (Citation2012) examined the causal impact of price transmission among four levels of the Thai rice market from 2001 to 2009. The results show a long-run equilibrium relationship between farm gate, wholesale, retail, and export prices. Furthermore, an upstream and downstream causality relationship and changes in farm gate prices have the largest impact on export and wholesale prices. As a result, exports will be hurt when producer-oriented policies are launched. Darbandi (Citation2018) investigates the transmission of rice prices in Nicaragua using monthly pricing data for high-quality rice in the wholesale and retail marketplaces between January 2008 and December 2015. The results indicate an asymmetry between the two levels of the Nicaraguan rice market. To overcome the price asymmetry, policymakers must understand the price relationships between market levels, which helps assess agricultural policies’ potential impact on producers and consumers. The rice market of Turkey is not cointegrated with the world rice market, while the other commodity markets are weakly cointegrated. Results also show that pass-through of changes in the world prices to the domestic prices is relatively low both in the short run and in the long run, and that adjustment to the new equilibrium following a shock is slow (Ozturk, Citation2020). Transmission of rice prices at the consumer level to prices at the producer level occurs asymmetrically, both in Indonesia’s short term and in the long run. In producer-consumer relations, the transmission of rice prices at the producer level to prices at the consumer level occurs asymmetrically in the short term but symmetrically in the long run (Novianti et al., Citation2020). These studies exhibit varying findings, with some showing asymmetric transmission of rice prices from consumers to producers in both short and long terms, while others find the opposite pattern, with short-term asymmetry in the transmission from producers to consumers but long-term symmetry. To shed light on these disparities, this study intends to investigate the short- and long-term transmission of rice prices at both farm and consumer levels in West Java Province.
This study is expected to make a meaningful empirical contribution, whereas previous studies analyzed price integration in the rice market and the direction of price transmission separately. Meanwhile, this study empirically investigates price integration, price transmission, and the direction and magnitude of symmetric and asymmetric price transmission in the rice market, particularly in West Java Province, the most populous province in Indonesia. Vertical transmission in the rice marketing chain in West Java Province will be analyzed to determine the level of interconnectedness between markets and the symmetry of price transmission between the two markets.
2. Research method
This study analyzes dry unhulled rice (GKP) prices at farm and retail levels in West Java Province from 2014 to 2020, employing econometric tools like Error Correction Model regression (ECM) to assess market integration and price transmission. It aims to characterize price variations and transmission within the rice marketing chain, specifically in West Java. This study utilizes secondary data from the Central Statistics Agency of the Republic of Indonesia and the Central Statistics Agency of the West Java Province. This dataset consists of monthly time series data spanning January 2014 to December 2020. Prior to 2014, the El-Nino tragedy limited rice output; hence it was anticipated that price fluctuations in that year would not be able to explain price transmission factors (Apriyana et al., Citation2021). The categories and origins of the data are detailed in Table below.
Table 1. Types and sources of research data
Since the data examined are commodity prices at the market level within a specific period, the data is a time series. For this reason, time series analysis is utilized as the analytical method. In modeling with time series analysis, the data employed must be stationary; however, the price data examined in this work are not stationary; therefore, analytical procedures such as simple regression may generate conflicting results (Gujarati & Porter, Citation2009). Thus, to overcome transmission of prices with non-stationary data, the Error Correction Model (ECM) employs a cointegration-based research model (Engle & Granger, Citation2015). A cointegration basis is utilized to avoid erroneous regression on non-stationary data. The benefits of ECM include not only analyzing the data through the short-term transmission and price adjustment processes but also in relation to the long-term equilibrium (Firdaussy, Citation2013).
The stationarity test is carried out to test the data characteristics used. This test is necessary considering that the data used in this study is time series data. Stationarity is closely related to the consistency of the movement of time series data. A data is said to be stationary if the value of its statistical parameters (mean and variance) is constant over time, followed by the covariance value between two time periods that only depends on the interval between them. Conversely, time series data is considered non-stationary if there is a trend in the average value or variance. Data that is non-stationary will provide spurious regression, which is a situation in which a regression from one variable to another has a high R2 value yet; according to economic theory, there is no tangible link between the variables (Engle & Granger, Citation2015). Several conditions can be applied to the data to establish its stationarity. Data that is stationary in the first derivative I(1), is referred to as the first difference or integration of order 1. If the data is derived “d” times so that it is stationary, then the data is denoted I(d) or integrated on the “d” order. In this study, the stationarity test will be carried out with the Augmented Dickey Fuller (ADF) unit root test and the Philip Platform Test (PP). The following are the results of the stationary test of rice price data at the producer and consumer levels. Cointegration testing is conducted to show the long-term relationship between rice price at the farmer Level and the consumer price price variable. The cointegration testing model used in the study is maximum likelihood. Meanwhile, causality testing in price transmission analysis aims to ascertain the direction of the causal relationship between the variables tested. In the case of vertical price transmission analysis, the causality test is used to see whether the source of price transmission comes from upstream or downstream.
The estimation techniques in this study were carried out as follows: Augmented Dickey-Fuller unit root test and Johansen cointegration test were used to evaluate the time series properties of the data. These tests are useful to place the results into the context of a larger study based on these tests to consider price transmission. The procedure follows Engle and Granger (Citation2015) two-step approach. First, the cointegrating relationship among the variables is estimated by ordinary least squares (OLS). Second, the ECM is specified using the lagged residuals from the cointegrating regression as error correction terms. When residuals are used, the results may be sensitive to normalization rules or methods; the results may not be affected by the choice of which variable is selected as the left-hand side variable in the cointegrating regression.
The price transmission analysis using the ECM model is divided into two categories: the ECM symmetry model and the ECM asymmetry model (Granger & Lee, Citation1989; Mohanty & Peterson, Citation1996). Below is the general equation for ECM:
Where: = Change in variable y in period t
= Change in variable x in period t
= Error Correction Term of cointegration equation
= Intercept
= Coefficient of the short-term effect of changes in the variable y of the previous period (autoregression)
= Coefficient of the short-term effect of changes in variable x
= Error Term Coefficient of cointegration equation shows the level of speed adjustment, a deviation in the period against its long-run equilibrium, the coefficient should be a negative value (-)
= Error termi = 1,2,3, … , Kj = 1,2,3, … , L
In addition, the Asymmetric ECM model is an extension of the Symmetric ECM model that determines the divergent price responses in a market to price changes at the previous market level. Granger and Lee (Citation1989) introduced this approach by dividing the Error Correction Term (ECT) variable into positive and negative values to determine long-term asymmetry. Then, Cramon-Taubadel and Loy (Citation1996) constructed the equation by classifying the independent variables’ direct effect to determine the short-term transmission asymmetry. Reziti (Citation2014) and Götz et al. (Citation2014) employed the asymmetry model using the following general equation:
Where: = Price changes in the output market (affected market) in period t
= Price change in the input market (reference or influencing market) on the t-th period
= Dummy 1 for
in up
= Dummy 0 for
in down
= Error Correction Term of the cointegration equation (+) for the ECT value above
= Intercept
= Autoregressive coefficient
= Coefficient of short-run price transmission
= Long-run price transmission coefficient (+) for price deviation shock/ECT value above balance (-) for price deviation shock/ECT value below balance
= Error term
i = 1,2,3, … , K
j = 1,2,3, … , L
thus, the second adjustment to the model as follows:
Where:
= Changes in consumer prices throughout the t-th period
= Price change at the farmer level in the period
= Intercept
= Coefficient of the short-term influence of changes in rice prices at the consumer level in the previous period
= Coefficient of the short-term effect of changes in rice prices at the farmer level, representing short-run price transmission
= Error Term Coefficient of cointegration equation indicates the amount of speed adjustment of the deviation in the previous period in relation to its long-run equilibrium; the coefficient should be negative (-)
= Error term
i = 1,2,3, … , K
j = 1,2,3, … , L
The third model is the ECM asymmetry model, which explains the asymmetry of price transmission in the rice commodity marketing chain. This model relates to the AECM relationship between rice prices at the farm level and those at the consumer level developed by Götz et al. (Citation2014). The following is the model:
Where:
= Price changes at the consumer level in period t
= Price changes at the farmer level in period t
= Dummy 1 for
= Dummy 0 for
= Error Correction Term of cointegration equation
for error term value above balance (
)
error term value under balance (
)
= Intercept
= Coefficient of the short-term effect of changes in rice prices at the consumer level in the previous period
= Coefficient of the short-term effect of changes in rice prices at the farmers’ level describing short-run price transmission
= Error Term Coefficient of cointegration equation indicates the amount of speed adjustment of the deviation in the previous period in relation to its long-run equilibrium; the coefficient should be negative (-) (+) for price deviation shock/ECT value above balance (-) for price deviation shock/ECT value below balance
= Error term
i = 1,2,3, … , K
j = 1,2,3, … , L
3. Results and discussion
Descriptive statistics provide an initial overview of the study variables, encompassing rice prices at both producer (farmer) and consumer levels. Table displays the descriptive statistics for the research variables: average, median, minimum, maximum, standard deviation, and coefficient of variation.
Table 2. Descriptive statistics of research variables
Descriptive statistics serve as the initial analytical step in this research. The study examines two variables, producer- and consumer-level rice prices, observed monthly from 2014 to 2020. Mean and median values assess data concentration, while minimum and maximum values and standard deviation gauge data distribution. Standard deviation quantifies data spread and variability, with lower values indicating proximity to the data center. The Coefficient of Variation measures price volatility and fluctuations.
The rice price variable at the producer level has a mean or average value of 4,989.15 Rp/Kg. The median value or median value of the rice price variable at the producer level is 4,975.07 Rp/kg; thus, the price of rice at the consumer level is centered on that price level. The minimum price for the rice price variable at the producer level is 4,033.21 IDR/Kg, which occurred in May 2015, while the maximum price is 6,453.43 IDR/Kg occurred in the January 2018 period. The standard deviation of the price variable rice at the producer level shows a value of 491.19 with a coefficient of variation of 0.0985 which indicates that the distribution of rice price data at the producer level has a low level of deviation but experienced price fluctuations of 9.85% throughout the 2014–2020 period.
The concentration of data on the rice price variable at the consumer level can be seen from the average price value of 10,049.12 Rp/Kg and the median value of 9,937.16 Rp/Kg. The minimum price for the variable price of rice at the consumer level is 8,358.73 IDR/Kg, which occurred in January 2014, while the maximum price is 11,896.67 IDR/Kg occurred in February 2018 period. The standard deviation value is 840.85, which is smaller than the average value and indicates that the level of rice price deviation at the consumer level is low. The coefficient of variation is 0.0837, indicating a fluctuation in rice prices at the consumer level of 8.37% throughout the 2014–2020 period.
The first stage, the stationarity test, was conducted to determine the consistency of the time series data used in this study, which tends to be non-stationary.
In Table , both the ADF test and the PP test indicate that there is no stationary at the level, as indicated by the probability values at the ADF and PP levels that are not statistically significant at the critical values (1%, 5%, and 10%) for the producer and consumer
prices. Meanwhile, the first difference test results show that all variables, both producer prices
and consumer prices
are statistically significant at the 5% level , indicating that rice prices at the producer and consumer in the first difference are stationary.
Table 3. Data stationarity test results
The lag criterion test determines the number of lags included in the model to be examined. The criterion lag is proportional to the duration of each interaction in the model.
Table displays the results of the optimal lag test for the smallest LR, FPE, AIC, SC, and HQ criteria values on the second lag, meaning that the lag used in the model analysis is the second. This condition can also be interpreted as the current price of rice at the consumer level being related to the price at the rice producer level in the previous two months. The cointegration test is a condition of the Error Correction Model (ECM), and it is used to determine the existence of long-term equilibrium (Engle & Granger, Citation2015). Time series data that is not stationary at the level may be used if it has a long-term equilibrium relationship (cointegrated). The cointegration test must therefore be conducted in this study.
Table 4. Criteria lag testing results
Tables show the cointegration test results obtained through the Engel-Granger and Johansen methods, where the ECT value is statistically significant at the 5% significance level, and the trace value exceeds the critical threshold (5%), although the maximum eigenvalue is below the 5% critical threshold.Thus, the null hypothesis is rejected (Gao et al., Citation2018), indicating a strong long-term connection between rice producers and consumer prices. However, further analysis is needed through price transmission analysis to gain a deeper understanding of this relationship. This aligns with prior research, such as Kwesi Ndzebah Dadzie and de Graft Acquah (Citation2010), who examined corn price transmission in Ghana from 1994 to 2003, and Firdaussy (Citation2013), who explored rice price transmission to consumer farmers in Jakarta, Indonesia, both suggesting cointegration relationships among the studied variables.
Table 5. Cointegration test results for the Engel-Granger Method
Table 6. Johansen cointegration test Results
The Granger Causality test is used to evaluate the direction of price changes by determining whether the effect of other variables causes changes in a variable. The direction of the change can be from the downstream to the upstream level or vice versa. This test of causality employs the Granger Causality test.
The Granger causality test results show no causal relationship between variables. The null hypothesis that farmer prices do not affect consumer rice prices is accepted. Similarly, the null hypothesis that farm gate prices do not affect consumer rice prices is accepted. Thus, there is no causal relationship between farm-level prices and two-way consumer rice prices. If we examine the features of agricultural items, including rice, we find that the supply-side factors have a more significant impact on rice pricing than the demand-side factors, given that rice is the primary food commodity with relatively consistent demand (Pardani et al., Citation2008). This analysis, therefore, assumed that farm-level prices have a causal link with consumer-level pricing (See in Table ).
Table 7. Causality test results
Parameter estimation was carried out for the ECM symmetry model. The variables used to estimate the consumer rice price symmetry model are producer (farmer) rice prices for periods t, t-1, and t-2, consumer rice prices for periods t-1 and t-2, and the error correction term (ECT) for period t-1. The results of estimating the symmetry model for the consumer rice price in period t are provided in Table below.
Table 8. Symmetry model estimation results
The estimation results in Table reveal that the price variable at the farm level for period t (), the price variable at the consumer level for period t-1 (
) and the ECT variable for period t-1 (
) all significantly impact the price of rice at the consumer level for period t. Meanwhile, neither the variable prices of farmers in periods t-1 (
) and t-2 (
) have a significant impact on the price at the consumer level.
Farm prices positively influence consumer rice prices in period t and consumer prices in period t-1. For the price variable at the farm level in period t, every 1 percent increase in the price at the farm level in period t will increase prices at the consumer level in period t by 0.26 percent, ceteris paribus. For the consumer price variable for period t-1, every 1 percent increase in prices at the consumer level t-1 will increase prices at the consumer level for period t-1 by 0.37 percent, ceteris paribus. These findings are aligned with the research by (Alam et al., Citation2010), who examined the transmission of rice prices in Bangladesh between wholesale and consumer prices and stated that wholesale prices t, t-1, and consumers t-1 had a significant effect on consumer prices for period t.
The error correction term variable lag period t-1 () has a significant value. This can be read to mean that the price difference between farmers and consumers substantially impacts the model over the long term or that the pattern of price differences between farmers and consumers will not always be symmetrical. A negative value for the ECT coefficient indicates that a short-term price deviation may result in the price automatically returning to the long-term equilibrium line. The ECT coefficient value is 0.104798, which can be interpreted when a price deviation occurs; the time it takes for the market to reach its long-term equilibrium line is almost 10 months; this is consistent with the research from Firdaussy (Citation2013) which indicates that long-term equilibrium is reached in 8 months for rice commodity in Indonesia. Interpreting these results suggests that there is market integration in the transmission of farmer prices to consumer prices. Changes in producer-level rice prices are indeed transmitted to the consumer market. Overall, it can be concluded that vertical integration of the rice market has occurred as intended, in line with findings from Reziti and Panagopoulos (Citation2008) and Baquedano and Liefert (Citation2014) that show both long-term and short-term market integration within a single agricultural product marketing chain.
Asymmetry tests are conducted to determine whether pricing transmission from the farmer level to the consumer level has occurred perfectly. EquationEquation 4(4)
(4) represents the utilized ECM asymmetry model. Included in this model’s estimation of the consumer price asymmetry are the following variables: producer (farmer) rice prices for periods t, t-1, and t-2, consumer rice prices for periods t-1 and t-2, and error correction term (ECT) period t-1, the independent variables are separated between positive shock and negative shock. Positive shock occurs when the independent variable encounters changes in price increases, and negative shock occur when the independent variable’s price decreases. The estimation of the asymmetry model for the consumer rice price in period t is provided in Table below.
Table 9. Estimation results for the asymmetry model
The estimation results reveal that in the short-term price transmission, the response of rice prices at the consumer level to positive and negative shocks to the independent variables differs descriptively. Price variables at the current farm level () and the previous period (
) as well as prices at the consumer level in the previous period (
) have a positive and statistically significant value, indicating that this variable transmits price changes associated with price increases. While the variables affected by other shocks have insignificant values, which means that price changes in these variables will have no effect on consumer prices. According to the results of the estimation conducted in (Firdaussy, Citation2013), namely the estimation of the asymmetric price transmission of rice from producers to consumers in Indonesia from January 2000 to December 2011, the price variable at the current farm level (
) and prices at the consumer level in the previous period (
) significantly changes the current level of consumer prices, meaning that price increases will be met with various responses from consumer prices.
The estimated value of the variable is statistically significant. In other words, the price at the consumer level will adjust to the fall in prices at the farmer level when the price variation exceeds the equilibrium line. A score of 0.323 for
indicates that when there is a price deviation over the equilibrium line, the consumer price will return to equilibrium within 3 months. Meanwhile,
in this model has an insignificant value. This indicates that when there is a price deviation below the equilibrium line (when a price increase at the producer level is not followed by a price increase at the consumer level), the deviation will not affect the price of rice at the consumer level. These findings are consistent with the findings (Ruslan & Pramita, Citation2022), who examined the efficiency of the primary food commodity market in West Java Province using data on the primary commodities, namely rice, chili, and chicken meat from 2015 to 2019, resulting in a significant
estimate of 0.477%. This figure indicates that two months are required to reach equilibrium when the price is above equilibrium. In addition, the Wald test will be conducted to demonstrate the significance of the difference between the positive and negative shock reactions.
Next, the price transmission estimator model will perform a Wald test. This test aimed to establish the significance between positive and negative shocks resulting from the coefficients of the independent variables. The Wald test provides outcomes regarding identifying shocks in various directions inside the asymmetry model. If significance exists, there is a price imbalance in the rice distribution. Price transmission is symmetrical if there is no significance. The Wald Test results are displayed in Table below.
Table 10. Wald Test
The test results indicate a significant asymmetric relationship between short-term and long-term price transmission. This circumstance suggests a lack of market competition (Novianti et al., Citation2020). One of the causes of asymmetric price transmission is non-competitive behavior among intermediary traders, especially when intermediary traders are in a concentrated market (Vavra & Goodwin, Citation2005). In addition, there are adjustment and menu costs, where rigidity in the price adjustment process between levels in a marketing chain is often due to the additional costs that businesses must incur to adjust their prices, especially in the short term (Meyer & von Cramon-Taubadel, Citation2004). In the short term, the asymmetry relationship emerges when farm-level prices fluctuate in periods t, t-1, and t-2, although the price transmission for other variables is symmetrical or insignificant. This result is consistent with the findings by Novianti et al. (Citation2020) who analyzed the transmission of rice asymmetry prices at the producer to consumer level in Indonesia from 2010 to 2017 and concluded that the transmission of rice prices from the producer to the consumer was asymmetric in the short term. Asymmetric price transmission conditions exist in the long term, indicating that the reaction between positive and negative ECT coefficients differs. These findings are consistent with the research from (Firdaussy, Citation2013), which analyzed the transmission of rice prices for consumer farmers in Indonesia from 2000 to 2022 and found that asymmetric transmission occurred over the long run.
This disparity in response can be attributed to the acts of uncompetitive marketing agencies that prevent pricing signals from continuing undisrupted (Vavra & Goodwin, Citation2005). Long-term asymmetry price transmission conditions result from marketing agencies abusing their market power. In contrast, in the short-term asymmetry relationship, differences in responses result from adjustment costs incurred by marketing agencies to adjust prices (Novianti et al., Citation2020).
4. Conclusions
n summary, the study concludes that there is an integration relationship between prices in the producer (farmers) and consumers in West Java. The transmission of rice prices at the farm level to consumers is asymmetrically transmitted in the short and long term. In the short term, asymmetry occurs at producer prices for periods t, t-1, and t-2, meaning that the response to price changes at these levels is differently transmitted to consumer prices. In the long run, price transmission occurs asymmetrically, where the positive and negative long-run equilibrium coefficients are statistically significant. This condition shows that the adjustment process caused by a decrease in prices at the producer level differs from the adjustment process due to deviations in price increases.
Given the characteristics of the rice trade structure in West Java, asymmetric price transmission, in the long run, is most likely caused by two things. First, the government’s price intervention policy on producer-level prices while consumer-level prices are allowed to move without any policy restrictions from the government. Second, there is uncompetitive behavior among intermediary traders, especially if the intermediary traders are in a concentrated market. The government’s policy of intervening more at the producer level has led to the perception among intermediary traders that the price reductions at the producer level are only temporary so that intermediary traders do not directly transmit the price reductions to consumer prices. The abuse of market power by intermediary traders is also supported by the market structure of intermediary traders, which leads to oligopsony/oligopoly where the number of intermediary traders is less than the number of farmers and rice consumers. As a result, intermediary traders can set prices according to their desired margins (price makers).
This study shows that intermediary traders have market power to determine the price of rice commodities. Therefore, local governments need to monitor rice prices regularly in their areas to guarantee and ensure the affordability of rice prices for consumers and profits for farmers. In addition, local governments should have accurate information to identify deviations or abuses of market power. Furthermore, to reduce the impact of the oligopolistic market structure of intermediary traders and shorten the trade chain, the government also needs to implement policies that encourage the participation of regionally-owned enterprises, the central government, and the private sector in the rice trading sector, especially at the intermediary trader level. This aims to reduce the impact of the oligopolistic intermediaries’ market structure and shorten the long supply chain.
The weakness of this study is that it only focuses on rice prices in West Java Province, as complete data to see geographic price transmission across all districts/cities in the region is not available. Therefore, future research can be conducted using spatial data to analyze the interconnectedness of the rice trade supply chain between regions and analyze data on different varieties and quality of rice, as price transmission may vary. Finally, the existence of commodities that show price asymmetry indicates inefficiency, especially in distribution. Therefore, to reduce information asymmetry, the government must intervene and provide statistical data reports per commodity to see price developments so that consumers and producers can access the right price information.
Correction
This article has been corrected with minor changes. These changes do not impact the academic content of the article.
Acknowledgments
We sincerely appreciate our colleagues and friends from the Department of Economics, in which their insights and feedbacks were hugely influential during the development of this research. We also thank our many reviewers who have shown many efforts in giving their insights, allowing this paper to come to fruition.
Disclosure statement
No potential conflict of interest was reported by the author(s).
Additional information
Funding
Notes on contributors

Bayu Kharisma
Bayu Kharisma is a lecturer at the Department of Economics, Universitas Padjadjaran. He obtained bachelor’s degree in Economics from Universitas Padjadjaran, a Master’s degree in Agribusiness Management from Bogor Agricultural University and in Economics from Universitas Indonesia. He earned her doctoral degree in Economics from Universitas Gadjah Mada. Bayu Kharisma’s research interests are in development and institutional economics.
Zefri Mario Sandy Indrawan
Zefri Mario Sandy Indrawan works as a Data Compiler for Monitoring and Evaluation at the Regional Development Planning Agency of Garut Regency. He obtained his bachelor’s degree in mathematics from Universitas Pendidikan Indonesia and his Master’s degree from Universitas Padjadjaran. Zefri Mario Sandy Indrawan’s research interests are monitoring evaluation and applied mathematics.
References
- Alam, M. J., Begum, I. A., Buysse, J., McKenzie, A. M., Wailes, E. J., & Van Huylenbroeck, G. (2010). Testing asymmetric price transmission in the vertical supply chain in de-regulated rice markets in Bangladesh. American Association of Agricultural and Applied Economics, 1–15. http://ageconsearch.umn.edu/bitstream/61374/2/AAEA%2CDenver%2CColrado%2C2010.pdfñ
- Apriyana, Y., Surmaini, E., Estiningtyas, W., Pramudia, A., Ramadhani, F., Suciantini, S. & Syahbuddin, H. (2021). The integrated cropping calendar information system: A coping mechanism to climate variability for sustainable agriculture in Indonesia. Sustainability (Switzerland), 13(11), 6495. https://doi.org/10.3390/su13116495
- Badan Pusat Statistik. (2019) . Kajian Konsumsi Bahan Pokok 2019.
- Badan Pusat Statistik. (2020) . Rata-Rata Konsumsi per Kapita Seminggu Beberapa Macam Bahan Makanan Penting, 2007-2019.
- Baquedano, F. G., & Liefert, W. M. (2014). Market integration and price transmission in consumer markets of developing countries. Food Policy, 44, 103–114. https://doi.org/10.1016/j.foodpol.2013.11.001
- Chulaphan, W., Jatuporn, C., Chen, S. E., & Jierwiriyapant, P. (2012). Causal impact price transmission of the rice markets in Thailand. Proceedings of the 2nd IASTED Asian Conference on Modelling, Identification, and Control, AsiaMIC 2012 (pp. 303–306). https://doi.org/10.2316/P.2012.769-051
- Cramon-Taubadel, S., & Loy, J.-P. (1996). Price asymmetry in the International wheat market: Comment. Canadian Journal of Agricultural Economics/Revue Canadienne D’ Agroeconomie, 44(3), 311–317. https://doi.org/10.1111/j.1744-7976.1996.tb00153.x
- Darbandi, E. (2018). Price transmission analysis for Nicaragua rice market. International Journal of Food and Agricultural Economics (IJFAEC), 6(1), 85–94. https://doi.org/10.22004/ag.econ.283763
- Deb, L., Lee, Y., & Lee, S. H. (2020). Market integration and price transmission in the vertical supply chain of rice: An evidence from Bangladesh. Agriculture (Switzerland), 10(7), 1–21. https://doi.org/10.3390/agriculture10070271
- Engle, R. F., & Granger, C. W. J. (2015). Co-integration and error correction: Representation, estimation, and testing. Applied Econometrics, 39(3), 107–135. https://doi.org/10.2307/1913236
- Faharuddin, F., Yamin, M., Mulyana, A., & Yunita, Y. (2022). Impact of food price increases on poverty in Indonesia: Empirical evidence from cross-sectional data. Journal of Asian Business and Economic Studies, 30(2), 126–142. https://doi.org/10.1108/jabes-06-2021-0066
- Firdaussy. (2013). Analisa Integrasi Pasar Dan Transmisi Harga Beras Petani-Konsumen Di Indonesia. Jurnal Kebijakan Ekonomi, 8(2), 82–111. http://jke.feb.ui.ac.id/index.php/JKE/article/view/24
- Gao, X., Huang, S., Sun, X., Hao, X., & An, F. (2018). Modelling cointegration and granger causality network to detect long-term equilibrium and diffusion paths in the financial system. Royal Society Open Science, 5(3), 172092. https://doi.org/10.1098/rsos.172092
- Götz, L., Von Cramon-Taubadel, S., & Kachel, Y. (2014). Vertical price transmission in the international fresh fruit and vegetable supply chain: Israeli grapefruit exports to the EU after export liberalisation. Quarterly Journal of International Agriculture, 53(2), 99–120.
- Granger, C. W. J., & Lee, T. H. (1989). Investigation of production, sales and inventory relationships using multicointegration and non‐symmetric error correction models. Journal of Applied Econometrics, 4(1 S), S145–S159. https://doi.org/10.1002/jae.3950040508
- Gujarati, D. N., & Porter, D. C. (2009). Basic Econometrics (5th ed., Ed., A. E. Hilbert). McGraw-Hill Irwin.
- Kumse, K., Suzuki, N., Sato, T., & Demont, M. (2021). The spillover effect of direct competition between marketing cooperatives and private intermediaries: Evidence from the Thai rice value chain. Food Policy, 101, 101. https://doi.org/10.1016/j.foodpol.2021.102051
- Kwesi Ndzebah Dadzie, S., & de Graft Acquah, H. (2010). An application of the von Cramon-Taubadel and Loy error correction models in analyzing asymmetric adjustment between retail and wholesale maize prices in … an application of the von Cramon-Taubadel and Loy error correction models in analyzing asymmetric a. Journal of Development and Agricultural Economics, 2(4), 100–106. http://www.academicjournals.org/JDAE
- Meyer, J., & von Cramon-Taubadel, S. (2004). Asymmetric price transmission: A survey. Journal of Agricultural Economics, 55(3), 581–611. https://doi.org/10.1111/j.1477-9552.2004.tb00116.x
- Mohanty, S., & Peterson, E. W. F. (1996). Price asymmetry in the International wheat market: Reply. Canadian Journal of Agricultural Economics/Revue Canadienne D’Agroeconomie, 44(3), 319–321. https://doi.org/10.1111/j.1744-7976.1996.tb00154.x
- Mulyana, A., Lastinawati, E., Lifianthi, L., Riswani, R., Aryani, D., & Mulyana, A. (2020). Price transmission after the determination of rice ceiling price in South Sumatra Province: Analysis of secondary and empirical data. IOP Conference Series: Earth and Environmental Science (Vol. 497). https://doi.org/10.1088/1755-1315/497/1/012042
- Novianti, T., Mashito, M. A., & Muryani. (2020). Asymmetry price transmission in market rice in Indonesia. Jurnal Ilmu Ekonomi Terapan, 5(2), 64–78. https://doi.org/10.20473/jiet.v5i2.23612
- Nuryanti, S. (2018). Swasembada Beras Berkelanjutan: Dilema antara Stabilisasi Harga dan Distribusi Pendapatan. Forum Penelitian Agro Ekonomi, 35(1), 19. https://doi.org/10.21082/fae.v35n1.2017.19-30
- Ozturk, O. (2020). Market integration and spatial price transmission in grain markets of Turkey. Applied Economics, 52(18), 1936–1948. https://doi.org/10.1080/00036846.2020.1726862
- Pardani, C., Noormansyah, Z., & Hikam, M. A. S. (2008). Pengaruh Distribusi Dalam Pembentukan Harga Komoditas dan Implikasinya Terhadap Inflasi. Working Paper of Bank Indonesia No. 7.
- Reziti, I. (2014). Price transmission analysis in the Greek milk market. Agribusiness, 64(4), 75–86.
- Reziti, I., & Panagopoulos, Y. (2008). Asymmetric price transmission in the greek agri-food sector: Some tests. Agribusiness, 24(1), 16–30. https://doi.org/10.1002/agr.20144
- Ruslan, J. A., & Pramita, D. A. (2022). Efisiensi Pasar pada Komoditi Pangan Utama di Provinsi Jawa Barat. Suluh Pembangunan: Journal of Extension and Development, 4(1), 1–8. https://doi.org/10.23960/jsp.vol4.no1.2022.120
- van Zyl, J., & Coetzee, G. K. (1990). Food security and structural adjustment: Empirical evidence on the food price dilemma in Southern Africa. Development Southern Africa, 7(1), 105–116. https://doi.org/10.1080/03768359008439502
- Vavra, P., & Goodwin, B. (2005). Analysis of price transmission along the food chain. OECD Food, Agriculture and Fisheries Papers (No. 3). OECD Publishing. https://doi.org/10.1787/752335872456