
 ?Mathematical formulae have been encoded as MathML and are displayed in this HTML version using MathJax in order to improve their display. Uncheck the box to turn MathJax off. This feature requires Javascript. Click on a formula to zoom.
Abstract
To solve the current shortcomings in the marketing channel of ginger (Zingiber officinale) and the subsequent value addition along the channel, a value chain analysis is required. A household survey of producers and in-person interviews with traders were conducted in one of the municipalities (Rampur municipality) and three different rural municipalities, namely Nisdi, Purbakhola, and Bagnaskali of Palpa district, with the sole purpose of analyzing the ginger value chain. For the analysis, a total of 97 ginger growers and 10 traders were surveyed. Interviews with traders, processors, and middlemen were also required to determine the value chain and the cost of ginger at each stage. The difference between farm gate pricing and retailers’ prices was determined to be NPR. 40. With an average B:C ratio of 1.06, the findings showed that ginger production was a financially viable business in the study area of the Palpa district. To enhance ginger production and production areas, the government should give producers financial support. According to the Cobb-Douglas production function, the scalability of ginger production increased at a decreasing rate. As the sum of the regressions of all the inputs in the regression function was found to be 0.895, the gross return would rise by roughly 89.5% of all the inputs listed in the production function were increased by 100%. The PMAMP’s zone office for ginger and turmeric should offer farmers technical support to help them deal with disease and pest issues and market information.
Public Interest Statement
Despite the huge production of ginger in the Palpa district of Nepal during recent years, people are still deprived of a fruitful income because of a lack of proper access to markets and a reasonable price for the commodity. A thorough analysis of the reasons behind the poor marketing condition of ginger can be accomplished with proper financial information. This research is solely based on assessing the value chain of the ginger subsector in Palpa by considering all the actors and enablers involved in it. The climatic conditions and the topography of the district have always contributed to the enormous production of ginger. The export of fresh ginger and its products, however, diminished haphazardly compared to the past. All in all, this analysis of the value chain of ginger has covered the major problems related to production and marketing, and it has also evaluated the economics of ginger production.
1. Introduction
Ginger (Zingiber officinale) belonging to the family Zingiberaceae, can freely flourish throughout the world’s tropical and subtropical regions despite being a high-value cash crop. It is grown in the majority of tropical and subtropical locations and has been dispersed all over the world. Almost 50% of the world’s production is produced primarily in India, China, Nepal, Nigeria, Thailand, Indonesia, Bangladesh, Japan, and Cameroon (Joshi & Khanal, Citation2021). Ginger, a Southeast Asian native and significant spice crop with an underground economic portion called a rhizome, can be eaten fresh, dried (Sutho), powdered, pickled, or even as candy (Dahal & Rijal, Citation2020). It is one of the most important spice crops grown in the mid hills of Nepal as High Value Crops (HVCs) which has extreme export potential (Khanal, Citation2018). Botanically, ginger is a perennial plant but agriculturally categorized as an annual crop because it produces about a meter-long leafy stem every year (ICIMOD, Citation2017). Ginger has been used extensively in traditional and modern medicines for the treatment of fever, headache, indigestion, pregnancy disorders, menstrual pain, motion sickness, rheumatoid arthritis, and osteoarthritis (Raj Dahal & Rijal, Citation2020). Ginger chewing gum, rich in ginger hydro-alcoholic extract, has beneficial active compounds that help to avoid motion sickness, nausea and have gastro-protective and antioxidant effect (Aslani et al., Citation2016). About 107 spices all over the world are in use and in the case of Nepal, more than 25 spices are most commonly used. Nepal is the world’s fourth largest ginger producer after India, China, and Indonesia (Upadhyaya et al., Citation2020). In Nepal, major production of ginger is carried out in Illam, Salyan, Palpa, Morang, Doti, Nawalparasi, Kailali, Tanahun, Surkhet, Sindhupalchowk, Syangja, Makwanpur, Sindhuli, and Kaski districts, occupying an area of 21,912 ha with a production of 279,206 Mt in 2020/21; and ginger alone contributes 1.88 % to the national GDP (MoALD, Citation2021).
Due to its location at the ideal height for the production of ginger, Palpa, a district in Nepal’s Lumbini province, is one of the major potential district. Major cultivation in the district includes cereals, seasonal vegetables, grain legumes, and oilseed crops. According to MoALD (Citation2022), the total production of ginger in Palpa was 14,734 Mt in a 1,150-ha area with a productivity of 12.81 Mt/ha while Illam was the largest producer of ginger in terms of both production, i.e., 48600 Mt and area, i.e., 3,240 ha but the highest productivity was observed in Dadeldhura with 30.50 Mt/ha.
Around 2.17% of Nepal’s ginger (i.e., 6,065,622 kg) is exported to other countries with an export value of NRs 448,364,000, and from the total export, 99 % ginger (i.e., 6,004,965.78 kg) export is done to India only with the export value of NRs 400 million, ¾ th of which was fresh ginger and remaining was in dried form (locally known as “Sutho”) (TEPC, Citation2018). However, the trend of export of ginger to India and other countries is decreasing due to several factors. Prices have started falling and by 2020, the price of ginger had crashed due to travel restrictions. In addition, an uncertain market and fluctuating prices have spread a serious concern among ginger growers in the Palpa district (Aryal, Citation2022). So it is rather important to discover the root causes of market uncertainty and the price instability of ginger in the case of the Palpa district. Ginger is a highly potential spice crop specially grown as a cash crop due to its climatic suitability across the whole east-west length covering Illam in Province no.1 and Doti in Sudurpashchim Province extending up to the altitudes of 1500 meters in Nepal (Shakya, Citation2005). Hilly districts are major areas for higher production of ginger as the average temperature requirement is 20–30°C, and the loamy soil is highly favorable (Gautam et al., Citation2018). Both the area and the production of ginger in Palpa have decreased from 3780 ha with 26,530 Mt (MoALD, Citation2014) to 1282 ha with 15,205 Mt (MoALD, Citation2018), which further decreased to 1150 ha with 14,734 Mt (MoALD, Citation2022). The export % of ginger from Nepal has fallen from 2.96% to 2.17%, i.e., from 8,846,931 kg to 6,065,622 kg (MoALD, Citation2022).
Palpa is one of the major districts of Nepal with higher production of ginger. Almost 99% of the total ginger export is to our neighboring country, India (TEPC, Citation2020). It has been realized the considerable contribution of ginger to the national economy in terms of increase in production, income, and export. As described in TEPC (Citation2020), the income per unit area from ginger is much higher compared to other traditional crops. Exporting ginger to influential or relatively established and bigger traders would also pay greater value, in the case of India. Further, Prime Minister Agriculture Modernization Project (PMAMP), Project Implementation Unit (PIU), Palpa has been listed as a Ginger/Turmeric Zone, and this research would significantly contribute to assisting this program by providing information on the marketing margin, marketing channel, and marketing system of ginger in Palpa. Owing to versatile properties, product diversification, decrease in the market margin, accessible market, and increase in benefit-cost ratio can raise its economic value by 2–3 folds thus offering a high promise for additional income generation for ginger growing farmers apart from its multiplier effect to its different market value chain actors (ANSAB, Citation2011).
2. Methodology
2.1. Research site
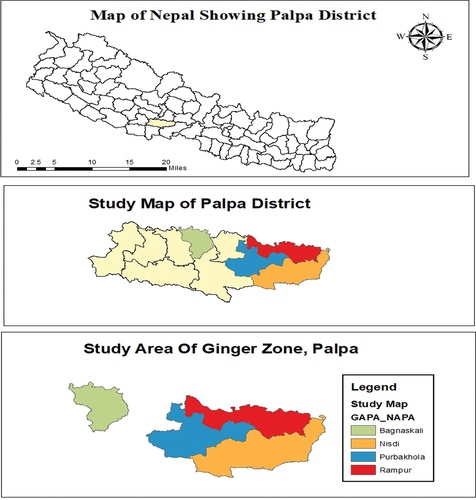
Palpa district, a part of the Lumbini province, is one of the 77 districts of Nepal. It lies in the mid-hills region at an altitude ranging from 157 meters to 1936 meters above sea level. It lies at about latitude 27°34’ − 27° 57’ North and longitude 83° 15’ − 84°22’, and covers an area of 1,366 with 2 municipalities and 60 VDCs. The study was conducted in the coverage area of PMAMP, PIU, Ginger/Turmeric zone, viz. Nisdi Rural Municipality 1–7, Bagnaskali Rural Municipality 7–9, Purbakhola Rural Municipality 1,5, and Rampur Municipality 1,7,9 of Palpa district. Figure shows the Map of Nepal including map of Palpa district along with the geographical map of study area of ginger zone of the corresponding district.
Figure 1. Map of Palpa district including study area.
2.2. Sampling Procedure and Sample Size
For the study of value chain of ginger, the respondents mainly include ginger growers, collectors, traders and processors. The determination of sample size is discussed here:
2.2.1. Selection of ginger farmers
The selection was done using a three-stage random sampling method. All ginger farmers from the selected area of Palpa district, Ginger Zone comprise our whole population. In the first stage, Nisdi Rural Municipality, Bagnaskali Rural Municipality, Purbakhola Rural Municipality, and Rampur Municipality of Palpa district were purposefully selected as they were the major ginger-producing local bodies. In the second stage, a name list of ginger growers was collected as the sampling frame which showed the total number of ginger farmers in the selected area was 2639. In the third stage, since the population size was known, the sample size was determined by using Slovin’s Formula [n=N/(1+N)] (Baruwadi et al., Citation2020), where n is the sample size, N is the population size and e is the margin of error to be decided by the researcher (here, we took e = 10%). In this way, out of 2639 ginger farmers, 97 farmers were selected as samples for the survey.
2.2.2. Selection of ginger traders and input suppliers
Ginger traders are the middlemen involved in the marketing of ginger. Whereas, input suppliers are those who give the inputs for ginger cultivation. For the study of marketing constraints and value chain of ginger grown in the Palpa district, a total of 10 traders from Nisdi Rural Municipality, Bagnaskali Rural Municipality, Ribdikot Rural Municipality, and Butwal Sub-Metropolitan City were selected on the basis of their experiences in trading of ginger.
2.3. Sources of information
The information required for this study was obtained through primary as well as secondary sources. Primary data was gained through a survey of ginger growers and middle man or traders. The information required was collected through a household survey using an interview schedule. Observation, Focus group discussion (FGD), Key informant interview (KII), and Rapid market appraisal (RMA) will also be used for the collection of data.
The secondary data on input supply, production and price status, marketing, processing, and research over a long period related to ginger was obtained from the Ministry of Agriculture and Livestock Development (MoALD), Central Bureau of Statistics (CBS), FAOSTAT, Journal articles, news, websites, Marketing Development Division and so on.
2.4. Survey design and data collection procedure
The interview schedule, pre-testing, and data collection procedure were designed to show the clear outline methodology of the survey.
2.4.1. Data Types
For primary data collection, a major set of interview schedules was prepared to collect information from the ginger growers. Even some checklists were also prepared to collect information from the local collectors, wholesalers and exporters, and retailers too. All information regarding the socio-demographic situation, land holding, cost of production and marketing system, and price control was included in the interview schedule information. Interview schedule information included both close-ended and open-ended questionnaires, rankings, and multiple-choice too.
2.4.2. Pre-testing
The prepared questionnaire was pre-tested with 10 households for the refinement of the questionnaire before the final survey. Those 10 households were selected randomly from around 30 participants who attended the three-days long “Ginger-cultivation Training” organized by the PMAMP, PIU, Palpa, Nepal at their office located at Tansen Municipality, Palpa, Nepal. Those participants were mainly from the municipality and rural municipalities of our research site.
2.4.3. Techniques of data collection
Different methods of data collection such as household surveys through interview schedules, FGD, and Key informant interviews (KII) were used.
A semi-structured and pre-tested interview technique was employed in the interview for the collection of primary data. An interview technique was used to collect data from the ginger growers about the production, marketing, and value chain linkages with input suppliers, local collectors, and traders.
Some of the ginger growers along with traders were brought together for group discussion. The problems related to production, marketing, price control, different forms of value addition, etc. were discussed in groups to obtain the actual information of the study area.
Different key personnel like progressive farmers of ginger, cooperative member, technical officers of government and NGOs, and leaders were interviewed to obtain the required information.
2.4.4. Field survey
A field survey was conducted during March (2022)—May (2022). The respondents were interviewed by visiting their houses, trading areas, and markets.
2.5. Data analysis
At first, all the raw data obtained from the field were analyzed to obtain a certain conclusion. The primary sources consisted a semi-structure questionnaire in order to collect data from ginger farmers and traders, focus group discussions, key informant interview and telephone interview. On the other hand, secondary data related ginger production and trade was obtained from Ministry of Agriculture and Livestock Development (MoALD), Food and Agriculture Organization (FAO), Trade and Export Promotion Centre (TEPC), etc. Other secondary sources include books, open-access journals, websites and articles related to ginger cultivation and production. Both primary and secondary data were tabulated and analyzed by using Microsoft Excel and Statistical Package of Social Science (SPSS).
2.5.1. Socio-demographic and economic variables
Variables like population distribution, family size, educational status, land holding, etc. were analyzed by using simple descriptive statistics such as frequencies, percentages, mean, and standard deviation.
2.5.2. Benefit-cost analysis
Benefit-cost analysis was done after calculating the total variable cost and gross return from ginger cultivation. The cost of production was calculated by summing up all the variable cost items in the production process. Benefit-cost analysis was carried out by using the formula:
Where,
2.5.3. Price spread
The price spread is the difference between the farm-gate price and the retailer’s price, which can be calculated as
2.5.4. Producer’s share
Producer’s share is the price received by the farmer expressed as a percentage of the retail price, i.e., the price paid by the consumers. It can be calculated by the following formula:
Where,
= Producer’s share
= Producer’s price (Farm gate price)
= Retailer’s price
2.5.5. Marketing margin
Marketing margin can be calculated by subtracting both the net price received by producers and the marketing cost from the retailers’ sale price. Mathematically,
2.5.6. Cost of production
The cost of production includes the following activities:
Land preparation
Rent of land
Cost of inputs like FYM, seed, labor
The average cost of each input was calculated to find out the average variable cost, e.g., variable cost per kg of the rhizome.
2.5.7. Indexing
Also called as Force Ranking Technique, in this method, the qualitative data were analyzed by the use of indexes. Based on response frequencies, weighted indexes were calculated for analyzing farmers’ perceptions of the extent of production and marketing problems of ginger growers. Different production, technical, and marketing problems based on the importance of farmers’ response were analyzed by using a five-point scale of problems indicating more serious, serious, moderate, a little bit, and least serious by using 5, 4, 3, 2, and 1, respectively.
The index of importance will be computed by using the formula;
where,
Index of importance
∑ = Summation
cale value (i = 1, 2, 3, 4, 5)
Frequency of
mportance given by respondents
N = Total number of respondents
2.5.8. Value chain analysis
The value chain analysis outlines the entire range of tasks necessary to produce a good or service from conception to delivery to customers and eventual disposal following use. It was drawn and analyzed from the various existing value chains in the study area. For each separate chain in the research area, the margin to each actor in the value chain was computed along with the cost of production and price to the relevant stakeholders.
2.5.9. SWOT analysis
The strength, weakness, opportunities, and threats (SWOT) is one of the effective tools for analyzing the value chain of agricultural products. SWOT related to the ginger subsector was analyzed from the group discussion, interview, and key informants. It was done at each stage of the value chain, i.e., the production stage, collecting/trading stage, wholesaling, and retailing stages. The obtained information from different actors in the value chain was thus used in the analysis of SWOT.
3. Result and discussion
3.1. Economics of ginger production
The cost of production, return, gross margin, marketing margin, and production share of ginger production in the Palpa district, are discussed in this section.
3.1.1. Estimation of cost of production and B: C ratio of ginger
The cost of production refers to the outlay incurred as a result of production inputs such as seed, manure, fertilizer, labor, pesticides, irrigation, and other necessary inputs. Because ginger growing is a labor-intensive activity, it necessitates a greater quantity of various inputs to achieve a high yield per unit area. From Table , we can find that 61.01% of the total cost of production was consumed by seed alone. The average overall cost of production was found to be NPR. 324871.8 per hectare. The average overall revenue from selling ginger was found to be NPR. 344804.2 per hectare.
The ratio of total revenue per hectare to total variable cost per hectare is known as the benefit-cost ratio. The benefit-cost ratio for collected ginger was found to be 1.06 after calculating data from the study area. Because the benefit-to-cost ratio was greater than one, ginger farming can be considered a profitable enterprise. According to the study of economic analysis of ginger conducted by (Poudel et al., Citation2017) at different locations of Palpa, Nepal, the benefit-cost ratio was 1.09. These findings show that there has been a slight decrement in the benefit-cost ratio of ginger in Palpa, Nepal.
3.1.2. The estimated value of coefficients and related statistics of Cobb-Douglas production function of ginger production
The production function, specifically its functional form known as the Cobb-Douglas production function, is frequently used to illustrate the technological relationship between the quantities of two or more inputs (especially labor and physical capital) and the quantities of output that can be produced by those inputs. The Cobb-Douglas production function was created by labor economist Paul H. Douglas and mathematician Charles W. Cobb to fit Douglas’s empirical results for production, employment, and capital stock in U.S. manufacturing into a simple function (Miller, Citation2008). The estimated values of coefficients and related statistics of Cobb-Douglas production functions are shown in Table . Out of three independent variables included in regression analysis, the costs of seed and manure were both found to be significant at a 1% level of significance while the cost of human labour was not found statistically significant in ginger production in the study area. Similar study was conducted by (Acharya et al., Citation2019) at Salyan, Nepal, where, the costs on insect-pest management and labor were found significant while rhizome, farmyard manure and costs on fertilizer were found insignificant. In our study, the regression coefficient of seed cost was 0.588 which indicates that with a unit increase in seed cost, gross return could be increased by 0.588. Similarly, a unit increase in human labor could increase the gross return by 0.215, total manure cost could increase the gross return by 0.091. The results indicated that the explanatory factors in the model explained 94.2% of the variation in the dependent variables after taking an account of the degree of freedom. The sum of the regressions of all the inputs taken into account in the regression function turned out to be 0.894 which indicates that the production function exhibited an increase at decreasing return scale. This implies that if all the inputs specified in the production function are increased by unity, the gross return will increase by about 0.894.
Table 1. Cost of production and B:C ratio of ginger in Palpa, Nepal
Table 2. Cobb-Douglas production function of ginger production in Palpa, Nepal
3.1.3. Relationship between family type and annual income of ginger growers in Palpa, Nepal
According to the field study, the average annual income of the nuclear family was found to be NPR. 346428.57 while that of the joint family was found to be NPR. 302898.55 as shown in Table . The actual mean difference was found to be NPR. 43530.021. Since the p-value is 0.317 (i.e., 31.7%) which is greater than 10%, that means the average mean value of the annual income of the nuclear family and joint family is not significantly different. In comparison to other studies, the findings may actually differ. On the basis of the study conducted by (Prasai et al., Citation2021) at Jhapa, Nepal, the total annual household income of the average family of disadvantaged groups (DAGs) who practiced the home garden approach was NPR. 196025.56. On comparing with this study, our research showed higher annual income of the families.
Table 3. Relationship between family type and annual income of ginger growers in Palpa, Nepal
3.1.4. Relationship between grading of ginger and income from ginger in Palpa, Nepal
The field study conducted revealed that the average income from ginger cultivation when grading was performed, was found to be NPR. 50557.98, while the average income when grading was not performed, was found to be NPR. 24115 as shown in Table . Also, the mean difference between the income when grading performed and not performed was found to be NPR. 26442.98. Since the p-value is 0.00 (i.e., less than 1%), there is statistical evidence that the average income from ginger cultivation when grading was performed and not performed is significantly different and that the difference is statistically significant at a 1% level of significance.
Table 4. Relationship between grading of ginger and income from ginger in Palpa, Nepal
3.2. Value chain analysis
The term “value chain” refers to the entire set of activities necessary to produce a good or service from conception through the various stages of production (which involve a combination of physical transformation and input from various producers), delivery to the final consumer, and eventual disposal after use (Kaplinsky, Citation2000). The value chain’s process actors are the input suppliers, producers, processors, traders (wholesaler, retailer), and consumers.
An analysis of the ginger value chain was conducted to determine the connections and information flow within the chain, as well as the boundaries and connections between national and international chains. The major players were identified along with their relationship, the value addition at each link in the chain, and the strengths and weaknesses of the various chains that were active. The major functions, actors, and enablers in the ginger value chain are discussed in this study.
Figure shows the value chain mapping of ginger in Palpa, Nepal that reveals the relationship among actors, their functions along with the institutions responsible for creating an enbaling environment.
Figure 2. Value chain mapping of ginger in Palpa, Nepal.
3.2.1. Value chain of ginger
The average cost of production of fresh ginger for farmers of Palpa is NPR. 34.24 per kg, and they sold their produce at NPR. 40 per kg to local traders/collectors. Local traders sold their produce to Wholesalers (Butwal Municipality) at NPR. 55 per kg (if graded) and at NPR. 50 per kg (if non-graded). After adding transportation costs, storage costs, and standardization costs, the wholesalers sold their produce to retailers at NPR. 65 per kg. And finally, the retailers sold their produce to the consumers at NPR. 80 per kg as shown in Figure .
The average price paid by the consumers for fresh ginger was found to be NPR. 80 per kg at different marketplaces in Palpa district.
Thus, for fresh ginger,
Price spread = Retailers’ price—Farm gate price
= NPR. (80–40)
= NPR. 40
and, Producers’ share = (40/80) 100
= 50 %.
Figure 3. Local value chain (with price) of fresh ginger in Palpa, Nepal.
Likewise, the average cost of production of dried ginger for farmers of Palpa is NPR. 250 per kg and they sold their product at NPR. 300 per kg to local traders/collectors. Local traders sold their product to wholesalers at NPR. 600 per kg (if graded) and at NPR. 500 per kg (if non-graded). After adding transportation costs, storage costs, and standardization costs, the wholesalers sold their produce to retailers at NPR. 1000 per kg. And finally, the retailers sold their produce to the consumers at NPR. 1200 per kg as shown in Figure .
The average price paid by the consumers for dried ginger was found to be NPR. 1200 per kg at different marketplaces in our neighboring country (India) and some parts of Nepal.
Thus, for dried ginger,
Price spread = Retailers’ price—Farm gate price
= NPR. (1200–300)
= NPR. 900
and, Producers’ share = (300/1200) 100
= 25 %.
Figure 4. Local value chain (with price) of dried ginger in Palpa, Nepal.
3.2.2. Major actors of major channels
Out of the many channels of marketing ginger, major two channels were mostly followed by the actors, which are given below:
Channel I : Producer—Collector/Local Trader—Wholesaler—Local Retailer—Consumer
Channel II: Producer—Local Retailer—Consumer
Table shows some major actors involved in two major marketing channels of ginger in Palpa, Nepal. In the case of channel I, the fresh ginger when marketed from producer to consumer through local traders, wholesalers, and local retailers, the price raised from NPR. 34.24/kg (cost of production for ginger growers) to NPR. 80/kg (for consumers). A similar case was seen in channel II in the case of fresh ginger. While in the case of dried ginger (Sutho) in the channel I, the price was raised from NPR. 250/kg (for producers) to NPR. 1200/kg (for consumers). Also, in channel II, the price of dried ginger (Sutho) was raised from NPR. 250/kg (producers) to NPR. 1000/kg (consumers).
Table 5. Major actors involved in marketing channels of ginger in Palpa, Nepal
3.2.3. Marketing margin and producers’ share of ginger
From the field study, it was revealed that the market margin and producer’s share were quite different in the case of fresh ginger and dried ginger (Sutho) in both the marketing channels of ginger, which is presented in Table . In channel I, the marketing margin of fresh ginger was found to be NPR. 40 while that of dried ginger was found to be NPR. 900. Similarly, the producer’s share of fresh ginger was estimated as 50% and that of dried ginger (Sutho) was found to be 25% only in channel I. While in channel II, the marketing margin of fresh ginger was found to be NPR. 20 and that of dried ginger (Sutho) was estimated to be NPR. 500. Similarly, the producer’s share of fresh ginger was found to be 73.33% and that of dried ginger (Sutho) was estimated to be 50% only in channel II.
In a similar study conducted by (Gurung et al., Citation2021) at Rukum West, Nepal, it was found that the marketing margin of fresh ginger was NPR. 33.33 and the producer’s share was 62.97%. These outcomes fall halfway between channel I and channel II of our result in case of fresh ginger.
Table 6. Marketing margin and producers’ share of ginger in Palpa, Nepal
3.3. Market functions
The main role in the value chain for ginger is input supply, which helps farmers produce ginger. Rhizome seed, fertilizer, bio-pesticides, and other inputs available locally and through agro-vets, GOs, and NGOs can be used. Following manufacturing, local cooperatives and traders handled the collection function. The national traders at the enormous market then purchased the collected rhizome. The majority of the produce was sold in the Indian market by exporters or traders. Produce was only sold in part to domestic wholesalers. In local marketplaces, tasks like cleaning and processing were not done well.
3.3.1. Actors
3.3.1.1. Producers
The producers of ginger are farmers who grow it for financial gain. They cultivate their farm by purchasing the appropriate inputs from input suppliers. Farmers and their organizations, as well as co-operatives, had horizontal connections that allowed them to access loans as well as the inputs they needed. The ginger that was grown was sold to the local cooperatives or traders’ gathering centers. The majority of growers use local resources to raise ginger. Most farmers solely utilized organic manure.
3.3.1.2. Local traders/collectors
Ginger is gathered by local traders and collectors for marketing purposes. Farmers sold their harvest to neighborhood collectors. Farmers’ cooperative club in Palpa served as a collector for further ginger trade. The ginger is primarily collected by larger collectors or traders from regional dealers, collectors, or cooperatives.
3.3.1.3. Wholesalers and retailers
The ginger was delivered to national retailers or wholesalers from the collection point for collectors and local dealers. Retailers are the actors who eventually sold ginger to customers, whereas wholesalers were the ones who supplied the stuff to them. Due to their involvement in numerous transactions, wholesalers offer poor profit margins per product unit weight to retailers. Retailers have significant profit margins on each unit weight of the product they sell.
3.3.1.4. Exporters
Exporters of ginger to the Indian market could be regional or international merchants. Exporters trade with low prices per unit weight, and because of the new Indian government policy, price volatility, diminished bargaining strength, and lack of cleaning facilities in Nepal, there is little price fixation in agricultural areas.
3.3.1.5 Processors and end consumers
Because there are so few processing facilities in the study area, in Nepal, practically all of the ginger used for marketing and export is indeed fresh ginger. Consumers in the Indian market received the majority of the production.
3.3.1.6. Enablers
Organizations, institutions, and other bodies that create a supportive environment for the value chain are known as enablers. The government organizations National Spices Development Program (NSDP), National Agricultural Research Council (NARC), National Ginger Research Program (NGRP), Plant Protection Directorate (PPD), Agriculture Input Center (AIC), Department of Agriculture (DoA), The Federation of Nepalese Chamber of Commerce and Industry (FNCCI), HELVETAS Nepal and PMAMP are just a few examples.
Similarly, non-governmental bodies like Non-Governmental Organizations (NGOs), Community-Based Organizations (CBO), One Village One Technician (OVOT) Project for Agriculture Commercialization and Trade (PACT), and the District Chamber of Commerce and Trade (DCCT) are some examples.
3.4. Factors and players affecting the price of ginger
Different factors affect the price of ginger. A five points scaling technique (1, 0.8, 0.6, 0.4, 0.2) was applied to rank the factors that affect the price of ginger based on the farmers’ responses. The value obtained from the rank scale in Table showed that market information was the most important and decisive factor, followed by the cost of production, season, access to the market, and transportation system.
Table 7. Factors affecting the price of ginger
Different factors affect the price of ginger. A five points scaling technique (1, 0.8, 0.6, 0.4, 0.2) was applied to rank the players that affect the price of ginger based on the farmers’ responses. The value obtained from the rank scale in Table showed that Government was the most important and decisive player, followed by local collectors, cooperatives, wholesalers, and processors.
Table 8. Players affecting the price of ginger
3.5. Major problems and constraints
A five-point scaling technique (1, 0.8, 0.6, 0.4, 0.2) was applied to rank the production problems of ginger. Five major problems were identified during the field visit. A scaling technique was applied to find out the seriousness of the production problems. As per the result, the most serious problem in ginger production was the lower value of ginger and its products in the market followed by the prevalence of pests and diseases, lack of quality seed material, lack of technical knowledge and guidance, and lack of labor, irrigation, and other inputs as shown in Table . A similar study was conducted by (Parajuli et al., Citation2021) at Solukhumbu, Nepal, where the study found that white grub infestation was the major production problem of ginger.
Table 9. Ranking of production problems of ginger in Palpa, Nepal
A five-point scaling technique (1, 0.8, 0.6, 0.4, 0.2) was applied to rank the marketing problems of ginger. Five major problems were identified during the field visit. A scaling technique was applied to find out the seriousness of the production problems. As per the result, the most serious problem in the marketing of ginger was the unavailability of the right price at the market followed by a lack of transportation facilities, a lack of sufficient middlemen, a lack of market information, and a lack of storage and processing facilities as shown in Table . Findings may differ in other studies. According to a study conducted by (Parajuli et al., Citation2021), price fluctuation was the major marketing problem of ginger in Solukhmbu.
Table 10. Ranking of marketing Problems
3.6. SWOT analysis
Based on a group discussion of ginger growers, traders, and wholesalers, Key Informant Interviews (KII), and other secondary sources of information, a SWOT (Strengths, Weaknesses, Opportunities, and Threats) analysis was done and presented below in Table .
Table 11. SWOT analysis of ginger in Palpa, Nepal
4. Conclusion
This study identified the main players influencing the price of ginger as being the local government, cooperatives, distributors, and processors. It was also found that the price of the seed rhizome covered more than half of the total production cost. The calculation of the benefit-cost (B:C) ratio (1.06) showed that ginger production is profitable. The Cobb-Douglas model predicts that when the given variables of the production function are increased by unity, the gross return will increase by 0.895. There were several opportunities for ginger cultivation despite some drawbacks, including support from PMAMP, the presence of enablers and service providers, a demand for organic ginger, and the availability of high-quality seed. The continued use of the same land for cultivation, abrupt price changes, post-harvest loss due to export limitations, and price fixing by the Indian market are all threats to the ginger industry in the Palpa district. The study found that the primary marketing challenge was the lack of a suitable price in the market. The product’s value increased after being processed and exported to India. In order to add value, a cleaning and processing facility should be provided within the country. Therefore, the actors at each node in the value chain of ginger will ultimately profit by lowering production costs, expanding farms with effective management, establishing processing facilities for cleaning, grading, and product differentiation for value addition, stabilizing prices in the domestic market, and exporting new products to Asian and foreign countries. On the contrary, the ginger growers would be benefitted and satisfied if the government of Nepal provides more interventions to ginger growers and focuses on improvement of policies related to export.
Acknowledgments
The authors wholeheartedly owe their sincere and deep gratitude to the ginger farmers of the Palpa district for their continuous support throughout the research. They are always grateful to their parents whose guidance showed them the right path.
Disclosure statement
No potential conflict of interest was reported by the author(s).
Additional information
Funding
Notes on contributors

Raj Chaudhary
Raj Chaudhary, a persevering person with a keen interest in data analysis, statistics, and agricultural research, is a graduate student of BSc Agriculture at Agriculture and Forestry University (AFU), Nepal. His passion for agriculture and the environment led him to pursue a degree in this field. He gained hands-on experience through an internship at the Ginger zone of the Prime Minister Agriculture Modernization Project-Project Implementation Unit (PMAMP-PIU), Palpa, Nepal. He also worked as the Network Coordinator of Nepalese Youth For Climate Action (NYCA), Chitwan Chapter for the tenure 2021/2022.
Hom Nath Giri
Dr. Hom Nath Giri is working as Associate Professor of Department of Horticulture under the faculty of Agriculture at Agriculture and Forestry University, Rampur, Chitwan, Nepal.
Nama Raj Bhusal
Mr. Nama Raj Bhusal is Undergraduate agriculture scholar at Agriculture and Forestry University, Rampur, Chitwan, Nepal.
Shimran Dahal
Ms. Shimran Dahal is Undergraduate agriculture scholar at Himalayan College of Agricultural Sciences and Technology (HICAST), Kathmandu, Nepal.
Pratima Timalsina
Ms. Pratima Timalsina is Undergraduate agriculture scholar at Himalayan College of Agricultural Sciences and Technology (HICAST), Kathmandu, Nepal.
Niraj Bhandari
Mr. Niraj Bhandari is Undergraduate agriculture scholar at Agriculture and Forestry University, Rampur, Chitwan, Nepal.
References
- Acharya, N., Acharya, B., Dhungana, S. M., & Bist, V. (2019). Production economics of ginger (Zingiber officinale Rose.) in Salyan district of Nepal. Archives of Agriculture and Environmental Science, 4(4), 424–17. https://doi.org/10.26832/24566632.2019.040408
- ANSAB. (2011). VALUE CHAIN/MARKET ANALYSIS of the GINGER SUB-SECTOR in NEPAL. United States Agency for International Development.
- Aryal, M. (2022). Ginger farmers face hard times after market crashes. THE KATHMANDU POST.
- Aslani, A., Ghannadi, A., & Rostami, F. (2016). Design, formulation, and evaluation of ginger medicated chewing gum. Advanced Biomedical Research, 5(1), 5. https://doi.org/10.4103/2277-9175.187011
- Baruwadi, M. H., Akib, F. H. Y., & Bahua, M. I. (2020). Impact of agricultural extension performance on corn farmers household economy. Journal Austrian Society Agriculture Economics, 16(5), 137–146. 18158129.
- Dahal, B. R., & Rijal, S. (2020). Ginger value chain analysis: A case of smallholder ginger production and marketing in hills of central Nepal. Agricultural Science and Technology, 12(1), 1313–8820. https://doi.org/10.15547/ast.2020.01.006
- Gautam, J., Acharya, B., & Ahamad, S. (2018). Plant Protection Technology on ginger and Turmeric. Nepal Agricultural Research Council (NARC).
- Gurung, B., Regmi, R., Paudel, A., Paudel, U., Paudel, A., & Shrestha, S. (2021). Profitability, marketing, and resource use efficiency of ginger production in rukum west, Nepal. Archives of Agriculture and Environmental Science, 6(4), 426–435. https://doi.org/10.26832/24566632.2021.060403
- ICIMOD. (2017). Package of practices for Climate resilient value chains Development of selected vegetable crops and ginger in Barshong, Bhutan. Package of Practices for Climate Resilient Value Chains Development of Selected Vegetable Crops and Ginger in Barshong, Bhutan; ICIMOD Manual 2017/9 | HimalDoc
- Joshi, P., & Khanal, S. (2021). Production status, export analysis, and future prospects of ginger in Nepal. Archives of Agriculture and Environmental Science, 6(2), 202–209. https://doi.org/10.26832/24566632.2021.0602012
- Kaplinsky, R. (2000). Globalisation and unequalisation: What can be learned from value chain analysis? Journal of Development Studies, 37(2), 117–146. https://doi.org/10.1080/713600071
- Khanal, K. (2018). Factors affecting and marketing chain of ginger in Salyan district, Nepal. International Journal of Applied Sciences and Biotechnology, 6(2), 127–131. https://doi.org/10.3126/ijasbt.v6i2.20420
- Miller, E. (2008). An assessment of CES and Cobb-Douglas production functions. Congressional Budget Office. An Assessment of CES and Cobbs-Douglas Production Functions (cbo.gov).
- MoALD. (2014) . Statistical information on Nepalese Agriculture (2013/14). Ministry of Agricultural Development.
- MoALD. (2018) . Statistical information on Nepalese Agriculture (2016/17). Ministry of Agriculture Development.
- MoALD. (2021) . Statistical information on Nepalese Agriculture (2019/20). Ministry of Agriculture Development.
- MoALD. (2022) . Statistical information on Nepalese Agriculture (2020/21). Ministry of Agriculture Development.
- Parajuli, S., Thapa, K. B., Adhikari, K., Mahatara, B., & Budhathoki, S. (2021). Value-chain analysis of ginger sub-sector in Solukhumbu district, Nepal. Food and Agriculture Economics Review, 1(2), 127–133. https://doi.org/10.26480/faer.02.2021.127.133
- Poudel, R. R., Regmi, P. P., Thapa, R. B., Gc, Y. D., & Kc, D. B. (2017). Economic analysis of ginger cultivation in selected locations of Nepal. Bangladesh Journal of Agricultural Research, 42(4), 681–691. https://doi.org/10.3329/bjar.v42i4.35795
- Prasai, B. P., Devkota, D., Pant, K. K., & Timilsina, R. H. (2021). Assessment of the contribution of home garden and its component on household income and home garden income of disadvantaged groups (DAGs) in Jhapa district of Nepal. International Journal of Environment, Agriculture and Biotechnology, 6(4). https://doi.org/10.22161/ijeab.64.3
- Shakya, D. (2005). A study report on trade competitiveness of off-season vegetables and ginger in selected districts in Western Development region of Nepal under cooperative Grant Agreement Project between USAID and FNCCI improving the policy environment for Agricultural tr. Federation of Nepalese Chambers of Commerce and Industry Agro Enterprise Center (AEC/FNCCI).
- TEPC. (2018). Nepal Foreign Trade Statistics F. Y. 2075/076 trade & export promotion centre (vol. 076). Accounting For Financial Analysis And Planning (tepc.gov.np)
- TEPC. (2020). NEPAL FOREIGN TRADE STATISTICS F. Y. 2019/20 trade & export promotion centre. Annual_FTS_pdf.pdf (customs.gov.np)
- Upadhyaya, S., Adhikari, R. K., Karki, L. B., & Singh, O. P. (2020). Production and marketing of ginger: A case study in Salyan district, Nepal. International Journal of Environment, Agriculture and Biotechnology, 5(4). https://doi.org/10.22161/ijeab.54.38