
 ?Mathematical formulae have been encoded as MathML and are displayed in this HTML version using MathJax in order to improve their display. Uncheck the box to turn MathJax off. This feature requires Javascript. Click on a formula to zoom.
Abstract
The combined impacts of land use/land cover (LULC) changes and climate change are significantly affecting soil and water ecologies, calling for proper natural resource management. The aims of this study were to assess the LULC dynamics between 1987 and 2050 and estimate the impact of LULC and climate changes (under two climate scenarios (RCP4.5 & RCP8.5)) on soil erosion rate in Sile watershed, Ethiopian rift valley lakes basin (ERVLB). A supervised method with maximum likelihood classification was applied in the ERDAS Imagine software for assessing the LULC of 1987, 2003, and 2020. A classified past LULC map serves as a baseline to predict 2050 LULC by considering different driver variables using Multi-Layer Perceptron Neural Network and Cellular Automata-Markov Chain Model integrated with TerrSet software. A revised universal soil loss equation model (RUSLE) has been used to compute an input parameter in ArcGIS to estimate the rate of soil loss. The input parameters were erosivity (R-factor), soil erodibility (K-factor), topography (LS-factor), conservation practice (P-factor), and cover (C-factor). The findings revealed that with the business-as-usual scenario, the substantial LULC alteration will be prolonged over the coming several years. The average soil loss under the RCP4.5 and RCP8.5 scenarios with a future 2050 LULC was predicted to be 56.48 t-ha−1 year−1 and 57.11 t-ha−1 year−1 and then it will be expected to increase 36.40% and 38.19%, respectively. In order to sustainably manage the natural resources, interventions in prioritized sub-watersheds have been suggested at present and for the future. Additionally, it needs ecological sound conservation policies and strategies to mitigate the adverse impacts of climate change on soil erosion.
PUBLIC INTEREST STATEMENT
Climate change is a global concern affecting many landscape characteristics. Land use changes as an important variable in soil erosion are expected to change under projecting climatic scenarios. Evaluation of future soil erosion is crucial for devising appropriate interventions. Moreover, research results from such studies contribute to planning, decision-making, and policy development which could make possible sustainability of natural resources.
1. Introduction
Land is an essential resource and principal basis for human well-being and livelihood as it provides us food, shelter, and multiple other ecosystem services (Mahata & Sharma, Citation2021; Prăvălie, Citation2021). As the global population continues to grow, so does the demand for land. However, land is a finite resource, and its availability is limited (Mueller et al., Citation2014). Therefore, the competition among these uses puts immense pressure on available land resources (UNCCD, Citation2019). Consequently, the lands’ positive multidimensional role has been heavily altered over the past decades, amid large-scale land degradation that has affected numerous ecosystems across the globe (Prăvălie, Citation2021).
Land degradation is a pressing environmental issue that poses a substantial threat to the ecosystems, food security, and socio-economic stability worldwide (AbdelRahman, Citation2023; Roy et al., Citation2022). These impacts tend to be more severe for communities whose livelihoods directly depend on land resources (Pricope et al., Citation2022). Land degradation is influenced by a combination of social (e.g., population pressure, land tenure system, and cultural practices), economic (e.g., market demand and economic policies), ecological (e.g., climate change, loss of biodiversity, and soil erosion), and physical (e.g., geomorphology, hydrology, and natural disasters) drivers. These drivers can vary in significance depending on the region and context, but they often interact and exacerbate each other (Mahata & Sharma, Citation2021).
Soil erosion is one of the most important forms of land degradation (Prăvălie, Citation2021; Vanmaercke et al., Citation2021). Soil erosion results in a multitude of negative effects, such as reducing the water-holding capacity and infiltration rates, decreasing organic matter and nutrients, degrading soil structure, and reducing soil depth (Poesen, Citation2018; Sartori et al., Citation2019). Soil erosion under climate change is most directly affected by the changes in extreme precipitation (Eekhout & de Vente, Citation2022; Roy et al., Citation2022; Teng et al., Citation2018). According to the Fifth Assessment Report (AR6) of the IPCC (Intergovernmental Panel on Climate Change), global mean precipitation and surface temperature have changed significantly, and these changes are very likely to continue during the twenty-first century (IPCC, Citation2022). Recent projections indicate that the rate of soil erosion will increase globally (Borrelli et al., Citation2020). It is also well thought that land use land cover (LULC) change has a significant impact on soil erosion as well, and interacts with climate change (Bogale, Citation2020; Eekhout & de Vente, Citation2022).
Assessing the impact of LULC and climate change on soil erosion is crucial to understand its environmental challenges, identify erosion-prone areas and develop effective soil and water conservation (SWC) measures (Kanito & Feyissa, Citation2021). Estimation of soil erosion involves a diverse array of methodologies and tools (Borrelli et al., Citation2021; Guo et al., Citation2019). Field-based methods like sediment sampling and erosion plot studies provide more detailed and direct measurement (Hsieh, Citation2022). Empirical and process-based models consider factors such as climate, soil properties, slope, and land cover to predict erosion rates (Borrelli et al., Citation2021). Among them, the Revised Universal Soil Loss Equation (RUSLE) has been extensively used to estimate the long-term effects of climate and LULC changes on soil erosion rates (Borrelli et al., Citation2021; Teng et al., Citation2018). Moreover, remote sensing and Geographic Information Systems (GIS) play a pivotal role in soil erosion assessment, offering powerful tools to monitor and combat this critical environmental challenge (Chaminé et al., Citation2021). The integration of RUSLE with GIS can provide a comprehensive erosion quantification framework (Girma & Gebre, Citation2020; Moges & Bhat, Citation2017; Phinzi & Ngetar, Citation2019).
Soil erosion in the Ethiopian Rift Valley lakes basin (ERVLB) is a significant environmental challenge, with widespread and severe consequences (Aga et al., Citation2018; Taye et al., Citation2023). It is exacerbated by anthropogenic (e.g., deforestation, unsustainable agricultural practices, and overgrazing) and natural factors (e.g., rainfall and topographic variability). The combination of these factors has led to extensive soil degradation, loss of fertile topsoil, reduced agricultural productivity, biodiversity loss, and sedimentation in rivers and lakes (Ayalew et al., Citation2022; Moges et al., Citation2020; Roy et al., Citation2022). The expansion of agricultural land at the expense of forestlands, grasslands, and shrublands was the most detrimental factor for severe soil erosion risks (Girma et al., Citation2023; Moisa et al., Citation2021; Wassie, Citation2020). This could get worse in the future because of the forecasted increase in population and the occurrence of extreme climate events throughout the 21st century (Eekhout & de Vente, Citation2022; Saha et al., Citation2022).
Given the potential for climate and LULC change to increase soil erosion, assessing climate and LULC change impact on soil erosion is essential to implement proper watershed management interventions and local climate adaption strategies (Belay & Mengistu, Citation2021; Moisa et al., Citation2021). Moreover, interventions are local-characteristics specific that could not be obtained from recommendations on the shelf, thus requiring specific studies in areas of concern. In this context, no study has yet been conducted to provide scientific evidence about the impact and trends of past and future climate and LULC dynamics in the Sile river watershed, ERVLB. This knowledge gap is crucial as it allows for a more comprehensive understanding of the environmental changes occurring in the watershed. Therefore, the objectives of this study were to (i) assess the long-term (1987–2050) LULC changes and (ii) quantify the combined impact of LULC and climate changes on soil loss rate in the Sile river watershed.
2. Materials and methods
2.1. Study area
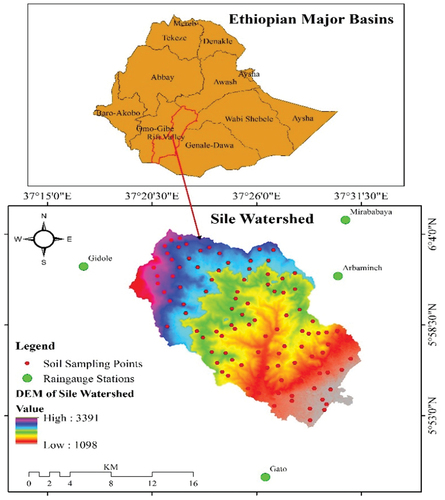
Sile River watershed is located in the ERVLB and geographically located between 5°50″30′–6°4″30′ N latitude and 37°17′30″–37°35′0″ E longitude (Figure ). Sile River flows from west to east and drains into Lake Chamo. The watershed encompasses two districts, Arbaminch zuria and Bonke districts, and covers an area of 27,610 hectares. The watershed receives mean annual rainfall of 941 mm and average minimum and maximum temperatures were 14°C and 33.5°C, respectively.
Figure 1. Location of the study area.
2.2. Dataset
To estimate the soil loss and identify erosion hotspots in the watershed, various datasets from different sources were collected. The observed daily rainfall data were collected from the Ethiopian Meteorology Institute for the period of 1987 to 2020 (Table ). Missing rainfall data were filled by using the Normal Ratio method (Sanusi et al., Citation2017). A total of 102 composite soil samples were collected using stratified random sampling. Soil textural classes were identified using the standard hydrometer method (Gavlak et al., Citation2005) and soil organic carbon content was determined by Walkley and Black method (Walkley & Black, Citation1934). Cloud-free satellite imageries were downloaded from the United States Geological Survey (https://earthexplorer.usgs.gov/) (Table ). The acquisition years (1987, 2003, and 2020) were selected considering the nationwide famine, regime change of the country, and the recent green legacy initiative, respectively (Girma et al., Citation2022).
Table 1. The metrological stations and satellite data used in this study
Topographic features were characterized using 30 m resolution digital elevation model (DEM) available at https://search.earthdata.nasa.gov/search. In addition, population density and proximity to road and river were considered as driver variables to predict the future (2050) LULC change (Girma et al., Citation2022). These data were acquired from OpenStreetMap (https://www.openstreetmap.org/) and Water and Land Resources Center (wlrc-eth.org). To estimate the future soil loss, an ensemble of four RCM models (Table ) under two representative concentration pathway (RCP) (4.5 and 8.5) scenarios were considered. These RCMs were downloaded from the Coordinated Regional Climate Downscaling Experiment (CORDEX) Africa domain (https://esgf-data.dkrz.de/search/esgf-dkrz/).
Table 2. Description of the driving GCMs used in this study
2.3. Land use land cover analysis
Image pre-processing (layer stacking, haze, and noise reduction), classification using the maximum likelihood classification (MLC) algorithm, and post-processing were performed in ERDAS imagines 2016 (Leta et al., Citation2021). Based on the analyst’s experience/knowledge of the area, seven LULC classes were identified (Table ) and statistically validated using equations (Kafy et al., Citation2021). Ground truthing points (GTPs) collected from Google Earth (485) were used to assess the accuracy of the 1987 and 2003 LULC classification, whereas the GTPs collected during field surveys (281) were used to assess the accuracy of the 2020 LULC classification (Garedew et al., Citation2009; Leta et al., Citation2021).
Table 3. Major LULC types and their descriptions (Bewket & Teferi, Citation2009; Gelagay & Minale, Citation2016)
The 2050 LULC was predicted using Multi-Layer Perceptron Neural Network (MLP_NN) and Cellular Automata-Markov Chain (CA-MC) model in the TerrSet 18.32 (Girma et al., Citation2022). Details of MLP_NN and CA-MC model description and procedure used are given in Girma et al. (Citation2022). In this study, slope, elevation, population density, and distance from stream and road were used as driver factors. Kappa statistic index was applied to validate the skill of MLP_NN and CA-MC models using the actual (2020) and predicted (2020) LULC (Girma et al., Citation2022; Leta et al., Citation2021). Finally, a long-term LULC change detection analysis on total gain or loss, percent change and rate of change (ha/yr) was performed (Dibaba et al., Citation2020; Girma et al., Citation2022).
2.4. Statistical validation of regional climate models
Distribution mapping (DT) bias correction method was employed to adjust the systematic errors in RCMs using Climate Model data for hydrologic modeling (CMhyd) software. Moreover, the performances of the ensemble average RCM model were evaluated using three statistical measures (EquationEquation 1(1)
(1) -Equation3
(3)
(3) ): correlation coefficient (R2), root-mean-square error (RMSE), and Nash–Sutcliffe measure of efficiency (NSE) (Girmay et al., Citation2021). The correlation coefficient (R2) is often used to evaluate the linear relationship between mean monthly RCM rainfall and observed rainfall. Values close to 1.0 indicate a better linear relationship between the variables and a value away from 1.0 indicates less agreement. Root Mean Square Error measures how much error there is between two data sets. An RMSE value close to zero indicates better performance (Worku et al., Citation2018). Nash–Sutcliffe efficiency indicates how well the observed versus simulated data fits the 1:1 line. NSE = 1 corresponds to a perfect match of the model to the observed data (Nash & Sutcliffe, Citation1970).
where, is rainfall of RCMs,
is observed rainfall, the bar over the variables denotes the average throughout 2006–2020, and N represents the analysis period (15 years).
2.5. Soil loss estimation
The study integrated GIS with RUSLE to estimate the soil loss. RUSLE is empirically expressed by EquationEquation 4(4)
(4) (McCool et al., Citation1995; Meshesha et al., Citation2012; Wolka et al., Citation2015) and considered the following input variable: rainfall–runoff erosivity (R-factor), soil characteristics (K-factor), topography (LS-factor), land cover management (C-factor), and support practice (P-factor). In order to estimate the future soil erosion, the values of C, P, and R factors were changed while the others kept constant.
where, A is the amount of soil erosion (t-ha-1 year-1), R is a rainfall-runoff erosivity factor (MJ mm ha−1 hr −1year −1), K is a soil erodibility factor (t-hr −1 MJ −1 mm−1), LS is slope length and steepness factor (dimensionless), C is a cover management factor (dimensionless), P is support practice factor (dimensionless);
2.5.1. Rainfall-runoff erosivity factor (R)
The R value was calculated using Equationequation 5(5)
(5) which was developed by Hurni (Citation1985) for Ethiopia and used by several authors (Belay & Mengistu, Citation2021; Yesuph & Dagnew, Citation2019). The observed point data was transformed into a spatial dataset using inverse distance weight (IDW) interpolation algorithm in ArcGIS 10.8. The baseline erosivity factor maps were prepared for the three reference years (1987, 2003, and 2020). Therefore, the annual rainfall data of the year 1987 from four sations, the mean annual rainfall data from 1987 to 2003, and the mean annual rainfall data from 1987 to 2020 were used to estimate the R factor value for the years 1987, 2003, and 2020, respectively.
where, P is the mean annual rainfall in (mm)
2.5.2. Soil erodibility factor (K)
The K-factor value was estimated using Equation 6 (Williams, Citation1995) and raster map was generated.
where, fcsand is a factor that gives low soil erodibility factors for soils with high coarse-sand contents and high values for soils with little sand, fcl-si is a factor that gives low soil erodibility factors for soils with high clay to silt ratios, forgC is a factor that reduces soil erodibility for soils with high organic carbon content, and fhisand is a factor that reduces soil erodibility for soils with extremely high sand contents. The different factors indicated in equation 6 are determined using Equationequations 7(7)
(7) -Equation10
(10)
(10) (Neitsch et al., Citation2002).
where, ms the percent is the sand content (0.05–2.00 mm diameter particles), msilt is the percent silt content (0.002–0.05 mm diameter particles), mc is the percent clay content (<0.002 mm diameter particles), and orgC is the percent organic carbon content of the layer (%).
2.5.3. Topography factor (LS)
The LS factor value was determined by using Equationequation 11(11)
(11) developed by Moore and Wilson (Citation1992).
where, β is flow accumulation, χ is grid cell size (30), 22.13 is the RUSLE standard plot length, is the slope in degrees (i.e., slope of DEM × 0.01745), and 0.5 is the exponent of slope length.
2.5.4. Cover management factor (C)
The derived thematic LULC raster map was imported in ArcMap to assign the corresponding C-factor values adopted from different literature (Table ) and to generate a raster map of the C-factor.
Table 4. Land cover classes and assigned cover (C) factor values
2.5.5. Support practice factor (P)
In this study, we used the P-values suggested by Wischmeier and Smith (Citation1978), which consider only two types of land uses categories, agricultural and non-agricultural, to determine the P-value. Thus, the agricultural lands are classified into six slope categories and assigned P-values, while all non-agricultural lands were assigned a P-value of 1 (Table ).
Table 5. LULC and slope classes with assigned P-values
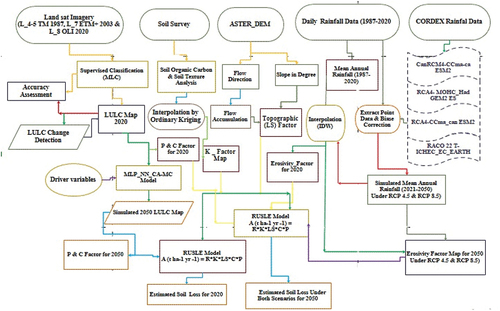
Finally, the estimated annual soil loss rate was categorized into five classes: very slight (0–5 t ha yr−1), slight (5–11 t ha yr−1), moderate (11–30 t ha yr−1), severe (30–50 t ha yr−1), severe (45–60 t ha yr−1), and very severe (>50 t ha yr−1) to identify priority areas for landscape restoration (Gashaw et al., Citation2020). Figure shows the overall methodological framework.
Figure 2. Overall study framework used to estimate soil erosion.
3. Result and discussion
3.1. Land use and land cover
The user, producer, and overall accuracies for the different land uses are given in and kappa analysis Table with respect to each year. The result indicates that it is more than the substantial range (≥85%) ensuring a strong level of acceptance (Girma et al., Citation2022).
Table 6. Classification accuracy assessment result for 1987, 2003, and 2020
In 1987, the dominant land cover type was shrubland followed by cultivation land and grazing land. The highland part was dominated by forestlands, the midland part of the watershed was dominantly covered by cultivation land, while the low-lying areas were dominated by shrublands Figure . Banana cover was observed on the lower part cloth to the outlet of the watershed. In 2003 and 2020, cultivation land became a major LULC class followed by shrubland and forestland Figure . During these years, bare land was significantly expanded in the middle part of the watershed, while the banana land cover was also increased in the lower part of the watershed. Over the last three decades, Sile River watershed showed massive LULC changes, particularly, the expansion of cultivable lands at the expense of natural vegetation (forestland, shrubland, and grazing land). Moreover, the expansion of banana land cover and bare land was also observed. The result is consistent with previous studies conducted in Ethiopia. For example, Belihu et al. (Citation2020), Dibaba et al. (Citation2020), Regasa et al. (Citation2021), and Girma et al. (Citation2022) indicated that cultivation land and bare land were increased during the last decades in a dramatic manner, while the area covered by forest, grazing land, and shrubland decreased. The ever-increasing human population and the subsequent increased demands on land and water resources are the major driving factors (Dibaba et al., Citation2020; Regasa et al., Citation2021; WoldeYohannes et al., Citation2018).
Figure 3. LULC map (a) 1987, (b) 2003, (c) 2020, and (d) 2050 in Sile watershed.
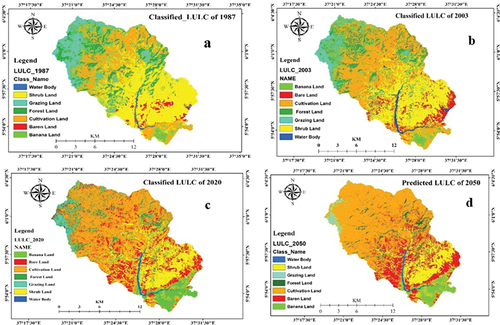
The 2050 LULC with business as usual scenarios (BAU) were analyzed. The kappa statistics index value (>0.8) indicated the better performance of the MLP_NN and CA-MC in simulating future (2050) LULC (Koko et al., Citation2020; Leta et al., Citation2021). As shown in Table and Figure , cultivation land, barren land, and the banana LULC were increased from 12,793 ha to 14,562 ha, 4,133 ha to 4,791 ha, and 1,257 ha to 1,631 ha, respectively. However, shrubland, forestland, and grazing land will decrease by 2050. Similarly, studies also revealed the expectation of these trends in the future (Girma et al., Citation2022; Regasa et al., Citation2021).
Table 7. Expected change of future LULC (2050) in study area
3.2. Performance of RCMs
The correlation of RCP 4.5 and RCP 8.5 ensemble average rainfall data with observed rainfall data ranged from 0.699 to 0.794 and 0.50 to 0.802 from different stations, respectively (Table ). In both the scenarios (RCP 4.5 and RCP 8.5) the ensemble mean of rainfall data was better correlated with the observed stations. The result of Nash–Sutcliffe efficiency (NSE) and root mean square error (RMSE) in both scenarios also confirmed that there was a better relationship in performance between the observed and simulated rainfall. The ensemble average performed better than individual simulated RCM models (Belay & Mengistu, Citation2021; Worku et al., Citation2018). Therefore, in this study, four RCM models’ ensemble mean under two scenarios was computed and used to generate an R factor value for 2050.
Table 8. Ensemble RCM performance evaluation
3.3. Spatial distribution of the RUSLE factors
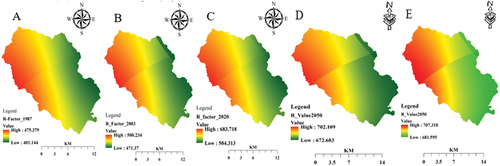
It was observed that the highest R value was recorded in the upper western part of the watershed and lowest towards the low-lying areas in the east (Figure ). The erosivity (R) factor value showed an increasing trend from 1987 to 2050. The result indicated that the spatial distribution of R varied due to the spatial distribution of the long-term mean annual rainfall. The relative higher R value is associated with more rainfall power to erode the soil and thus higher vulnerability to erosion (Kebede et al., Citation2021).
Figure 4. R factor map (A) 1987, (B) 2003, (C) 2020, (D) 2050 under RCP 4.5, and (E) 2050 under RCP 8.5.
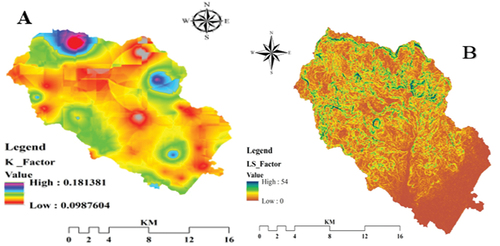
Five soil textural classes were identified, the upper part is dominated by clay, clay loam, and sandy textural class, whereas the lower and middle parts of the watershed were dominated by silty clay loam and sandy clay loam. The soil organic carbon content ranged from 0.128% to 3.9%. The soil erodibility (K) value ranged from 0.1 to 0.18 t-ha−1 MJ−1 mm−1. The highest K-factor value of soil is associated with loamy (very fine sand with silt) particle, thus highly susceptible to detachment and erosion (Kebede et al., Citation2021). The LS value varied from 0 in the lower part of the watershed to 54 in the steepest and upper part of the watershed (Figure ). The higher the LS value, the higher the area is susceptible to soil erosion by water (Girma & Gebre, Citation2020).
Figure 5. K factor (A) and LS factor (B) map of Sile watershed.
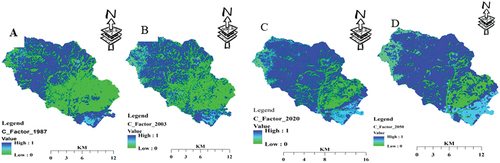
The cover management (C) factor value map is generated in Figure ; the value varied from 0 to 1. The C value is considered as dynamic factors that vary over time (Kavian et al., Citation2017; Woldesenbet et al., Citation2020). Therefore, four different C-factor maps were generated for the year 1987, 2003, 2020, and 2050 (Figure ). Lower C values were observed in the low-lying areas of the watershed. On the contrary, higher C values can be seen in the central and upper parts of the catchment where a large portion of the land is characterized by farmlands and bare soil. The higher C value areas were more prone to water erosion and hence greater soil loss is expected (Olorunfemi et al., Citation2020).
Figure 6. Cover (C) factor map (A) 1987, (B) 2003, (C) 2020, and (D) 2050.
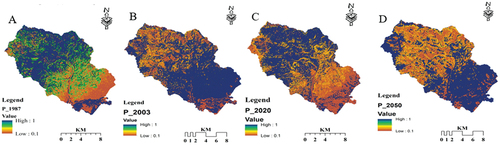
The conservation practice (P) factor is controlled by the correlation between the slope in percent and LULC of the study area. The highest P-value of the watershed was found in the upstream part of the study area, but the smallest value was indicated in the downstream and midstream parts of the watershed. Four different P-factor maps were prepared for the year 1987, 2003, 2020, and 2050 (Figure ). The results indicated that the distribution of the P-factor ranges from 0.1 to 1. The lower P value indicates relatively better soil erosion control measures.
Figure 7. Practice (P) factor map for 1987 (A), 2003 (B), 2020 (C), and 2050 (D).
3.4. Soil loss estimation
The average annual soil loss (A) was calculated by overlaying the preceding five maps using RUSLE with the help of ArcGIS. The result indicated that the mean annual soil loss for the year 1987, 2003, and 2020 were 13.05 t ha−1 year−1, 21.04 t ha−1 year−1, and 41.41 t ha−1 year−1, respectively. The total annual soil loss in the study area was 389,456 t year−1, 616,669 t year−1, and 1,184,920 t year−1 for the year 1987, 2003, and 2020, respectively. The findings are consistent with previous studies conducted in different parts of Ethiopia (Gezahegn & Arus, Citation2020; Kebede et al., Citation2021; Molla & Sisheber, Citation2017). The predicted (2050) total annual soil loss under RCP4.5 and RCP8.5 was 1,469,375 t year−1 and 1,485,810 t year−1 with averge estimates of 56.48 t ha−1year−1 and 57.11 t ha−1 year−1, respectively. In order to identify hotspot areas, soil loss values were categorized into five soil erosion severity classes (Figure ). Most of the upper and central parts of the watershed were characterized by high erosion risk category (>30 t ha−1 year−1) and susceptibility to water erosion. These areas generate considerable runoff and are characterized as areas of high erosion hotspots that require principal soil and water conservation measures.
Figure 8. The mean annual soil loss: (A) 1987, (B) 2003, (C) 2020, (D) 2050-RCP4.5, and (E) 2050-RCP8.5.
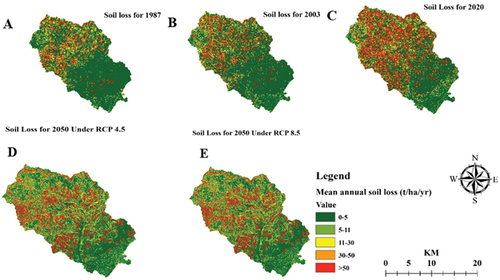
The analysis showed the increasing trends of soil loss in the past and will also be extended in the future under both scenarios. For example, the mean annual soil loss from 1987 to 2003 and 2003 to 2020 was augmented by 61% and 97%, respectively. The predicted mean annual soil loss under RCP4.5 and RCP8.5 will increase by 15.07 t ha−1 year−1 (36%) and 15.7 t ha−1 year−1 (38%) as compared to the baseline period (2020), respectively. These results were attributed to the temporal variation of climate variables (i.e. increased in R value) and detrimental changes in LULC (C and P factor values). According to previous studies (Girmay et al., Citation2021; Negese et al., Citation2021), LULC alteration and climate change played a significant role in the spatiotemporal variability of the soil erosion rate. Table describes the estimated soil loss per each LULC type. Accordingly, very severe soil loss rates were recorded in bare land and cultivation land, moderate mean annual soil loss was estimated from grazing land, while the lowest average annual soil loss was contributed from banana land cover, forest, and shrubland. Thus, besides its economic feasibility (Ambisa et al., Citation2019), the banana land cover played a vital role in mitigating the soil erosion risk in the study watershed.
Table 9. Soil erosion under different LULC classes in the study watershed
To identify the spatial variation, extent of soil loss, and prioritize for intervention planning, the study watershed was subdivided into 10 sub-watersheds (Figure ) and categorized into five erosion severity classes (Table ). Around 63% (most of the lower areas) of the watershed was found to be between very slight and slight erosion risk. On the contrary, 29% of the Sile watershed was experiencing severe and very severe soil losses. Moreover, the highest amount of soil loss (42%) was contributed from subwatershed numbers 4 and 5. Therefore, these subwatersheds were the first priority for watershed management planning and implementation. Moreover, the results when compared with the tolerable soil loss value in Ethiopia (Hurni, Citation1985), 16–22 t ha−1 year−1 all sub watershed exceeded the level in different extents. Over 46% area of subwatersheds 1–6 are affected by high soil erosion (>11 t ha−1 year−1) demanding interventions for sustainability of the soil resource.
Figure 9. Estimated soil erosion severity classes based on sub-watershed level in Sile watershed.
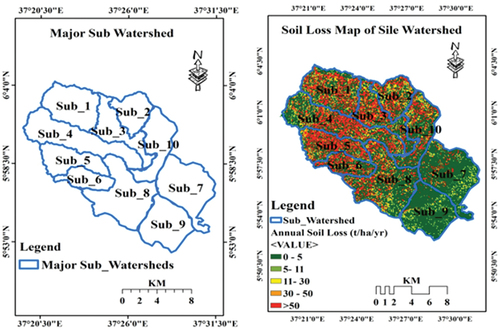
Table 10. Soil erosion severity in sub-watershed level and conservation priority class
5. Conclusion
The study was conducted in the Sile river watershed to assess the combined impact of LULC and climate changes on soil loss rate. The results revealed that the watershed has undergone significant landscape alterations and an alarming increase in soil erosion risk. From 1987 to 2020, there was a substantial shift from natural vegetation (forestland, shrubland, and grazing land) to cultivation land, along with an expansion of banana farming and barren land driven primarily by the increasing demands for land and water resources of a growing human population. Projection for 2050 under business as usual scenarios indicated further expansion of cultivation, banana, and barren lands. The results indicated an increasing trend in soil erosion rates from 1987 to 2050 with substantial annual soil loss, especially in the upper and central parts of the watershed. The findings underscored the correlation between climate change and soil erosion, as evidenced by the rising erosivity factor (R) and the estimated increase in soil loss. Notably, banana land cover appears to play a mitigating role in reducing soil erosion. The sub-watershed analysis underscored the urgent need for targeted watershed management strategies to mitigate the environmental and socio-economic consequences of soil erosion, with priority given to areas experiencing severe soil losses. Overall, addressing the challenges posed by land use and climate changes in the Sile river watershed requires a multidisciplinary and collaborative approach that integrates ecological, social, and policy dimensions to ensure sustainable land management and environmental protection. Additionally, future studies should focus on the effectiveness of different soil conservation strategies and their feasibility in mitigating soil erosion in the identified high-risk areas, taking into account more detailed socioeconomic factors.
Correction
This article has been corrected with minor changes. These changes do not impact the academic content of the article.
Acknowledgment
We are grateful to the Southern Agricultural Research Institute for financial support.
Disclosure statement
No potential conflict of interest was reported by the author(s).
Additional information
Funding
Notes on contributors
Birhanu Wolde
The first author, Birhanu Wolde (MSc), is a soil and water conservation researcher at the Agricultural Research Center in Arbaminch, Ethiopia. He has a background in natural resource management and specializes in soil and water conservation engineering.

Awdenegest Moges
Awdenegest Moges (PhD), is an Associate Professor in the Department of Biosystems Engineering, Hawassa University, Ethiopia. His research interests are soil degradation and conservation and watershed management. He has published articles related to soil degradation and conservation, land use dynamics, and land management aspects.
Rediet Grima
Rediet Girma (MSc) is a lecturer and researcher in the Department of Biosystems Engineering, Hawassa University, Ethiopia. His research interests are modeling soil erosion and land degradation, watershed management, morphometric analysis, land use change, GIS and remote sensing, climate change, and hydrology.
References
- AbdelRahman, M. A. E. (2023). An overview of land degradation, desertification and sustainable land management using GIS and remote sensing applications. Rendiconti Lincei Scienze Fisiche e Naturali, 34(3), 767–18. https://doi.org/10.1007/s12210-023-01155-3
- Aga, A. O., Chane, B., & Melesse, A. M. (2018). Soil erosion modelling and risk assessment in data scarce rift Valley lake regions, Ethiopia. Water, 10(11), 10. https://doi.org/10.3390/w10111684
- Ambisa, Z., Tesfa, B., Olani, T., & Abdeta, D. (2019). Review on the production and marketing of banana in Ethiopia. World Journal of Agriculture and Soil Science, 2(1), WJASS.MS.ID.000529. https://doi.org/10.33552/WJASS.2019.02.000529
- Angima, S. D., Stott, D. E., O’Neill, M. K., Ong, C. K., & Weesies, G. A. (2003). Soil erosion prediction using RUSLE for central Kenyan highland conditions. Agriculture, Ecosystems and Environment, 97(1–3), 295–308. https://doi.org/10.1016/S0167-8809(03)00011-2
- Ayalew, A. D., Wagner, P. D., Sahlu, D., & Fohrer, N. (2022). Land use change and climate dynamics in the rift Valley. Environmental Monitoring and Assessment, 194(11). https://doi.org/10.1007/s10661-022-10393-1
- Belay, T., & Mengistu, D. A. (2021). Impacts of land use/land cover and climate changes on soil erosion in Muga watershed, upper Blue Nile basin (Abay). Ethiopia Ecological Processes, 10(1), 1–23. https://doi.org/10.1186/s13717-021-00339-9
- Belihu, M., Abate, B., Tekleab, S., & Bewket, W. (2020). Hydrologic response to land use land cover change in the upper Gidabo watershed, Rift Valley Lakes Basin, Ethiopia. HydroResearch, 3, 85–94. https://doi.org/10.1016/J.HYDRES.2020.07.001
- Bewket, W., & Teferi, E. (2009). Assessment of soil erosion hazard and prioritization for treatment at the watershed level: Case study in the Chemoga watershed, Blue Nile Basin, Ethiopia. Land Degradation & Development, 20(6), 609–622. https://doi.org/10.1002/ldr.944
- Bogale, A. (2020). Review, impact of land use/cover change on soil erosion in the Lake Tana basin, upper Blue Nile, Ethiopia. Applied Water Science, 10, 235. https://doi.org/10.1007/s13201-020-01325-w
- Borrelli, P., Alewell, C., Alvarez, P., Anache, J. A. A., Baartman, J., Ballabio, C., Bezak, N., Biddoccu, M., Cerdà, A., Chalise, D., Chen, S., Chen, W., De Girolamo, A. M., Gessesse, G. D., Deumlich, D., Diodato, N., Efthimiou, N., Erpul, G. … Zhao, G. (2021). Soil erosion modelling: A global review and statistical analysis. Science of the Total Environment, 780, 146494. https://doi.org/10.1016/J.SCITOTENV.2021.146494
- Borrelli, P., Robinson, D. A., Panagos, P., Lugato, E., Yang, J. E., Alewell, C., & Ballabio, C. (2020). Land use and climate change impacts on global soil erosion by water (2015-2070). Proceedings of the National Academy of Sciences, 117(36), 21994–22001. https://doi.org/10.1073/pnas.2001403117
- Chaminé, H. I., Pereira, A. J. S. C., Teodoro, A. C., & Teixeira, J. (2021). Remote sensing and GIS applications in earth and environmental systems sciences. SN Applied Sciences, 3(12), 870. https://doi.org/10.1007/s42452-021-04855-3
- Dibaba, W. T., Demissie, T. A., & Miegel, K. (2020). Drivers and implications of land use/land cover dynamics in Finchaa catchment, Northwestern Ethiopia. Land, 9(113), 1–20. https://doi.org/10.3390/land9040113
- Eekhout, J. P., & de Vente, J. (2022). Global impact of climate change on soil erosion and potential for adaptation through soil conservation. Earth Science Review, 226, 103921. https://doi.org/10.1016/j.earscirev.2022.103921
- Garedew, E., Sandewall, M., Soderberg, U., & Campbell, B. M. (2009). Land-use and land-cover dynamics in the central Rift Valley of Ethiopia. Environmental Management, 44(4), 683–694. https://doi.org/10.1007/s00267-009-9355-z
- Gashaw, T., Worqlul, A. W., Dile, Y. T., Addisu, S., Bantider, A., & Zeleke, G. (2020). Evaluating potential impacts of land management practices on soil erosion in the Gilgel Abay watershed, upper Blue Nile Basin. Heliyon, 6(8), e04777. https://doi.org/10.1016/j.heliyon.2020.e04777
- Gavlak, R., Horneck, R., & Miller, R. O. (2005). Potassium fixation test (incubation method). Soil, Plant and Water Reference Methods for the Western Region, 1, 129–134. https://www.unm.edu/~unmvclib/cascade/handouts/westernstatesmethodmanual2005.pdf
- Gelagay, H. S., & Minale, A. S. (2016). Soil loss estimation using GIS and remote sensing techniques: A case of Koga watershed, northwestern Ethiopia. International Soil & Water Conservation Research, 4(2), 126–136. https://doi.org/10.1016/j.iswcr.2016.01.002
- Gezahegn, W., & Arus, E. (2020). Effect of land use and land cover change on soil erosion in erer sub-basin, Northeast Wabi Shebelle basin. Ethiopia, 9(4), 111. https://doi.org/10.3390/land9040111
- Girma, R., Fürst, C., & Moges, A. (2022). Land use land cover change modeling by integrating artificial neural network with cellular Automata-Markov chain model in Gidabo river basin, main Ethiopian rift. Environmental Challenges, 6, 100419. https://doi.org/10.1016/j.envc.2021.100419
- Girma, R., & Gebre, E. (2020). Spatial modeling of erosion hotspots using GIS-RUSLE interface in Omo-Gibe River basin, Southern Ethiopia: Implication for soil and water conservation planning. Environmental Systems Research, 9 (1). https://doi.org/10.1186/s40068-020-00180-7.
- Girma, R., Moges, A., & Fürst, C. (2023). Integrated modeling of land degradation dynamics and insights on the possible future management alternatives in the Gidabo river basin, Ethiopian rift valley. Land, 12(9), 1809. https://doi.org/10.3390/land12091809
- Girmay, G., Moges, A., & Muluneh, A. (2021). Assessment of Current and future climate change impact on soil loss rate of assessment of Current and future climate change impact on soil loss rate of Agewmariam watershed, Northern Ethiopia. Air, Soil and Water Research, 14, 1–11. https://doi.org/10.1177/1178622121995847
- Guo, Y., Peng, C., Zhu, Q., Wang, M., Wang, H., Peng, S., & He, H. (2019). Modelling the impacts of climate and land use changes on soil water erosion: Model applications, limitations and future challenges. Journal of Environmental Management, 250, 109403. https://doi.org/10.1016/j.jenvman.2019.109403
- Hsieh, Y. P. (2022). A field technology for soil erosion research: Conceptual analysis and preliminary results. Catena, 210, 105924. https://doi.org/10.1016/J.CATENA.2021.105924
- Hurni, H. (1985). Erosion–productivity–conservation systems in Ethiopia. IV International Conference on Soil Conservation November 3-9, 1985 Maracay, Venezuela, Page, 654–674.
- IPCC. 2022. Climate change 2022: Impacts, adaptation, and vulnerability. Contribution of working group II to the sixth assessment report of the Intergovernmental Panel on climate change. Cambridge University Press. Cambridge University Press. H.-O. Pörtner, D.C. Roberts, M. Tignor, E.S. Poloczanska, K. Mintenbeck, A. Alegría, M. Craig, S. Langsdorf, S. Löschke, V. Möller, A. Okem, B. Rama (eds.)https://doi.org/10.1017/9781009325844
- Kafy, A. A., Naim, M. N. H., Subramanyam, G., Faisal, A. A., Ahmed, N. U., Rakib, A. A., Kona, M. A., & Sattar, G. S. (2021). Cellular Automata approach in dynamic modelling of land cover changes using RapidEye images in Dhaka, Bangladesh. Environmental Challenges, 4, 100084. https://doi.org/10.1016/j.envc.2021.100084
- Kanito, D., & Feyissa, S. (2021). Comparison and applicability of selected soil erosion estimation models. Hydrology, 9(4), 79–87. https://doi.org/10.11648/j.hyd.20210904.12
- Kavian, A., Samaneh, H. S., Solaimani, K., & Jafari, B. (2017). Simulating the effects of land use changes on soil erosion using RUSLE model. Geocarto International, 32(1), 97–111. https://doi.org/10.1080/10106049.2015.1130083
- Kebede, Y. S., Endalamaw, N. T., Sinshaw, B. G., & Atinkut, H. B. (2021). Modeling soil erosion using RUSLE and GIS at watershed level in the upper beles, Ethiopia. Environmental Challenges, 2, 100009. https://doi.org/10.1016/j.envc.2020.100009
- Koko, A. F., Yue, W., Abubakar, G. A., Hamed, R., & Alabsi, A. A. N. (2020). Monitoring and predicting spatio-temporal land use/land cover changes in Zaria city, Nigeria, through an integrated cellular automata and Markov chain model (CA-Markov). Sustainability, 12(24), 1–21. https://doi.org/10.3390/su122410452
- Leta, M. K., Demissie, T. A., & Tränckner, J. (2021). Modeling and prediction of land use land cover change dynamics based on land change modeler (LCM) in Nashe watershed, upper Blue Nile Basin, Ethiopia. Sustainability, 13(7), 3740. https://doi.org/10.3390/SU13073740
- Mahata, S., & Sharma, V. N. (2021). The global problem of land degradation: A review. National Geographical Journal of India, 67(2), 216–231. https://doi.org/10.48008/ngji.1726
- McCool, D. C., Foster, G. R., Renard, K. G., Yoder, D. C., & Weesies, G. A.(1995).The revised universal soil loss equation. Department of Defense/Interagency Workshop on Technologies to address soil erosion on Department of Defense lands San Antonio, TX. Department of Defense.
- Meshesha, D. T., Tsunekawa, A., Tsubo, M., & Haregeweyn, N. (2012). Dynamics and hotspots of soil erosion and management scenarios of the central Rift Valley of Ethiopia. International Journal of Sediment Research, 27(1), 84–99. https://doi.org/10.1016/S1001-6279(12)60018-3
- Moges, D. M., & Bhat, H. G. (2017). Integration of geospatial technologies with RUSLE for analysis of land use/cover change impact on soil erosion: Case study in Rib watershed, north ‑ western highland Ethiopia. Environmental Earth Sciences, 76(22), 1–14. https://doi.org/10.1007/s12665-017-7109-4
- Moges, D. M., Kmoch, A., Bhat, H. G., & Uuemaa, E. (2020). Future soil loss in highland Ethiopia under changing climate and land use. Springer-Verlag GmbH Germany, 20(32). https://doi.org/10.1007/s10113-020-01617-6
- Moisa, M. B., Negash, D. A., Merga, B. B., & Gemeda, D. O. (2021). Impact of land-use and land-cover change on soil erosion using the RUSLE model and the geographic information system: A case of Temeji watershed, western Ethiopia. Journal of Water and Climate Change, 12(7), 3404–3420. https://doi.org/10.2166/wcc.2021.131
- Molla, T., & Sisheber, B. (2017). Estimating soil erosion risk and evaluating erosion control measures for soil conservation planning at Koga watershed in the highlands of Ethiopia. Advances in Fission-Track Geochronology, 8(1), 13–25. https://doi.org/10.5194/se-8-13-2017
- Moore, I. D., & Wilson, J. P. (1992). Length-slope factors for the revised universal soil loss equation: Simplified method of estimation. Journal of Soil and Water Conservation, 47(5), 423–428.
- Mueller, E. N., Wainwright, J., Parsons, A. J., & Turnbull, L. (2014). Patterns of Land Degradation in Drylands (p. 338). Springer. 978-94-007-5727-1. https://doi.org/10.1007/978-94-007-5727-1
- Nash, J. E., & Sutcliffe, J. V. (1970). River flow forecasting through conceptual models part I — a discussion of principles. Canadian Journal of Fisheries and Aquatic Sciences, 10(3), 282–290. https://doi.org/10.1016/0022-1694(70)90255-6
- Negese, A., Fekadu, E., & Getnet, H. (2021). Potential soil loss estimation and erosion-prone area prioritization using RUSLE, GIS, and remote sensing in Chereti watershed, Northeastern Ethiopia. Air, Soil and Water Research, 2021, 14. https://doi.org/10.1177/1178622120985814
- Neitsch, S. L., Arnold, J. D., Kiniry, J. R., Williams, J. R., & King, K. W. (2002). Soil and water assessment tool (SWAT) user’s manual, version 2000, Grassland soil and water Research Laboratory. Blackland Research Center, Texas Agricultural Experiment Station, Texas Water Resources Institute, Texas Water Resources Institute.
- Olorunfemi, I. E., Komolafe, A. A., Fasinmirin, J. T., Olufayo, A. A., & Akande, S. O. (2020). A GIS-based assessment of the potential soil erosion and flood hazard zones in Ekiti State, southwestern Nigeria using integrated RUSLE and HAND models. Catena, 194, 104725. https://doi.org/10.1016/j.catena.2020.104725
- Phinzi, K., & Ngetar, N. S. (2019). The assessment of water-borne erosion at catchment level using GIS-based RUSLE and remote sensing: A review. International Soil & Water Conservation Research, 7(1), 27–46. https://doi.org/10.1016/j.iswcr.2018.12.002
- Poesen, J. (2018). Soil erosion in the Anthropocene: Research needs. Earth Surface Processes and Landforms, 43, 64–84. https://doi.org/10.1002/ESP.4250
- Prăvălie, R. (2021). Exploring the multiple land degradation pathways across the planet. Earth Science Review, 220, 103689. https://doi.org/10.1016/j.earscirev.2021.103689
- Pricope, N. G., Daldegan, G. A., Zvoleff, A., Mwenda, K. M., Noon, M., & Lopez Carr, D. (2022). Operationalizing an integrative socio-ecological framework in support of global monitoring of land degradation. Land Degradation & Development, 34(1), 109–124. https://doi.org/10.1002/ldr.4447
- Regasa, M. S. R. M. N., Nones, M., & Adeba, D. (2021). A review on land use and land cover change in Ethiopian basins motuma. Land, 10(585), 1–18. https://doi.org/10.3390/land10060585
- Roy, P., Pal, S. C., Chakrabortty, R., Islam, A. R. M. T., Chowdhuri, I., & Saha, A. (2022). Impact of ineffective measures on the increasing land degradation in a monsoon-dominated region of India: Issues and policy implications. Land Degradation & Development, 33(16), 3174–3185. https://doi.org/10.1002/ldr.4380
- Roy, P., Pal, S. C., Janizadeh, S., Chakrabortty, R., Islam, A. R. M. T., Chowdhuri, I., & Saha, A. (2022). Evaluation of climate change impacts on future gully erosion using deep learning and soft computational approaches. Geocarto International, 37(26), 12709–12745. https://doi.org/10.1080/10106049.2022.2071473
- Saha, A., Pal, S. C., Chowdhuri Islam, A. R. M. T., Chakrabortty, R., & Roy, P. (2022). Threats of soil erosion under CMIP6 SSPs scenarios: An integrated data mining techniques and geospatial approaches. Geocarto International, 37(27), 17307–17339. https://doi.org/10.1080/10106049.2022.2127925
- Sanusi, W., Wan, W. Z., Mulbar, U., Danial, M., & Side, S. (2017). Comparison of the methods to estimate missing values in monthly precipitation data. International Journal on Advanced Science, Engineering and Information Technology, 7(6), 2168–2174. https://doi.org/10.18517/ijaseit.7.6.2637
- Sartori, M., Philippidis, G., Ferrari, E., Borrelli, P., Lugato, E., Montanarella, L., & Panagos, P. (2019). A linkage between the biophysical and the economic: Assessing the global market impacts of soil erosion. Land Use Policy, 86, 299–312. https://doi.org/10.1016/j.landusepol.2019.05.014
- Taye, G., Gashawbeza, T., Teka, D., & Kassa, H. (2023). Assessment of soil erosion hazard and its relation to land use land cover changes: Case study from alage watershed, central Rift Valley of Ethiopia. Heliyon, 9(8), e18648. https://doi.org/10.1016/j.heliyon.2023.e18648
- Teng, H., Liang, Z., Chen, S., Liu, Y., Rossel, R. A. V., Chappell, A., Yu, Z., & Shi, Z. (2018). Current and future assessments of soil erosion by water on the Tibetan Plateau based on RUSLE and CMIP5 climate models. Science of the Total Environment, 635, 673–686. https://doi.org/10.1016/j.scitotenv.2018.04.146
- UNCCD. (2019). Land degradation neutrality transformative projects and programs: Operational guidance for country support. Bonn.
- Vanmaercke, M., Panagos, P., Vanwalleghem, T., Hayas, A., Foerster, S., Borrelli, P., Rossi, M., Torri, D., Casali, J., Borselli, L., Vigiak, O., Maerker, M., Haregeweyn, N., De Geeter, S., Zgłobicki, W., Bielders, C., Cerdà, A., Conoscenti, C. … Jarihani, B. (2021). Measuring, modelling and managing gully erosion at large scales: A state of the art. Earth Science Review, 218, 103637. https://doi.org/10.1016/J.EARSCIREV.2021.103637
- Walkley, A., & Black, I. A. (1934). An examination of the degtjareff method for determining soil organic matter and a proposed modification of the chromic acid titration method. Soil Science, 37(1), 29–38. https://doi.org/10.1097/00010694-193401000-00003
- Wassie, S. B. (2020). Natural resource degradation tendencies in Ethiopia: A review. Environmental Systems Research, 9(1), 1–29. https://doi.org/10.1186/s40068-020-00194-1
- Williams, J. R. (1995). Chapter 25. The EPIC model. In V. P. Singh (Ed.), Computer models of watershed hydrology (pp. 227–236). Water Resources Publications.
- Wischmeier, W. H., & Smith, D. D. (1978). US Department of Agriculture Agriculture Handbook (Issue 537).
- Woldesenbet, A. B., Wudmatas, S. D., & Denboba, M. A. (2020). Enset-based land use land cover change detection and its impact on soil erosion in Meki river watershed, Western Lake Ziway Sub-Basin, Central Rift Valley of Ethiopia. Environmental Systems Research, 9(1), 37. https://doi.org/10.1186/s40068-020-00198-x
- WoldeYohannes, A., Cotter, M., Kelboro, G., & Dessalegn, W. (2018). Land use and land cover changes and their effects on the landscape of Abaya-Chamo basin, Southern Ethiopia. Land, 7(1), 2. https://doi.org/10.3390/land7010002
- Wolka, K., Tadesse, H., Garedew, E., & Yimer, F. (2015). Soil erosion risk assessment in the Chaleleka wetland watershed, Central Rift Valley of Ethiopia. Environmental Systems Research, 4(1), 1–12. https://doi.org/10.1186/s40068-015-0030-5
- Worku, G., Teferi, E., Bantider, A., Dile, Y. T., & Taye, M. T. (2018). Evaluation of regional climate models performance in simulating rainfall climatology of Jemma sub-basin, Upper Blue Nile Basin, Ethiopia. Dynamics of Atmospheres and Oceans, 83, 53–63. https://doi.org/10.1016/j.dynatmoce.2018.06.002
- Yesuph, A. Y., & Dagnew, A. B. (2019). Soil erosion mapping and severity analysis based on RUSLE model and local perception in the Beshillo catchment of the Blue Nile Basin, Ethiopia. Environmental Systems Research, 8(1), 1–22. https://doi.org/10.1186/s40068-019-0145-1