
 ?Mathematical formulae have been encoded as MathML and are displayed in this HTML version using MathJax in order to improve their display. Uncheck the box to turn MathJax off. This feature requires Javascript. Click on a formula to zoom.
Abstract
Fertigation by drip irrigation enhances the supply of water and nutrients directly to the root zone of plants. This results in maximal crop water and nutrient uptake and reduces leaching of nutrients and chemicals from the root zone. Two tomato varieties were cultivated in soilless medium in two greenhouse conditions to assess fertilizer rate, and irrigation regime on yield, water and nutrient utilization under a factorial experimental layout in a split-split plot design. The treatments were: three levels of fertilizer rate (F1: 100%, F2: 80%, F3: 60%) as recommended for soilless grown greenhouse tomato production, three levels of irrigation regime (I1: 100%, I2: 80%, I3: 60%) with respect to the crop water requirement and two tomato genotypes (V1: Jalila F1, V2: Yetty F1). A 20% to 40% decrease in fertilizer rate and irrigation regime decreased cluster (0.9–6.6%), flower (0.9–13.1%) and fruit (0.3–15%) formation under greenhouse condition. Marketable yield as affected by the combination of fertilizer rate by irrigation regime by genotype increased with increase in crop water productivity and nutrient use efficiency under greenhouse condition. Nutrient use efficiency increased with increase in crop water productivity. Evidently, marketable yield, crop water productivity and nutrient use efficiency vary significantly with plant nutrition, irrigation, genotype and its interactions. These are critical in curbing water scarcity, managing the economic crisis and to further the quest for zero hunger.
1. Introduction
Tomato (Lycopersicon esculentum L.) is an annual or a short-lived perennial which can be maintained for periods of a year or more under favorable environmental conditions (Peet & Welles, Citation2005). Tomato has high content of minerals, vitamins such as vitamin A and C, antioxidants such as lycopene, beta-carotene, flavonoid and phenolic acid, folate, potassium, oxalic acids such as ascorbic, citric, malic, niacin and fumeric are found in tomatoes which are vital to the health of humans (Borguini & Ferraz da Silva Torres, Citation2009). The choice of tomato genotype for specific production area is an essential factor for increasing productivity and quality. However, the indecision of farmers to adopt new and superior tomato varieties and their inability to meet the demand for tomato in Ghana, especially in the dry season, has resulted in the importation of tomato from other nearby countries especially Burkina Faso (Baba et al., Citation2013; Melomey et al., Citation2019).
The increase in air temperature and drought as influenced by climate change over the years, are central to the limiting factors of crop yield and quality (Fahad et al., Citation2017). Lack of pollination, flower abortion, reduced fruit set, weight of fruit (Harel et al., Citation2014; Xu et al., Citation2017), and nutritional quality (Agbemafle et al., Citation2015; Hernandez et al., Citation2015) of tomato are associated with high-temperature stress. In order to sustainably produce crops while reducing environmental impacts amidst the ever-increasing human population, it is important to promote technologies that enhance efficient use of water and nutrients in crops (Bwambale et al., Citation2023; Parada et al., Citation2021). According to Wang et al. (Citation2011) and Wankhede et al. (Citation2018), producing high-value crops by using less water and higher fertilizer efficiency is a great technique to address environmental and resource challenges. Fertigation by drip irrigation, unlike other irrigation and fertilization methods, enhances the efficient supply of water and nutrients at a precise rate, duration and frequency, directly to the root zone of plants. This maximizes crop water and nutrient uptake, reducing leaching of nutrients and chemicals from the root of agricultural field (Fanish et al., Citation2011). A report by Fanish et al. (Citation2011) indicated that the application of NPK liquid fertilizer significantly increased the concentration and total uptake of N, P and K in tomato crop over solid fertilizer. As revealed by Singandhupe et al. (Citation2003), the application of nitrogen through drip irrigation saved 20–40% nitrogen in tomato production compared to furrow irrigation. However, Sivakumar and Srividhya (Citation2016), Lovelli et al. (Citation2017) and Ganeva et al. (Citation2018) stated that a deficit irrigation of 50% significantly decreased fruit number, fruit diameter, fruit weight and tomato yield.
The greenhouse technology provides an optimum micro-environment for crop growth, maximizing yield and producing high-quality products. A relatively small area of land is used in all-year-round production of high-valued crops, resulting in increased land productivity. Nevertheless, greenhouse environments are susceptible to fluctuations in external weather conditions. Presently, greenhouse production employs the use of fertigation, where crop-specific fertigation programme is used (de Kreij et al., Citation2003). These are based on specific nutrient solution containing all crop essential elements and adjusted with respect to conditions such as crop stage, growing medium, electrical conductivity of the medium, pH and others. According to Viskelis et al. (Citation2008), yield and quality of fresh fruit are predisposed to many factors such as genetic factors and growing conditions. This study seeks to evaluate the intricate relationship between irrigation regime, fertilizer rate, tomato genotypes and cropping micro-climate, to advance good agricultural practices, enhance crop productivity, and support sustainability efforts.
2. Methodology
2.1. Study area, experimental design and treatments
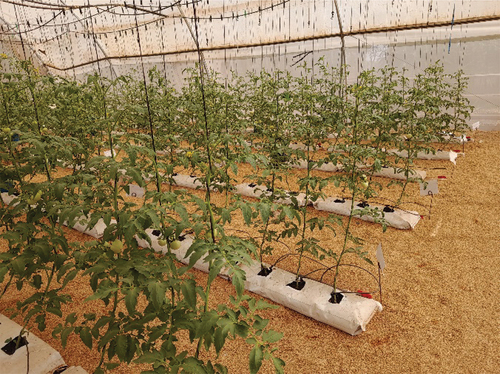
The experiment was carried out at the Skills Development Fund (SDF) greenhouse facility, located in the Council for Scientific and Industrial Research, Savanna Agricultural Research Institute (CSIR-SARI). This is located 16 km west of Tamale in the Tolon/Kumbungu District of the Northern Region of Ghana. A factorial experiment was conducted in split-split plot design, consisting of four replications. The trial consisted of three levels of fertilizer rates for major nutrients (F1: 100%, F2: 80% & F3: 60%) being the main-plot, combined with three irrigation regimes (I1: 100%, I2: 80% & I3:60%) being the sub-main plot and two genotypes (V1: Jalila F1 & V2: Yetty F1) as the sub-sub-main plot. The experiment lasted for a duration of 6 months, thus from 26 April 2021 to 22 October 2021 (Greenhouse Environment 1) and was repeated for another 6 months, from 9 October 2021 to 8 April 2022 (Greenhouse Environment 2). Figure shows the experimental set up in the greenhouse.
Figure 1. Photographic view of experimental set up in the greenhouse.
2.2. Cultural practices
The research was carried out in a Gothic arch greenhouse of a north–south orientation. The greenhouse is made of galvanized poles covered with a 50-mesh net on the sides and has a Solarig roof covering a UV blocking property, 60% diffused light and an anti-drip effect on the interior to prevent dripping on the plants. Indeterminate tomato varieties, thus Jalila F1 and Yetty F1, were nursed and transplanted after 21 days (thus, 17 May 2021 for greenhouse environment 1 and 1 November 2021 for greenhouse environment 2). A coco coir medium in a polyethylene container was the soilless culture used. A cropping density of three plants m−2 under surface drip irrigation system was used. Trellising, pruning and layering were carried out throughout the course of production. A growth hormone (Beta-naphthoxyacetic acid) was used to induce fruiting in tomato plants. First harvest was done in week 8 after transplanting and ended in week 20 after transplanting.
2.3. Climatic and fertigation data
Climatic records specific to the Savanna Agricultural Research Institute (SARI), consisting of monthly averages of minimum and maximum temperature, relative humidity, sunshine, wind speed, and geographic coordinates (altitude, latitude, longitude) for the period of about 30 years was obtained from the Ghana Meteorological Services. This was pre-run with CROPWAT 8.0 software to calculate the reference evapotranspiration (Eto) (Allen et al., Citation1998).
Figure 2. CROPWAT simulated reference evapotranspiration for greenhouse environments 1 and 2.
With the help of the media (coco coir) characteristics such as field capacity (33.5%), permanent wilting point (10.7%), available water content (22.7%) and bulk density (1.5 g cm-3) as determined by the method described by Sujitha and Shanmugasundaram (Citation2017a), irrigation Scheduling was done using the CROPWAT 8.0. A Venturi injector system of injection rate of 100 ml m−3, was used to administer fertilizer using a proportional fertigation recommendation by Peet and Welles (Citation2005) for tomato with reference to the crop water requirement and irrigation schedule as estimated from CROPWAT 8.0 (Tables ). Soluble fertilizers were used in the preparation of fertilizer stock solution in two different tanks. Calcium nitrate (CaNO3) [15.5-0-0 + 26.3] and Mono ammonium phosphate (MAP) [12-61-0] were mixed together in one tank and Potassium nitrate (KNO3) [13-0-46], and Magnesium sulphate (MgSO4) [0-0-0-16-32.5] were mixed in a second tank based on the recommendations in Table . This was done to prevent antagonism in some fertilizers when mixed together. Fertilizer stock solution was done for the three fertilizer rates (100%, 80% and 60%), making a total of six tanks, with each pair of tanks representing a respective rate. During fertigation, the electrical conductivity (EC) was kept at ≤2.5 dS m-1 and pH within a range of 5.5–6.5.
Table 1. Nutrient recommendations for hydroponic (perlite, rockwool, and NFT) tomatoes in Florida (Peet & Welles, Citation2005) according to cluster formation intervals
Table 2. Estimated crop water requirement and irrigation Interval for soilless cultivated greenhouse tomato at CSIR-SARI, Nyankpala, Ghana, for greenhouse environments 1 and 2
The Decagon moisture sensor was used to monitor the moisture content of the media before and after every fertigation throughout the growth period, and EquationEquation (1)1
1 (Franco et al., Citation2022) is used to estimate the consumptive use and irrigation quantity.
where I is the irrigation quantity (mm); A is the surface area (m2) of each plot; FC is the field capacity (m3 m−3); is the volumetric water content before irrigation; and Z is the effective root zone depth (mm).
Real time relative humidity and temperature readings were taken at every 30 minutes with the help of a data logger (a hygrometer and a thermometer respectively) in the greenhouse environment during the experiment. The temperature and relative humidity reading during the time of experiment in the greenhouse are as indicated in . The maximum day-time temperature in greenhouse environment 1 ranged from 23.5°C to 52.3°C and in greenhouse environment 2 ranged from 34°C to 51.9°C. The minimum day-time temperatures ranged from 21.2°C to 36.3°C in greenhouse environment 1 and 18.7°C to 33.5°C in greenhouse environment 2. Averagely, greenhouse environments 1 and 2 recorded 32.8°C and 37.4°C, respectively, as day-time temperature (). The mean night-time temperature was 26°C in greenhouse environment 1 but 23.8°C in greenhouse environment 2. The maximum and minimum night-time temperature recorded under greenhouse environments 1 and 2 were 39.9°C and 20.6°C () as well as 36.1°C and 15.2°C (), respectively.
Figure 3a. Day-time temperature under greenhouse environment 1.
Figure 3b. Night-time temperature under greenhouse environment 1.
Figure 4a. Day-time relative humidity under greenhouse environment 1.
Figure 4b. Night-time relative humidity under greenhouse environment 1.
Figure 5a. Day-time temperature under greenhouse environment 2.
Figure 5b. Night-time temperature under greenhouse environment 2.
Figure 6a. Day-time relative humidity under greenhouse environment 2.
Figure 6b. Night-time relative humidity under greenhouse environment 2.
The maximum day-time relative humidity in greenhouse environment 1 ranged from 46.2% to 99.4% and 23.3% to 84.9% in greenhouse environment 2. The minimum day-time relative humidity recorded under greenhouse environment 1 was 28.9% to 94% and 15.6% to 57.4% was recorded under greenhouse environment 2 (). The mean day-time relative humidity recorded under greenhouse environments 1 and 2 were 66.5% and 34.5%, respectively (). The mean night-time relative humidity for greenhouse environments 1 and 2, as shown in , respectively, were 81.1% and 51.2%.
2.4. Yield and yield contributing characters
Data on yield and its contributing characters were recorded for three sampled plants within each treatment plot at 4 weeks after transplanting (WATp) and repeated at a 4-week interval till 20 weeks after transplanting. The number of clusters and flowers per plant were estimated by taking the average number of clusters and flowers on sampled plants. The number of fruits per plant was estimated by taking the average number of fruits with respect to the total number of flowers on the three sampled plants within each treatment plot. The percentage fruit set per plant was then estimated with EquationEquation (2)2
2 .
The average weight per fruit was estimated by dividing the total weight of fruits harvested per treatment by the total number of fruits harvested per treatment. Harvest index (HI) was calculated by dividing the oven dried biomass of mature fruit by aboveground dry biomass expressed as a percentage (Hay, Citation1995). Harvested tomato from three sampled plants within and across replicate were counted and weighed with an electronic weighing scale to record the fresh weight throughout the production season. These were further categorized into marketable and unmarketable yield by sorting and weighing. Unmarketable yield was mainly based on distorted fruits; thus, fruits with cracks or blossom end rot.
Crop Water Productivity and Nutrient Use Efficiency are then calculated with EquationEquation (3)3
3 (Howell, Citation2006) and EquationEquation (4)
4
4 (Singh et al., Citation2019), respectively.
where CWP is Crop Water Productivity (kg m−3), is the yield (kg ha−1) and TWU is the Total Water Use (m3 ha−1). NUE is Nutrient Use Efficiency (kg of yield kg−1) and TWN is Total Weight of Nitrogen. The cumulative estimated amount of nitrogen nutrient and water applied over the period of the experiment was estimated as total nutrient used and total water used under greenhouse environments 1 and 2.
2.5. Data analysis
Fertigation, greenhouse environment and yield data were entered in the Microsoft Excel spreadsheet and statistically analysed. Count data were square root transformed before analysis. Data were subjected to Analysis of Variance (ANOVA) using Split-Split Plot Design model in GenStat Version 12.1. Data from greenhouse environment 1 was first analysed, after which data from greenhouse environment 2 was analysed. Data were further subjected to correlation matrix and regression (R2) model to better understand the causal relationship between the greenhouse environmental parameters and agronomic variables.
3. Results
3.1. The influence of fertilizer rate, irrigation regime, genotype and greenhouse environment on the fruit yield and yield contributing parameters
3.1.1. Cluster per plant
There was an increase in the number of clusters per plant with increase in fertilizer and irrigation regime under greenhouse environments 1 and 2 (Figures ). The number of clusters per plant as treated with 80% fertilizer rate was not significantly different from 100% fertilizer and 60% fertilizer rate. One hundred percent fertilizer rate, however, showed significant variation (p < 0.05) in the number of clusters per plant from 60% fertilizer rate at 12 and 16 weeks after transplanting, under greenhouse environment 1. Greenhouse environment 2 showed no significant variation in number of clusters per plant as affected by fertilizer rate. There was a significant variation (p < 0.005) in the number of clusters per plant as affected by irrigation regime under greenhouse environments 1 and 2. The number of clusters per plant treated with 80% irrigation regime was statistically similar to 100% irrigation regime. Yetty F1 recorded the highest number of clusters per plant under greenhouse environments 1 and 2. Number of clusters per plant showed no significant variation as affected by genotype under greenhouse environment 1 (Figure ). Under greenhouse environment 2, there was a significant variation (p < 0.005) in the number of clusters per plant, as affected by genotype at 12 weeks after transplanting (Figure ). There was no significant variation in the number of clusters per plant as affected by the interactions between fertilizer rate, irrigation regime and genotype.
Figure 7. Effects of fertilizer rate on the number of clusters per plant in greenhouse environment 1 (GE 1) and greenhouse environment 2 (GE 2) (error bars = least significant difference (5%).
Figure 8. Effects of irrigation regime on number of clusters per plant in greenhouse environment 1(GE 1) and greenhouse environment 2(GE 2) (error bars = least significant difference (5%).
Figure 9. Effects of genotype on the number of clusters per plant in greenhouse environment (GE 1) and greenhouse environment 2 (GE 2) (error bars = least significant difference (5%).
3.1.2. Flowers per plant
The experiment under greenhouse environments 1 and 2 showed that the number of flowers per plant increased with an increase in fertilizer rate and irrigation regime. At week 16 after transplanting, the number of flowers per plant as affected by 100% fertilizer rate varied significantly (p < 0.05) with 60% fertilizer rate but not with 80% fertilizer rate under greenhouse environments 1 and 2 (). There was a significant variation in the number of flowers per plant at 8 and 12 after transplanting (p < 0.05) as affected by 100% and 80% irrigation regime, on one hand, and 60% irrigation regime, on the other, under greenhouse environment 1 (). Under greenhouse environment 2, there was a significant variation (p < 0.001 and p < 0.05) at 4 and 8 weeks after transplanting as affected by 100% and 80% irrigation regime, on one hand, and the 60% irrigation regime, on the other (). As shown in Figure , Yetty F1 significantly varied (P < 0.05) from Jalila F1 under greenhouse environments 1 and 2. There was no significant variation in the number of flowers per plant as affected by the interactions between fertilizer rate, irrigation regime and genotype.
Figure 10. Effects of fertilizer rate on the number of flowers per plant in greenhouse environment 1 (GE 1) and greenhouse environment 2 (GE 2) (error bars = least significant difference (5%).

Figure 11. Effects of irrigation regime on the number of flowers per plant in greenhouse environment 1 (GE 1) and greenhouse environment 2 (GE 2) (error bars = least significant difference (5%).
Figure 12. Effects of genotype on the number of flowers per plant in greenhouse environment 1 (GE 1) in greenhouse environment 2 (GE 2) (error bars = least significant difference (5%).
3.1.3. Percentage fruit set per plant
There was no significant variation in the percentage fruit set per plant as affected by fertilizer rate () and genotype () under greenhouse environments 1 and 2. Percentage fruit set per plant varied significantly (p < 0.005) at 8 weeks after transplanting among 80% and 60% irrigation regime under greenhouse environment 1. At 12 weeks after transplanting under greenhouse environment 2 (), 80% irrigation regime varied significantly (p < 0.005) with percentage fruit set per plant from 100% and 60% irrigation regime. Jalila F1 recorded the highest percentage fruit set per plant under greenhouse environment 1, and Yetty F1 recorded the highest percentage fruit set per plant under greenhouse environment 2. There was no significant variation in the percentage fruit set per plant as affected by the interactions between fertilizer rate, irrigation regime and genotype.
Figure 13. Effects of fertilizer rate on the percentage fruit set per plant in greenhouse environment 1 (GE 1) and greenhouse environment 2 (GE 2) (error bars = least significant difference (5%).
Figure 14. Effects of irrigation regime on the percentage fruit set per plant in greenhouse environment 1 (GE 1) and greenhouse environment 2 (GE 2) (error bars = least significant difference (5%).
Figure 15. Effects of genotype on percentage fruit set per plant in greenhouse environment 1 (GE 1) and greenhouse environment 2 (GE 2) (error bars = least significant difference (5%).
3.1.4. The relationship between the greenhouse environment parameters and the flower set of greenhouse tomato
Tables show the relationship between the greenhouse environment parameters and the reproductive parts of greenhouse tomato as influenced by fertilizer rate, irrigation regime and genotype. Temperature strongly correlated negatively with the number of clusters per plant (R2 = 0.86), number of flowers per plant (R2 = 0.51), and percentage fruit set per plant under greenhouse environment 1, but under greenhouse environment 2, there was a strong positive correlation between temperature and number of clusters per plant (R2 = 0.67), number of flowers per plant (R2 = 0.61), and percentage fruit set per plant (R2 = 0.76). Relative humidity strongly correlated positively with the number of clusters per plant (R2 = 0.99, p < 0.006), number of flowers per plant, and percentage fruit set per plant (R2 = 0.62) under greenhouse environment 1, but under greenhouse environment 2, there was a strong negative correlation between relative humidity and number of clusters per plant (R2 = 0.94, p < 0.03), number of flowers per plant (R2 = 0.96, p < 0.019), and percentage fruit set per plant (R2 = 0.95, p < 0.025).
Table 3. Correlation between the greenhouse environment parameters and the flower set of greenhouse tomato under greenhouse environment 1
Table 4. Correlation between the greenhouse environment parameters and flower set and fruiting of greenhouse tomato under greenhouse environment 2
3.1.5. Average weight per fruit
The three-way interaction of fertilizer rate, irrigation regime and genotype did not significantly affect the average weight of fruit in greenhouse environment 1. The combinations of fertilizer rate and irrigation regime (Table ), also irrigation regime and genotype (Table ), showed significant variation (p < 0.001 and p < 0.008, respectively) in average weight of fruit in greenhouse environment 1. The effect of the interaction of Fertilizer rate 80% and irrigation regime 80% on average fruit weight was statistically similar to the average fruit weight resulting from the combination of 100% fertilizer rate and 100% irrigation regime. The combination of 100% fertilizer rate and Yetty F1 recorded the highest average fruit weight of 152.1 g, varying significantly from other treatments. In greenhouse environment 2, there was a significant variation (p < 0.001) in the average fruit weight as affected by the interaction of fertilizer rate, irrigation regime and genotype (Table ). The three-way combination of 100% fertilizer rate, 100% irrigation regime and Yetty F1 (138.6 g) recorded the highest average fruit weight, whereas the combination of 100% fertilizer rate, 60% irrigation regime and Yetty F1 (55.5 g) recorded the least average fruit weight. The average weight per fruit decreased with decrease in fertilizer rate and irrigation regime in greenhouse environments 1 and 2.
Table 5. Average weight per fruit, total aboveground biomass, harvest index and marketable yield of greenhouse tomato as affected by the combination of fertilizer rate, irrigation regime and genotype
3.1.6. Harvest index
The three-way interaction of fertilizer rate, irrigation regime and genotype did not significantly affect the harvest index in greenhouse environment 1, neither did the combination of fertilizer rate and irrigation regime, also fertilizer rate and genotype show significant variation in harvest index. The two-way interaction of 100% irrigation regime and Yetty F1 (0.6295) recorded the highest harvest index, which was statistically similar to the harvest index recorded by the interaction of 60% irrigation regime and Jalila F1 (0.5613). There was a significant difference (p < 0.001) in harvest index as affected by irrigation regime and genotype in greenhouse environment 1 (Table ). Table shows a significant variation (p < 0.005) in the harvest index as affected by the three-way interaction of fertilizer rate, irrigation regime and genotype in greenhouse environment 2. The combination of 60% fertilizer rate, 80% irrigation regime and Yetty F1 (0.5997) recorded the highest harvest index and was statistically similar to the combination of 80% fertilizer rate, 60 & irrigation regime and Yetty F1 (0.5589). The least harvest index was recorded from the combination of 80% fertilizer rate, 60% irrigation regime and Jalila F1 (0.4216).
3.1.7. Total dry aboveground biomass
The three-way interaction of fertilizer rate, irrigation regime and genotype did not significantly affect the total aboveground biomass in greenhouse environment 1, neither did the combination of fertilizer rate and irrigation regime, also fertilizer rate and genotype show significant variation in harvest index. The two-way interaction of irrigation regime and genotype varied significantly (p < 0.01) with the total aboveground biomass. One hundred percent irrigation regime combined with Jalila F1 (7263 kg ha−1) recorded the highest total aboveground biomass, whereas the combination of 60% irrigation regime and Jalila F1 (4792 kg ha−1) recorded the least total aboveground biomass in greenhouse environment 1 (Table ). In greenhouse environment 2, the three-way combination of fertilizer rate, irrigation regime and genotype significantly (p < 0.001) affected the total aboveground biomass (Table ). One hundred percent fertilizer rate combined with 100% irrigation regime and Yetty F1 recorded 11,734 kg ha−1 as the highest total aboveground biomass in greenhouse environment 2. The combination of 60% fertilizer rate, 60% irrigation regime and Yetty F1 (3059 kg ha−1) had the least total aboveground biomass.
3.1.8. Marketable yield
Marketable yield as affected by the three-way interaction of fertilizer rate, irrigation regime and genotype was statistically similar and so, were the two-way combination of irrigation regime and genotype, as well as the combination of fertilizer rate and genotype. The marketable yield as affected by the interaction of 100% fertilizer rate and 100% irrigation regime (94.8 t ha−1) was significantly higher (p = 0.001) than all the treatments (Greenhouse environment 1) (Table ). The three-way interaction of fertilizer rate, irrigation regime and genotype varied significantly (p < 0.05) with marketable yield under greenhouse environment 2 (Table ). The interaction of 100% fertilizer rate, 100% irrigation regime and Yetty F1 (91.48 kg ha−1) had the highest marketable yield and was not significantly different from the interaction of 100% fertilizer rate, 100% irrigation regime and Jalila F1 (83.84 kg ha−1). The interaction of 60% fertilizer rate, 60% irrigation regime and Yetty F1 (24.69 kg ha−1) had the least marketable yield in greenhouse environment 2. There was a strong positive correlation between the total dry aboveground biomass and marketable yield of greenhouse tomato as affected by fertilizer rate, irrigation regime and genotype, under greenhouse environment 1 (p < 0.001) and 2 (p < 0.001) as indicated in Equationequation (5)5
5 and (Equation6
6
6 ) respectively.
3.2. Crop water productivity
The highest and least total water use were 1,146.58 m3 ha−1 given by 100% irrigation regime and 905.97 m3 ha−1 given by 60% irrigation regime in greenhouse environment 1 correspondingly. In greenhouse environment 2, 2,366.86 m3 ha−1 (100% irrigation regime) and 1,683.69 m3 ha−1 (60% irrigation regime) were the highest and least water use recorded, respectively. Statistically, crop water productivity was similar among treatments as affected by the combination of fertilizer rate, irrigation regime and genotype in greenhouse environment 1. There was a significant variation of p < 0.01 in the crop water productivity of greenhouse tomato as affected by the interaction of fertilizer rate and irrigation regime (Table ). The crop water productivity gotten from the treatment, 80% fertilizer rate interacting with 80% irrigation regime, showed no significant variation from 100% fertilizer rate interacting with 100% irrigation regime, as well as the combination of 100% fertilizer rate and 60% irrigation regime in greenhouse environment 1. The crop water productivity resulting from the interaction of fertilizer rate and genotype, as well as the interaction of irrigation regime and genotype were not significantly different in greenhouse environment 1. In greenhouse environment 2, there was a significant variation (p = 0.001) in the crop water productivity as affected by the interaction of fertilizer rate, irrigation regime and genotype. Crop water productivity recorded by the interaction of 80% fertilizer rate, 80% irrigation regime and Jalila F1 (42.67 kg m−3) was the highest and was statistically similar to the crop water productivity recorded by the interactive effect of 60% fertilizer rate, 80% irrigation regime and Yetty F1 (35.43 kg m−3) (Table ). However, the three-way interaction of 60% fertilizer rate, 60% irrigation regime and Yetty F1 (14.34 kg m−3) recorded the least crop water productivity in greenhouse environment 2.
Table 6. Crop water productivity and nutrient use efficiency of greenhouse tomato as affected by the combination of fertilizer rate, irrigation regime and genotype
3.3. Nutrient use efficiency
There was no significant difference in nutrient use efficiency as affected by the three-way combination of fertilizer rate, irrigation regime and genotype in greenhouse environment 1 (Table ). The two-way interaction of fertilizer rate 60% and irrigation regime 100% (655 kg kg−1) was significantly higher (p < 0.01) among treatments in greenhouse environment 1. There was no significant difference in the combination of fertilizer rate and genotype nor the combination of irrigation regime and genotype in greenhouse environment 1. The nutrient use efficiency of greenhouse tomato as influenced by the three-way interaction of fertilizer rate, irrigation regime and genotype were highly significant (p < 0.001) in greenhouse environment 2 (Table ). The combination of 60% fertilizer rate, 80% irrigation regime and Yetty F1 (373.3 kg kg−1) had the highest nutrient use efficiency and was statistically similar to the interaction of 80% fertilizer rate, 80% irrigation regime and Yetty F1 (349.5 kg kg−1) as well as the interaction of 80% fertilizer rate, 80% irrigation regime and Jalila F1 (350.5 kg kg−1) in greenhouse environment 2. The combination of 60% fertilizer rate, 60% irrigation regime and Yetty F1 (156.8 kg kg−1) had the least nutrient use efficiency in greenhouse environment 2.
The relationship between crop water productivity, nutrient use efficiency and marketable yield is as presented in Equationequation (7)7
7 and (Equation8
8
8 ) under greenhouse environments 1 and 2.
EquationEquation (9)9
9 and (Equation10
10
10 ) shows the relationship between crop water productivity, nutrient use efficiency and total aboveground biomass.
4. Discussions
In the realm of tomato cultivation, the influence of environmental factors on growth and yield is a well-explored area. As per Shamshiri et al. (Citation2018), an optimal temperature range of 18.3°C to 32.2°C and relative humidity between 50% and 70% favours robust tomato growth. Deviations from this range, such as temperatures exceeding 35°C and relative humidity outside the optimum zone, can hamper growth and even slow down development (Yang et al., Citation2018). In our study, greenhouse environments 1 and 2 intermittently experienced conditions that exceeded the optimal parameters, potentially impacting tomato production. This observation aligns with Li’s (Citation2014) findings and Zheng et al. (Citation2020), study, which suggest that elevated temperatures and humidity levels can expedite plant senescence, curtail growth phases, heighten vulnerability to pests and diseases and influence the quality and yield of fruits.
Notably, the performance of indeterminate greenhouse tomatoes in terms of cluster formation, flowering, and fruit set serves as a reliable gauge of yield potential in both greenhouse environments. The intricate correlation between plant water uptake and nutrient absorption is pivotal. Restricting water uptake consequently limits nutrient absorption, as both processes primarily occur through the roots. Instances where soil or media particles dry out, interrupt mass flow and nutrient diffusion around the roots. Given the tomato’s heavy requirement for nutrients like nitrogen, potassium, and phosphorus (Hebbar et al., Citation2004), efficient water and nutrient absorption, coupled with photosynthesis, holds the key to achieving higher yields with superior quality (Abdelhady et al., Citation2017). Corroborated by Djidonou et al. (Citation2013) and Gebremariam and Tesfay (Citation2019), our findings further underscore that irrigation and NPK fertilizer rates significantly influence essential parameters like average fruit weight, yield per plant, estimated yield, and marketable yield. This correlation resonates with Srivastava et al. (Citation2012), Zakari et al. (Citation2017), and Ganeva et al. (Citation2018) observations on the impact of deficit irrigation regimes on flowering and fruit set in indeterminate tomato plants. The intrinsic connection between water and nutrient scarcity and reduced fruit yield becomes more evident in these scenarios.
The variance in greenhouse environments is attributed to about 18%, 44.4%, and 46.18% variations in mean fruit weight, mean crop water productivity, and mean nutrient use efficiency, respectively. This variability echoes similar studies by Ganeva et al. (Citation2018), Sivakumar and Srividhya (Citation2016), and Nuruddin et al. (Citation2003) that reported the significant influence of deficit irrigation regimes on indeterminate tomato plant fruit weight, regardless of the genotype. Although planting time by fertilizer doses exhibited a significant interaction effect on fruit weight (Md et al., Citation2020), our study supports Xiukang and Yingying’s (Citation2016) findings that irrigation regime and fertilizer rates independently exert a profound effect on yield, with a high level of significance.
While comparable studies by Xiukang and Yingying (Citation2016) emphasized the notable influence of irrigation regime and fertilizer rates on aboveground biomass, our study found no significant interaction between the two factors. Contrasting results from Wankhede et al. (Citation2018) indicate that greenhouse tomato yield remains unaffected by irrigation levels, fertilizer rates, and their interactions.
Analysing crop water productivity reveals that a balanced interaction of 100% fertilizer rate with 60% irrigation regime could save 40% water while achieving optimal productivity in greenhouse environment 1. Similarly, in greenhouse environment 2, adopting a three-way interaction of 80% fertilizer rate, 80% irrigation regime, and specific tomato varieties led to a 20% reduction in water and fertilizer usage while maintaining optimal productivity. Corresponding results from Wankhede et al. (Citation2018) indicate varying water productivity levels under different fertigation scenarios, while Xiukang and Yingying (Citation2016) demonstrated that WUE improved proportionally with higher fertilizer rates. Our findings reflect the alignment of Gumlendam et al. (Citation2010) and Xiukang and Yingying (Citation2016), with irrigation significantly affecting WUE, showing reduced efficiency with increased irrigation.
It is pertinent to acknowledge that excessive nitrogen fertilizer applications might result in non-linear yield responses and low nitrogen use efficiency (Cossey et al., Citation2002). Our findings further substantiate this, emphasizing the importance of careful nutrient management under water deficit conditions, to avoid compromising both yield and nutrient use efficiency. Heat stress, as reported by Klimenko et al. (Citation2006) and Hungria and Kaschuk (Citation2014), can interfere with nutrient metabolism, particularly nitrogen, potentially contributing to the reduction in nutrient concentration within plant tissues. This aligns with the drop in nutrient use efficiency observed in our study under different greenhouse environments.
Our study underscores the interplay of various factors affecting tomato yield and in greenhouse environments. The intricate relationship between temperature, humidity, water uptake, and nutrient absorption is crucial in ensuring optimal growth and productivity. Furthermore, effective water and nutrient management are vital for sustainable agriculture, as imbalances can lead to reduced yield and inefficient resource utilization. This research contributes to our understanding of how different factors interact in greenhouse tomato cultivation, and these insights can guide future strategies for improving yield and resource efficiency.
5. Conclusions
In conclusion, the experiment aimed to evaluate the dynamic interplay between fertilizer rate, irrigation regime, and tomato genotype on various parameters of greenhouse tomato cultivation in soilless media under different greenhouse environments. The study found that increasing fertilizer rates and irrigation regimes led to notable enhancements in cluster, flower, and fruit formation within greenhouse environments 1 and 2. Notably, total marketable yield and crop water productivity exhibited a positive correlation with higher fertilizer rates and irrigation regimes. The variety Yetty F1 displayed superior crop water productivity and nutrient use efficiency across both greenhouse environments. Moreover, the interaction of fertilizer rate, irrigation regime, and genotype substantially influenced marketable yield, crop water productivity, and nutrient use efficiency. The combination of 100% fertilizer rate with 100% irrigation regime for Jalila F1 and Yetty F1 emerged as optimal choices for total marketable yield. To optimize water use for greenhouse tomato cultivation, the recommended interactions included 100% fertilizer rate with 60% irrigation regime for Jalila F1 and 80% fertilizer rate with 80% irrigation regime for Yetty F1. Additionally, achieving efficient nutrient use efficiency was linked to interactions such as 60% fertilizer rate with 100% irrigation regime for Jalila F1. These findings provide valuable insights for curbing food insecurity, water scarcity, and advancing the pursuit of global food security and sustainability goals. Further studies under similar greenhouse environments should measure the effect of the treatments on the biochemical stress indicators such as antioxidants, hydrogen peroxide and MDA, as well as protein, to better understand the interrelation between fertilizer rate, irrigation regime and genotype.
Acknowledgement
This research was made possible through support provided by the West African Centre for Water, Irrigation and Sustainable Agriculture (WACWISA), University for Development Studies, Ghana, with funding support from the Government of Ghana and World Bank through the African Centres of Excellence for Development Impact (ACE Impact) initiative.
Disclosure statement
No potential conflict of interest was reported by the author(s).
Data availability statement
Data will be available on request through the corresponding author.
Additional information
Funding
References
- Abdelhady, S. A., El-Azm, N. A., & El-Kafafi, E. S. H. (2017). Effect of deficit irrigation levels and NPK fertilization rates on tomato growth, yield and fruits quality. Middle East Journal of Agriculture Research, 6(3), 587–21.
- Agbemafle, R., Owusu-Sekyere, J. D., & Bart-Plange, A. (2015). ‘Effect of deficit irrigation and storage on the nutritional composition of tomato (Lycopersicon esculentum Mill. cv. Pectomech) Croatian Journal of Food Technology, Biotechnology and Nutrition, 10(1–2), 59–65.
- Allen, R. G., Pereira, L. S., Raes, D., & Smith, M. (1998). Crop evapotranspiration-guidelines for computing crop water requirements-FAO irrigation and drainage paper 56. Fao Rome, 300(9), D05109.
- Baba, I. I. Y., Yirzagla, J., & Mawunya, M. (2013). The tomato industry in Ghana fundamental challenges, surmounting strategies, and perspectives: A review. International Journal of Current Research, 5(12), 4104–4107. .
- Borguini, R. G., & Ferraz da Silva Torres, E. A. (2009). Tomatoes and tomato products as dietary sources of antioxidants. Food Reviews International, 25(4), 313–325. https://doi.org/10.1080/87559120903155859
- Bwambale, E., Abagale, F. K., & Anornu, G. K. (2023). Model-based smart irrigation control strategy and its effect on water use efficiency in tomato production. Cogent Engineering, 10(2), 2259217. https://doi.org/10.1080/23311916.2023.2259217
- Cossey, D. A., Thomason, W. E., Mullen, R. W., Wynn, K. J., Woolfolk, C. W., Johnson, G. V., & Raun, W. R. (2002). Relationship between ammonium and nitrate in wheat plant tissue and estimated nitrogen loss. Journal of Plant Nutrition, 25(7), 1429‒1442. https://doi.org/10.1081/PLN-120005400
- de KreijC., VoogtW.BaasR.2003Nutrient solutions and water quality for soilless cultures.Applied Plant Research, Naaldwijk ISSN191
- Djidonou, D., Zhao, X., Simonne, E. H., Koch, K. E., & Erickson, J. E. (2013). Yield, water-, and nitrogen-use efficiency in field-grown, grafted tomatoes. HortScience, 48(4), 485–492. https://doi.org/10.21273/HORTSCI.48.4.485
- Fahad, S., Bajwa, A. A., Nazir, U., Anjum, S. A., Farooq, A., Zohaib, A., Sadia, S., Nasim, W., Adkins, S., Saud, S., Ihsan, M. Z., Alharby, H., Wu, C., Wang, D., & Huang, J. (2017).viewed 29 June 2017 Crop production under drought and heat temperature stress: Plant responses and management options. Frontiers in Plant Science, 8, 1147. https://doi.org/10.3389/fpls.2017.01147
- Fanish, S. A., Muthukrishnan, P., & Santhi, P. (2011). Effect of drip fertigation on field crops-a review. Agricultural Reviews, 32(1).
- Franco, D., Prajapati, V. K., & Maruthi Sankar, G. R. (2022). Real time soil moisture (RTSM) based irrigation scheduling to improve yield and water-use efficiency of green pea (Pisum sativum L.) grown in North India. Agronomy, 12(2), 278. https://doi.org/10.3390/agronomy12020278
- Ganeva, D., Grozeva, S., & Pevicharova, G. (2018). Evaluation of productivity and productivity compounds in tomato accessions grown under elevated temperature and reduced irrigation. Agriculture & Food, 6, 99–110. .
- Gebremariam, M., & Tesfay, T. (2019). Optimizing irrigation water and N levels for higher yield and reduced blossom end rot incidence on tomato. International Journal of Agronomy, 2019, 1–10. https://doi.org/10.1155/2019/8125063
- Gumlendam, C., Attila, Y., Servet, T., & Burcak, K. (2010). Effect of irrigation management on yield and quality of tomatoes grown in different soilless media in a glasshouse. Scientific Research and Essays, 5(1), 041–048.
- Harel, D., Fadida, H., Slepoy, A., Gantz, S., & Shilo, K. (2014). The effect of mean daily temperature and relative humidity on pollen, fruit set and yield of tomato grown in commercial protected cultivation. Agronomy, 4(1), 167–177. https://doi.org/10.3390/agronomy4010167
- Hay, R. K. M. (1995). Harvest index: A review of its use in plant breeding and crop physiology. The Annals of Applied Biology, 126(1), 197–216. https://doi.org/10.1111/j.1744-7348.1995.tb05015.x
- Hebbar, S. S., Ramachandrappa, B. K., Nanjappa, H. V., & Prabhakar, M. J. E. J. O. A. (2004). Studies on NPK drip fertigation in field grown tomato (Lycopersicon esculentum Mill.). The European Journal of Agronomy, 21(1), 117–127. https://doi.org/10.1016/S1161-0301(03)00091-1
- Hernandez, V., Hellin, P., Fenoll, J., Garrido, I., Cava, L., & Flores, P. (2015). Increasing yield and quality of tomato cultivated under high temperature conditions through the use of elicitors. Procedia Environmental Sciences, 29, 184. https://doi.org/10.1016/j.proenv.2015.07.251
- Howell, T. A. (2006). Challenges in increasing water use efficiency in irrigated agriculture. In ‘The Proceedings of International Symposium on Water and Land Management for Sustainable Irrigated Agriculture’. April 4–8, 2006, Adana, Turkey.
- Hungria, M., & Kaschuk, G. (2014). Regulation of N2 fixation and NO3/NH4 + assimilation in nodulated and N-fertilized Phaseolus vulgaris L. exposed to high temperature stress. Environmental and Experimental Botany, 98, 32–39. https://doi.org/10.1016/j.envexpbot.2013.10.010
- Klimenko, S. B., Peshkova, A. A., & Dorofeev, N. V. (2006). Nitrate reductase activity during heat shock in winter wheat. Journal of Stress Physiology & Biochemistry, 2(1), 50–55.
- Li, J. (2014). Response of stomatal conductance and phytohormones of leaves to vapor pressure deficit in some species of plants. PhD Diss, Shan Dong University,
- Lovelli, S., Potenza, G., Castronuovo, D., Perniola, M., & Candido, V. (2017). Yield, quality and water use efficiency of processing tomatoes produced under different irrigation regimes in Mediterranean environment. Italian Journal of Agronomy, 12(1). https://doi.org/10.4081/ija.2016.795
- Md, E. A., Md, R. K., Talukder, F. U., & Md, S. R. (2020). Growth and yield responses of tomato (Lycopersicon esculentum Mill.) under different combinations of Planting Times and fertilizers. Reviews in Food and Agriculture, 1(2), 74–81. https://doi.org/10.26480/rfna.02.2020.74.81
- Melomey, L. D., Danquah, A., Offei, S. K., Ofori, K., Danquah, E., & Osei, M. (2019). Review on tomato (Solanum lycopersicum, L.) improvement programmes in Ghana. Recent Advances in Tomato Breeding and Production, 49. https://doi.org/10.5772/intechopen.75843
- Nuruddin, M. M., Madramootoo, C. A., & Dodds, G. T. (2003). Effects of water stress at different growth stages on greenhouse tomato yield and quality. HortScience, 38(7), 1389–1393. https://doi.org/10.21273/HORTSCI.38.7.1389
- Parada, F., Gabarrell, X., Rufí-Salís, M., Arcas-Pilz, V., Muñoz, P., & Villalba, G. (2021). Optimizing irrigation in urban agriculture for tomato crops in rooftop greenhouses. Science of the Total Environment, 794, 148689. https://doi.org/10.1016/j.scitotenv.2021.148689
- Peet, M. M., & Welles, G. W. H. (2005). Greenhouse tomato production. Crop Production Science in Horticulture, 13, 257.
- Shamshiri, R. R., Kalantari, F., Ting, K. C., Thorp, K. R., Hameed, I. A., Weltzien, C., Shad, Z. M. (2018). Advances in greenhouse automation and controlled environment agriculture: A transition to plant factories and urban agriculture. https://doi.org/10.25165/j.ijabe.20181101.32
- Singandhupe, R. B., Rao, G. G. S. N., Patil, N. G., & Brahmanand, P. S. (2003). Fertigation studies and irrigation scheduling in drip irrigation system in tomato crop (Lycopersicon esculentum L.). The European Journal of Agronomy, 19(2), 327–340. https://doi.org/10.1016/S1161-0301(02)00077-1
- Singh, M. C., Singh, K. G., Singh, J. P., & Mahal, A. K. (2019). Performance of soilless cucumbers in relation to differential fertigation under naturally ventilated greenhouse conditions. Journal of Plant Nutrition, 42(11–12), 1316–1332. https://doi.org/10.1080/01904167.2019.1609507
- Sivakumar, R., & Srividhya, S. (2016). Impact of drought on flowering, yield and quality parameters in diverse genotypes of tomato (Solanum lycopersicum L.). Advances in Horticultural Science, 30(1), 3–11. https://doi.org/10.13128/ahs-18696
- Srivastava, K., Sunil, K., Surender, K., Pravin, P., & Vaishampayan, A. (2012). Screening of tomato genotypes for reproductive characters under high temperature stress conditions. SABRAO Journal of Breeding and Genetics, 44(2), 263–276. URL. http://www.sabrao.org/tmp_journals/sa…
- Sujitha, E., & Shanmugasundaram, K. (2017a). Assessment of Soil moisture characteristics curve for greenhouse growing media. International Journal of Current Microbiology and Applied Sciences, 6(8), 3515–3520. https://doi.org/10.20546/ijcmas.2017.608.420
- Viskelis, P., Jankauskiene, J., & Bobinaite, R. (2008). Content of carotenoids and physical properties of tomatoes harvested at different ripening stages. Food Balt, 166–170.
- Wang, F., Kang, S., Du, T., Li, F., & Qiu, R. (2011). Determination of comprehensive quality index for tomato and its response to different irrigation treatments. Agricultural Water Management, 98(8), 1228–1238. https://doi.org/10.1016/j.agwat.2011.03.004
- Wankhede, P. S., Dahiwalkar, S. D., Gorantiwar, S. D., & Gaikawad, M. A. (2018). Effect of different irrigation regimes and fertigation levels on yield of tomato under naturally -ventilated polyhouse and Open field. International Journal of Agriculture Sciences, 10(4), -5207–5211. https://doi.org/10.9735/0975-3710.10.4.5207-5211
- Xiukang, W., & Yingying, X. (2016). Evaluation of the effect of irrigation and fertilization by drip fertigation on tomato yield and water use efficiency in greenhouse. International Journal of Agronomy, 2016, 1–10. https://doi.org/10.1155/2016/3961903
- Xu, J., Wolters-Arts, M., Mariani, C., Huber, H., & Rieu, I. (2017). Heat stress affects vegetative and reproductive performance and trait correlations in tomato (Solanum lycopersicum). Euphytica, 213(7), 1–12. https://doi.org/10.1007/s10681-017-1949-6
- Yang, S., Yang, Z., Cai, X., Wang, L., & Zhou, X. (2018). Simulation of light response of photosynthesis for greenhouse tomato leaves under high temperature and high humidity stress (in Chinese) Chinese J. Ecology, 37(2003), 7. https://doi.org/10.13292/j.1000-4890.201807.020
- Zakari, S. A., Tadda, S. A., Galadanci, N. I., & Aliyu, K. T. (2017). Response of growth and yield characters of tomato (Solanum lycopersicum L.) varieties to nitrogen rates during the rainy season. Nigeria Agricultural Journal, 48(2), 26–33.
- Zheng, Y., Yang, Z., Chao, X., Wang, L., Huang, H., & Yang, S. (2020). The interactive effects of daytime high temperature and humidity on growth and endogenous hormone concentration of tomato seedlings. HORTSCIENCE, 55(10), 1575–1583. https://doi.org/10.21273/HORTSCI15145-20