
 ?Mathematical formulae have been encoded as MathML and are displayed in this HTML version using MathJax in order to improve their display. Uncheck the box to turn MathJax off. This feature requires Javascript. Click on a formula to zoom.
Abstract
Chickpea is a popular food in Ethiopia and is an important source of income for many smallholder farmers. In order to promote chickpea cultivation and make it more economically viable, it is necessary to determine which markets are most suitable. Among the econometric models, the multivariate probit model is appropriate and was used to study the determinants affecting the choice of outlets for chickpea in the district. The model found that wholesalers and retailers (61% and 18% of total buyers, respectively) were the most likely to purchase chickpeas. Collectors (25% of buyers) and consumers (35% of buyers) are also important, but are less likely to succeed compared to the other market participants. Based on these results, the government and other stakeholders need to focus on developing infrastructure and improving access to credit to help farmers decide which market to target and choose the best one.
PUBLIC INTEREST STATEMENT
Chickpea (Cicer arietinum) is an important food legume mainly produced by smallholder farmers under rainfed Agricultural production system and improved variety is the major cultivated crop in Ethiopia. The use of Multivariate probit is an important strategy for determine market outlet of smallholder chickpea producers. Ethiopian chickpea production is shifting from traditional cultivars to improved varieties and from desi variety to the kabuli variety. Kabuli is high yield with relative to desi varieties which indicates the productivity is increase but there are market problem. Therefore, this study focuses on analysis market outlet of chickpea in order to identify marketing problem and improve farmer traditional selling system.
1. Introduction
In Ethiopia, agriculture is the backbone of the country’s economy as it is one of the main sources of income and employment in Ethiopia. It accounts for a large part of the country’s economy and contributes 35.8% of GDP, exports many goods, and employs many people (CIA, Citation2018).
Chickpeas are an important part of life in Africa. They are a basic source of income for millions of people in the country and can also help reduce malnutrition and improve food security. Chickpeas are mainly grown in Ethiopia, followed by Malawi and Tanzania.The area under chickpea cultivation in Ethiopia was estimated at 239,755 hectares and the amount of chickpea produced in Ethiopia is estimated at 458,682 tons (FAOSTAT, Citation2014).
Ethiopia is one of the world’s leading producers of chickpea. Chickpeas are a popular food in many parts of the world, and Ethiopia is no exception. People in Ethiopia are changing the way they grow chickpeas. They are using better varieties of chickpeas that sell better and yield more. They are also following advice from researchers on how to grow them better. They plant the chickpeas later in the year to make sure they have enough water. Because of these changes, they grow many more chickpeas than before (Mekasha, Citation2013).
According to Mitiku (Citation2011), the type of cultivation (e.g., the type of beans grown, the type of maize) has a great influence on the price of chickpeas at the farm gate. This is because few high-value chickpea varieties are grown in Ethiopia and most chickpeas sold in the market are local, low-value varieties. One way to help farmers make more money from chickpeas is to change the organization of the chickpea market. For example, the market could be divided into different channels so that more people buy chickpeas from the producers who get the best price. However, currently these growers don’t sell their chickpeas in an organized way, and they don’t get the best price for various reasons. It’s important to study the factors that influence chickpea producers’ decisions about where to sell their crop so that they can make the most profit. Therefore, this study focuses on to analysis the determinant of market outlet choice and identify marketing problem of chickpea producers.
2. Methodology of the study
2.1. Study area description
Este is one of the districts in the South Gondar Zone of the Amhara Region and is located in the northwestern corner of the country. Este borders the Abay River to the south and Andabet & Dera, Fogera, Lay Gayint, Simada and Farta to the west, northwest, northeast, east and north. There are 46 Keble Administers in the area, 11 of which are eligible for chickpea cultivation. This can be seen on the map (Figure ).
Figure 1. Map of Este.
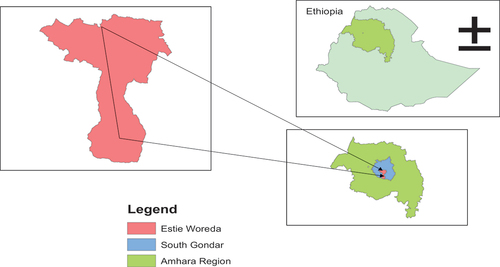
The district lies 1500–4231 m above sea level on an annual average and receives 1403.85 mm of precipitation on average. The weather is usually rain-free in most months, but sometimes it can be unpredictable. Daytime temperatures usually range from 8.3 to 25 degrees Celsius, and the ground is usually brown. In the region where we study, there are different types of land, some of which are higher in elevation and colder than others. Most people live in the low mountain regions where the weather is good for them.
According to the CSA census (2015), the population of East Este woreda was 210,825 people in 2015. 107.555 of these people were men, and 103,270 were women. Of these, 6.59% lived in urban areas. 97.08% of the population belongs to Ethiopian Orthodox Christianity, and 2.91% are Muslims. Wheat, teff, barley, maize, peas, chickpeas, noug, beans, bananas, mangos, avocados, oranges, and lemons are the main crops grown in this study area. Other crops grown here include oranges and lemons, which are the main fruit crops. These crops generate the most income for the household, as well as providing income for livestock such as cows, sheep, and goats. Cattle and sheep graze on free-range land, while chickens scavenge for food. Livestock is a major source of income for these families, and the main source of income for cows, sheep, and goats comes from the sale of these animals (EWOA, Citation2019).
2.2. Type, Source and Method of Data Collection
Both types of data that is qualitative and quantitative data were gathered in different sources (respondents, collectors, district retailers and wholesalers, farmers and extension agents, district agricultural office, trade office as well as different annual and survey report).This data was used to study the agricultural sector in an area. The sources of data were analyzed to help understand the area’s agricultural situation.
2.3. Sample Size and Sampling Techniques
To study chickpea production and trade in a particular district in Ethiopia, a sample of households was selected from four randomly selected chickpea producing villages. A total of 122 households were chosen from these villages, with half of them coming from the most populous village and half from the least populous village. At the end the sample size was determine by using (Taro, Citation1967) formula
where
n = is the sample size 122
N = total population 8,690
e = is the level of precision 0.09
The census survey was conducted to collect data from wholesalers there are in the district. In this study wanted to know how many people sell them in the district, but it was hard to find out. So, did another survey to get a better idea. The study talked Out of the 25 traders who sell chickpea products. 7 of them were from the big market in the district, 5 were from a smaller market in a village, and 9 were people who collect the chickpeas to sell.
2.4. Data analysis method
2.4.1. Descriptive analysis
The descriptive statistics that were used to analyze the sample households and traders included frequency, mean, standard deviation, and percentage. Additionally, the constraints that affect chickpea production and marketing were analyzed using descriptive statistics.
2.4.2. Econometric analysis
Multinomial model is one of the Econometric models that used when someone can only choose one thing from a group of options that don’t overlap with each other (Gumataw et al., Citation2013).Therefore for this study it is possible for producers to make choices about which markets they sell their crops to, without necessarily having to choose only two. This is done using a model that takes into account the possible correlations between the different market choices. For example, if chickpeas are a cash crop in the study area, and the overall market context may compel producers to sell their crops to more than one market at the same time, the model would take that into account (Belderbos et al., Citation2004).
When farmers decide where to sell their chickpeas, they have different options to choose from. Each farmer might choose a different option based on what they think will make them the most money. To measure how much benefit each option gives the farmer. For example, one option might be to sell to a big store that buys a lot of chickpeas (wholesaler), while another option might be to sell directly to people who will cook and eat the chickpeas (consumers). To use letters to represent each option and measure the benefit (or profit) the farmer gets from each one. This letter where K denotes choice of wholesaler (X1), retailers (X2), collectors (X3) and consumers (X4). The farmer decides to choose the Kth market outlet if X*ik = UK- UO > 0. The net benefit X*ik that the farmer derives from choosing a market outlet is a latent variable determined by observed explanatory variable (Zi) and the error term (εi):
Using the indicator function, the unobserved preferences in the above equation translates into the observed binary outcome equation for each choice as follows:
Where Xi1 = 1, if farmers choose wholesale(0 otherwise), Xi2 = 1, if farmers choose retailer(0 otherwise), Xi3 = 1, if farmers choose collector (0 otherwise) and Xi4 = 1, if farmers choose consumer (0 otherwise).
In multivariate model, where the choice of a number of market outlets is possible, the error terms mutually follow a multivariate normal distribution (MVN) with a mean of zero and variance—covariance matrix V has values of 1 on the leading diagonal and correlation ρjk = ρkj as off- diagonal element where (μx1, μx2, μx3, μx4) MVN ~ (0, Ω) and the symmetric variance-covariance matrix Ω is specified by:-
Pursue the outline used by Cappellari and Jenkins (Citation2003), the log-likelihood function related with a sample result is then given by;
Where ω is an optional observation weight of i … N and Φ is the mv standard normal distribution with point of view μi and Ω, where μi can be denoted as:
Matrix Ω has element essentials Ωjk, Therefore, to use multivariate probit model to study producers joint-decision to market outlet choice.
3. Result and discussion
3.1. Descriptive statistical analysis
Table tells us that most households run by men use Wholesaler and Consumer as their way of selling chickpea product, while fewer use Retailer or Collector. For households run by women, fewer use Wholesaler and Consumer, and more use Retailer and Collector. This means that men are more likely to use Wholesaler and Consumer to sell chickpea product.
Table 1. Characteristics of chickpea producers in relation to choice of market outlet
3.1.1. Off-farm income
Table shows that some farmers have more access to off-farm income than others. This means that some farmers can more easily sell their produce to other outlets than others market actor. Those with access to off-farm income are more likely to sell their produce to a wholesaler than a collector.
Table shows how people sell their things. Some people go to a big store called a “Wholesaler,” some go to a regular store called a “Retailer,” some sell to people who collect things, and some just sell directly to other people. Most people who sell at the Wholesaler and directly to other people have access to information about prices. Knowing the prices helps them sell their things better.
3.2. Market channel of chickpea
The people who produce chickpeas in this area use different ways to sell the product, but the study found five most common ways. These ways help them sell their chickpeas to different people who buy chickpea. The main people who buy chickpeas from the producers are big stores and shops. These are called channels and it describes as below in the Figure ;
Figure 2. Market channel of chickpea in the study area.
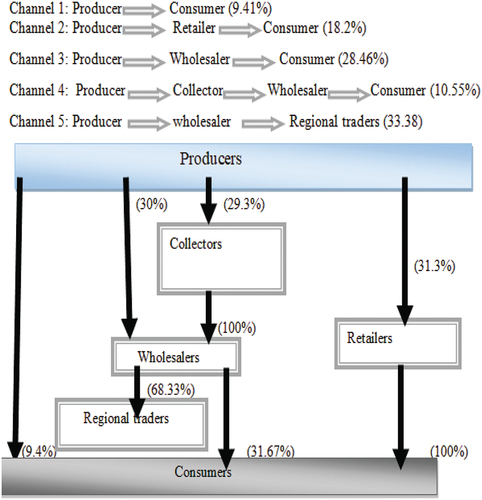
Chickpeas are bought and sold in different ways. Chickpeas went through five different channels in the figure. Chickpeas that were bought by the producer (61.84%) were passed on to the next channel (Wholesaler) the most. Chickpeas that were bought by the retailer (18.2%) were passed on to the next channel (Retailer) the least. Chickpeas that were bought by the collector (10.55%) were passed on to the next channel (Collector) the most. Chickpeas that were bought by the consumer (9.41%) were passed on to the next channel (Consumer) the least.
3.3. Econometrics analysis
3.3.1. Determinants of market outlet choice of chickpea
Some of the factors that were considered include: sex, whether the person is educated, how many people are in the family, how much chickpea the farm is producing, how much off-farm income the farmer has, and how often they’ve been in contact with extension services. The model found that access to market information, distance to the market, and credit availability were all important factors in determining market channel choice. To figure out which market channel farmers in Este district prefer, a model was used that took into account factors like sex, education, family size, number of livestock, size of the farm, chickpea crop production, off-farm income, and farming experience. Farmers in Este district have four different ways to sell their chickpea crop: through wholesalers, retailers, collectors, and consumers.
The result shows that Wald test (Wald (χ2 (60) = 113.47, p = 0.0000) is strongly significance at 1% probability level, which implies that the subset of coefficient of the model is jointly significance and that the explanatory power of the factors include in the model is satisfactory, thus, the multivariate probit model fits the data reasonably well. The simulated maximum likelihood estimation result (LR(χ2(6) = 29.7787 Prob > chi2 = 0.0000 of the null hypothesis of independence between the market outlets decision (ρ21 = ρ31 = ρ41 = ρ32 = ρ42 = ρ43 = 0) is significance at 1% significance level. Therefore, the null hypothesis that all the ρ (Rho) values are jointly equal to 0 is rejected, this indicate the goodness-of fit of the model and supporting the use of MVP model over individual probit model. This proves that separate estimation of choice decision of these outlets is biased, and the decisions to choose the four chickpea marketing outlets are interdependent.
The estimation of SML found in table probability of success for each market outlet is different. The 36% success probability for consumers’ market was high, while the 30%, 25%, and 35% success probabilities for retailers, collectors’, and consumers’ market channels, respectively, were lower. However, the joint success and failure probability for all three market outlets was only .0154%. This means that if we choose all three market outlets, we have a 1 in 13.4% chance of failing.
Table 2. Probability, overall fitness and correlation matrix of market outlet in MVP model
The “ρ” value tells us how closely the different market channels are related to each other. It is found to be statistically significant, meaning that there are three different values that are all negatively related to one another. The most significant correlation is found between the choice of retailer and wholesaler channel, which is negative and significant at 5%. When farmers pick one way to sell their products, they are less likely to pick other ways to sell them too. This was found to be true when they chose who they sold to and where they sold it. It was found that this happens a lot and is important.
The table shows that three of the thirteen variables considered in the multivariate probit model (wholesalers outlet, retailers outlet, and collectors outlet) are significantly affected by different levels of significance. Two other variables (consumers’ outlet and area code) are also significantly affected by different levels of significance.
Table 3. Multivariate probit estimation result for determinant of market channel choice
3.3.1.1. Household Gender
The study found that collectors (a type of market trader) tend to choose different channels of trade depending on the household headed sex. This is especially true for African indigenous vegetable and ground net markets, where the choice of channel is meaningfully affected by the sex of the household head Riziki et al. (Citation2015) and Ahmed et al. (Citation2017). This recommends that male-headed households are more likely to sell through other channels, while female-headed households are more likely to sell through collectors channels.
3.3.1.2. Education of the household
The education status of farmers has a positive association with the probability of choosing different outlets, with the most significant effect seen for producers who have attained secondary school. This suggests that more educated farmers are more likely to sell their products to wholesalers, as they may be better equipped to carry out marketing and transportation activities. This is in line with research by Wosene (Citation2018), which found that more educated farmers were more likely to sell pepper through wholesalers because they were more likely to spend less time on marketing activities.
3.3.1.3. Household Family size
The study found that families with high number are less likely to buy chickpeas from consumers, which could mean that having a large family size is an indicator of needing to consume more than other households. This is in line with the findings of Hailu and Fana (Citation2017), who found that family size negatively affected the choice of retailer channel.
3.3.1.4. Off-Farm Income
The table tells us that if a farmer has a job outside of their farm, they are less likely to sell their products to a collector outlet. But they are more likely to sell to a wholesaler or directly to a consumer. This is because they have other options to sell their products. This is similar to what Hailu (Citation2016) discovered: that having a job outside of the farm makes it less likely for a farmer to choose a rural collector as their way of selling their products.
3.3.1.5. Access to credit
The study found that people who get credit are more likely to buy Chickpea products from other stores than people who don’t get credit. This is because people who get credit can usually borrow money to buy things, and Chickpea is often bought in stores. The study found that people who get credit tend to choose different retailers’ outlets than those who don’t. This is especially true for Chickpea, which is a food item that’s often bought in stores.
3.3.1.6. Lagged price of Chickpea
When people buy chickpeas, the price is different depending on who they buy them from. The study see that the people who buy a lot of them (wholesalers and consumers) are willing to pay more, which is good for the farmers who grow them. But the people who buy less of them (retailers and collectors) don’t want to pay as much, which is not as good for the farmers. This is similar to what someone else that is Hailu (Citation2016) found in a study, which showed that people are more likely to buy from big stores than from small ones if the price is lower.
3.3.1.7. Distance to the Nearest Market
When farmers are really far away from stores where people buy their products, they are less likely to sell their products there. That’s because most of the people who buy things in that area are farmers themselves, and they sell their goods to bigger stores instead. This is similar to what found in a study in (Tilahun, Citation2018).
4. Conclusion and recommedation
Factors like gender, education status, household size, and income of the household members all have a big impact on the decision farmers make about using the market or selling their crops through a cooperative. This means that farmers need to pay close attention to these factors in order to make the most profit from their chickpea production. The study found that improving education levels, providing extension and credit services, and establishing transportation facilities can help producers get better markets for their products.
The multivariate probit model suggests that different factors have influenced producers’ choice of marketing outlets for selling chickpeas, and chickpea farmers have been able to access different marketing channels depending on the factors involved. By providing education and services to producers on the most effective marketing channels, it was possible to help them increase their profits.
The study found that, depending on the level of education of the consumers, different outlets sold chickpeas more or less profitably. Chickpea farmers who live a long way from the market are less likely to sell to these consumers, suggesting the importance of having good transportation services to reach the market. However, efforts by concerned stakeholders to improve access to transportation, markets, and other infrastructure may help promote chickpea marketing and increase the amount of chickpeas sold at the most profitable outlets. Higher-educated consumers are more likely to buy chickpeas from more profitable outlets, so it is important to increase awareness of this among people in general and especially among children, who are more likely to start eating chickpeas at an early age.
Authors contributions
The Authors can be write original draft, Interpreting, Review and Edit the article. So the Authors contributed to the article and approved the submission version
PUBLIC INTEREST STATEMENT .docx
Download MS Word (13.5 KB)Author biography .docx
Download MS Word (70.1 KB)Disclosure statement
No potential conflict of interest was reported by the author(s).
Data availability statement
The author wants to declare that they can submit the data at any time based on publisher’s request. The datasets used and/or analyzed during the current study will be available from the author on reasonable request.
Supplemental data
Supplemental data for this article can be accessed online at https://doi.org/10.1080/23311932.2023.2285226
Additional information
Notes on contributors

Chernet Worku
Chernet Worku is a lecturer in Department of Agribusiness and value chain management at Debre Markos University, Ethiopia and he holds his MSc degree in Agribusiness and value chain management from University of Gondar since 2020. He taught several courses for agribusiness and value chain management department students. His Research areas of interest are conducting research on adoption, Climate smart Agriculture, commercialization, income diversification, value chain, market chain, etc.
References
- Ahmed, J., Umare, A., Mahamed, N., Galane, O., & Desse, K. (2017). Factors affecting groundnut market outlet choice in moisture stress area of Babile district, Eastern Ethiopia. International Journal of Agricultural Science, Research and Technology in Extension and Education Systems (IJASRT in EESs), 7(2), 91–11.
- Belderbos, R., Diederen, M., Lkshin, B., & Veugelers, R. (2004). R and D cooperation strategies hetrogeneity. Internationa Journal of Industrial Organization, 22(8–9), 1237–1263. https://doi.org/10.1016/j.ijindorg.2004.08.001
- Cappellari, L. & Jenkins, S. (2003). Multivariate probit regression using simulated maximum likelihood. The Stata Journal, 3(3), 278–297.
- CIA (Central Intelligence agency). (2018) . The work of nation, Ethiopia economy profile 2018. CIA World fact book.
- EWOA (Este Woreda Office of Agriculture). (2019). Este Woreda unpublished Report, August 20, 2019 unpublished.
- FAOSTAT (Food and Agriculture Organization Statistical Division). 2014. Crop production http://www.faostat.fao.org.
- Gumataw, K. A., Jos, B., Stefano, P., & Onno, O. (2013). Adoption of improved potato varieties in Ethiopia: The role of agricultural knowledge and innovation system and smallholder farmers’ quality assessment. Agricultural System, 122, 22–32. https://doi.org/10.1016/j.agsy.2013.07.008
- Hailu, A. (2016). Value chain analysis of vegetables: the case of Ejere Woreda Oromia Region, Ethiopia. MSc Thesis. Haramaya University,
- Hailu, C., & Fana, C. (2017). Determinants of market outlet choice for major vegetable crop: Evidence from smallholder farmers of Ambo and Toke-kutaye district, Oromia Region, Ethiopia. International Journal of Agricultral Marketig, 4, 161–169.
- Mekasha, C. (2013). Report on chickpea postharvest loss assessment survey-Ethiopia. Ethiopian Institute Of Agricultural Research.
- Mitiku, D. (2011). Marketing of Kabuli and Desi Chickpeas By Smallholder Farmers In Eastern Shewa Zone.M.sc. An MSc ThesisSchool of Graduate Studies of Haramaya University,
- Riziki, M. J., Saidi, M. P., Nkurumwa, S. M., & Ipomai, A. S. (2015). Determinants of choice of marketing outlets for African indigenous vegetables among the Agro-Pastoral Maasai of Narok and Kajiado counties of Kenya. Journal of Economics & Sustainable Development, 29–42.
- Taro, Y. (1967). Statistics: An introductory analysis (2nd ed. ed.). Harper and Row.
- Tilahun, Y. (2018). Potato market chain analysis: the case of sekela Woreda Amhara Region, Ethiopia. MSc Thesis. Haramaya University, 45–56.
- Wosene, G. (2018). Analysis of red pepper value chain: the case of Wenberma Woreda Amhara Region, Ethiopia. MSc Thesis. Haramaya University,