
 ?Mathematical formulae have been encoded as MathML and are displayed in this HTML version using MathJax in order to improve their display. Uncheck the box to turn MathJax off. This feature requires Javascript. Click on a formula to zoom.
Abstract
This article analyzes maize value chain performance in Malawi and Mozambique using data collected from a market study commissioned by the International Centre for Tropical Agriculture. The results show that although smallholder maize productivity is slightly higher in Malawi, a maize value chain analysis indicates that smallholder maize in Mozambique is more competitive. Mozambique has a relatively higher competitive advantage with regard to maize production because of the relatively lower input costs, perhaps due to its proximity to the coast, which invariably reduces input costs relative to its land-locked neighbor, Malawi. However, smallholder maize productivity is low in both countries, when compared to the regional average. The article concludes that interventions aimed at raising smallholder productivity would invariably make smallholder farmers more competitive. It proposes policy implications aimed at raising the productivity and trade competitiveness of maize, as this will ensure the overall productivity of the maize-based smallholder farming system in the two countries.
PUBLIC INTEREST STATEMENT
This paper outlines the comparative advantage of producing and marketing Maize in Malawi as compared to Mozambique. Maize is the major staple crop in Southern Africa region and thus considered very important for food security in the two countries. However, its production and marketing is key to both countries thus the need of comparison in commodity choices as part of trade-offs analysis. Malawi faces land scarcity and economy of scale is compromised as compared to Mozambique. In this study results show that smallholder farmers from Malawi and Mozambique face different, albeit similar levels of competitiveness in the production of maize in the legume-cereal farming systems. Competitiveness indicators for maize show that Mozambique has some competitive advantage in the production of maize when compared to Malawi. Mozambique has the competitive advantage in maize production because of the relatively lower input cost, perhaps due to its proximity to the coast, which invariably reduces the input costs relative to the land-locked Malawi.
1. Introduction
Maize is among the major staple food crops in most sub-Saharan African countries. In Malawi and Mozambique the major food staples are maize, rice and cassava. These are followed by wheat, millet, sorghum and potatoes. In both countries the smallholder subsector cultivates most of the land and produces most of the food crops. This subsector is characterized by small land holdings of 0.5–1.8 ha in Malawi and Mozambique. Maize is also the most informally traded staple commodity in Southern Africa, and in particular between Malawi and Mozambique (World Food Programme & FEWSNET, Citation2007). Approximately, half of the maize in Mozambique is produced in the northern region and about 60 percent of this maize is sold through cross border trade with neighboring countries especially, Malawi, largely through informal channels (Burke & Myers, Citation2014). Burke and Myers (Citation2014) reported that informal trade accounted for at least 80% of the maize traded between Malawi and Mozambique. The southern part of Mozambique usually has maize deficit and relies on imports from Lesotho and South Africa.
Smallholder agriculture in Malawi has been characterized by low productivity attributed to loss in soil fertility, low application of inorganic fertilizers and traditional low-technology rain-fed farming systems (Chirwa, Citation2006; Tchale & Sauer, Citation2007). In response to the decline in smallholder agricultural production, the Malawian government embarked on Farm Input Subsidy Programme (FISP) that targets maize farmers (Levy, Citation2005; Rubey, Citation2004, Citation2005). The FISP resulted in increased land productivity, which in turn resulted in increased maize production. The excess production of maize beyond household food requirements resulted in farmers selling some of the crop produce on the market. It is envisaged that increased sales of maize should have increased smallholder farm gate incomes (Rubey, Citation2004).
Similarly, due to low maize productivity, the government of Mozambique has embarked on a number of strategies aimed at improving staple food production in the country. In 2009, Mozambique introduced a Farm Input Subsidy Program as a pilot test with the aim to increase maize production and reduce import dependency. The program was funded by EU and targeted 25,000 farmers from 2009–2010 and 2010–2011 cropping seasons. The program achieved an increase in maize productivity that persisted two years after the program. According to African Center for Biodiversity (Citation2017), the program has been amended. The increased maize production may have resulted in increased maize sales within Mozambique and across the borders.
The market liberalization programs that several African countries embarked on, including Malawi and Mozambique, attracted private traders into the farm gate buying and retailing of smallholder farmers’ agricultural commodities (Øygard et al., Citation2003). In Mozambique, since about 1997, there are no price controls in effect for the major food staples. The private sector is free to set the prices according to competitive markets, although the government may issue indicative (non-binding) prices (Alemu & Van Schalkwyk, Citation2009). However, the Malawi government introduced some price controls on farm gate prices to protect the smallholder farmers from unscrupulous traders. Market competition induced by these private traders does not, however, appear to benefit smallholder farmers. Some evidence indicates that there is collusion among private traders in the smallholder subsector produce market (Government of Malawi, Citation2006). To understand the gains and losses along the maize supply chain, from smallholder farm gate to processors, a value chain analysis is necessary. A comprehensive value chain analysis will show players that take advantage of others and then guide appropriate policy decision. This article presents the results of an analysis of the competitiveness of Malawi and Mozambique in the production of smallholder maize. The analysis is based on data that was collected through a market study conducted in selected areas of the two countries at prices prevailing in the 2011/12 agricultural season. The analysis covers only the low level of smallholder management of maize.
This comparative value chain study across the two countries aims to determine private costs and the profitability of different stages in the value chain, understand cost composition of smallholder farm production, and measure baseline trade competitiveness among smallholder farmers in regional and global markets to assess how best to facilitate farmers’ access to such markets. The value chain approach is explained in the next section.
2. The value chain approach
Three known value chain studies have been done for Malawi and Mozambique to understand production cost structure and competitiveness based on data collected from smallholder farmer market outlets, farmer–buyers linkages, gains and losses along the value chain (Mango et al., Citation2015; Chagomoko, Afari-Sefa, & Pitoro, Citation2014; Tchale & Keyser, Citation2010). Agricultural value chains link urban consumption with rural production. Value chain analysis has gained considerable importance in recent years because of the need to assess the key sources of cost efficiency or the lack of it along the value-chain of the commodity in order to come up with appropriate policy interventions aimed at raising overall value-chain efficiency. The United Nations Industrial Development Organisation (Citation2009) describes a value chain as the entire range of activities that are undertaken to bring a product from the initial input-supply stage, through the various phases of processing, to its final market destination, including its disposal after use. For instance, agro-food value chains encompass activities that take place at the farm or rural level, including input supply, and continue through handling, processing, storage, packaging and distribution. As products move successively through the various stages, transactions take place between multiple chain stakeholders, money changes hands, information is exchanged and value is progressively added. Hence a value chain is a system of interdependent activities. Stabel and Fjeldstad (Citation1998) define value chain analysis as a method for decomposing a firm or an industry or a commodity sector into strategically important activities and understanding their cost and value build-up. An industry or commodity sector may gain competitive advantage by performing these strategically important activities more cost-efficiently or better than its competitors. Chagomoko et al. (Citation2014) carried out a participatory evaluations and market research on a range of traditional vegetable value chains with the aim of selecting actual and potential target crops, establish modes and types of farmer-buyer linkages and their corresponding marketing outlets, and identify value chain constraints and opportunities for Malawi and Mozambique. In their study, which mixed qualitative and quantitative methods, they found that most farmer–buyer market linkages were spot market relationships, except for the linkage between retailers and supermarkets, which showed an ongoing relationship. They also observed that traditional vegetable sales contributed about 35% and 30% of smallholders’ income in Malawi and Mozambique, respectively. Much as the study was done for two countries but it did not necessarily analyze competitive advantage. Chagomoko et al. (Citation2014) noted the weakness of value chain studies that use qualitative approaches only. Mango et al. (Citation2015) conducted a comparative analysis of tomato value chain competitiveness for Malawi and Mozambique using quantitative value chain approach. They observed that Malawi had a slightly higher competitive advantage in the production of tomato compared to Mozambique, primarily, due to slightly higher productivity and low labor and irrigation cost advantage. This study concentrated on tomato farming subsector only. Tchale and Keyser (Citation2010) applied quantitative value chain approach to assess Malawi’s competitiveness in key agricultural commodities (tobacco, maize, cotton and rice). In their results, they reported that Malawi had a competitive advantage in the production and exportation of tobacco and cotton due to low labor cost advantage. They found that based on 2007/08 price and costs, Malawi did not have competitive advantage in maize and rice production and exportation because the domestic costs of maize and rice production were higher than the export parity price. This current study uses the quantitative value chain analysis methodology as done by Mango et al. (Citation2015) and Tchale and Keyser (Citation2010). Unlike the study by Tchale and Keyser (Citation2010), this study collected primary data from smallholder farmers in both countries at the same period to undertake a deeper analysis of the maize value chain and competitiveness between the two countries. To the best of our knowledge, besides the attempt done by Tchale and Keyser (Citation2010), no research has applied the quantitative value chain analysis approach to study competitive advantage of one of the highly traded agricultural commodity in the southern Africa region, maize, particularly between Mozambique and Malawi regions that have a long history of informal cross-border trade.
An industry or commodity sector like maize, in a particular country, is by itself a collection of activities implemented to design, produce, market, deliver and support its product (i.e. maize). These activities can potentially be represented using a value chain. Industry value chain activities can be grouped into primary activities and support activities. The industry support activities assist the success of the primary activities, strategies and approaches. These support activities include infrastructure, human capital, social capital, technology development and technology adoption (Porter, Citation2001). Support activities are inherently different in different countries due to dissimilar governing policies. The industry value chain activities (both primary and support) are the discrete building blocks of competitive advantage among different countries (Porter, Citation2001). A comparative value chain analysis between two countries discloses differences that determine competitive advantage. Sources of competitive advantage could be analyzed by systematically examining all the activities an industry performs and how they interact. Due to its nature, the value chain analysis tool can be used to analyze the sources of competitive advantage. Value chains therefore encompass all the factors of production including land, labor, capital, technology and inputs, as well as all economic activities along the value-chain, such as input supply, production, transformation, handling, transport, marketing and distribution necessary to create, sell and deliver a product to a certain destination (Mango et al., Citation2015). By revealing strengths and weaknesses along the value-chain, such an analysis helps identify possible corrective measures in order to improve overall value-chain performance which tends to benefit all the players along the chain (United Nations Industrial Development Organisation, Citation2009).
A quantitative value-chain analysis tracks the underlying costs, profits and trade competitiveness of various commodities based on prices and costs observed at a particular point in time. Competitiveness is measured against a defined benchmark at a particular point in time and the results are only sensible inter-temporal and spatial context. The approach is based on a defined model that averages the cost structure and benefit build-up faced by a typical input trader, farmer, commodity aggregator or trader, processor, etc. Such an approach is often limited in terms of capturing variations and behavior of individual players who may have their own cost structures that may vary significantly from the estimates used for this study. As such, the results may only be indicative of major trends, without the accuracy required to define the specific cost structures associated with the majority of players in the value chains. Furthermore, the study does not capture seasonal variations in crop yield, price and market opportunities in the two countries. The results only provide indicative trade-offs that may be associated with different investment decisions and policy mechanisms aimed at enhancing smallholder agricultural competitiveness in the two countries.
3. Methodology and data
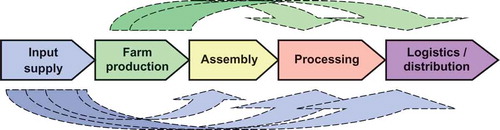
The analysis is based on the build-up of costs and value-added across all the stages of the value-chain as depicted or illustrated in Figure . In value chain analysis, all inputs and outputs carry forward their inherited value from the previous stage. This approach was first conceptualized by Keyser (Citation2006) and has been applied before in Tchale and Keyser (Citation2010) and Mango et al. (Citation2015), among others. The overall costs and values that accrue through any value-chain is an aggregation of the costs and values that are incurred at each stage along the value-chain. If, for example, input costs are much higher relative to the productivity, such cost inefficiency has an implication on the performance of the entire value-chain. Likewise, if players at the stages beyond the farm production levels charge proportionately higher costs for their services, relative to the productivity of the commodities being handled, overall value-chain performance is ultimately affected. As per Keyser (Citation2006), the competitiveness of any domestic commodity value-chain depends on the efficiency of input supply, farm production, assembly, processing and logistics up to the final delivery point where the goods compete internationally as an export or substitute for imports. By examining the cost composition at each stage of the value chain and comparing these costs with world standards or benchmarks, the methodology is able to provide an indicative level of international competitiveness and also helps identify the key stages where costs could most effectively be reduced as a strategy for sector growth.
Figure 1. Stages of the value chain.
Source: Tchale and Keyser (Citation2010)
As stated above, during the time of study both countries were administering Farm Input Subsidy Program involving maize farmers. The inputs that were subsidized included fertilizer and hybrid maize and legume seeds. In Malawi, the Government has been providing a subsidy on fertilizer targeted at smallholder maize producers since 2005. While the Government has procured fertilizer, its distribution has largely been done by the private sector. At the same time, both fertilizer and seed marketing are being undertaken by the private sector in Malawi. The situation was different in Mozambique in that both fertilizer and seed markets were operated by the private sector at the time of the study and up to present. In both countries farmers produce on customary land using fragmented land holding that are much smaller in Malawi than in Mozambique due to differences in population density. In both Malawi and Mozambique, there are a large number of intermediaries or middlemen (or assemblers) who act as price takers but collude on prices many times to the disadvantage of smallholder farmers. In Malawi, the government issues minimum prices on selected smallholder produces every year while in Mozambique the smallholder commodity market is not controlled. In most cases, as observed in both countries, farmers sell as individuals with very limited group marketing, like cooperative. In Malawi, certain crops have associations through which farmers sell their produces, like rice. Usually smallholder maize farmers act as a large number of small competitors trying to sell their produce soon after harvest in search of money to purchase other household needs. Consequently, due to large commodity supply and more sellers than buyers prices are usually low. Due to the proximity to the high demand to Malawi cities and middlemen who travel to the border markets with Mozambique, Mozambican farmers find it easier to sell their maize produce to Malawi. Most farmers in both countries sell the commodity as grain maize not processed, but this is sold either directly to processors or final consumers or middlemen or assemblers. Depending on the farmer-buyer link, prices vary with buyers at the lower stream offering better prices than assemblers. Usually processors transform the produce into maize flour, drinks from maize flour, and other food commodities depending on the processor. Other end users may be households, exporters (restricted for Malawi because maize is considered a food security crop) or government silos.
Data for this article was collected at selected sites in central Mozambique and southern Malawi from July to September 2012. These regions are dominated by the maize-mixed farming system. In each country, at least 52 maize farmers were interviewed based on the farmers that were participating in a project by the International Centre for Tropical Agriculture (see Table ). A limited number of input suppliers and crop traders were also interviewed based on availability at the market. In addition to the household and trader interviews (using semi-structured questionnaire), complementary data on cost structure was obtained from a brief literature review (Mapemba, Citation2009), key informant interviews, and the sourcing of production information from crop research institutes and statistical abstracts. Subsequent to the data collection and preliminary analysis, agricultural experts were consulted to validate the draft results and give feedback on major bottlenecks and recommendations for improvement. The initial crop budgets were examined against comments from industry stakeholders, corrected, where appropriate, and used to calibrate the models that have produced the study’s results.
Table 1. Description of the smallholder and trader samples in Malawi and Mozambique
4. Analytical framework
Total costs are measured in terms of domestic value added (DVA) expressed in international currency units and shipment value (SV), which represents the cost of production and shipping the commodity to a foreign market. DVA and SV are estimated using the following equations:
where DVA is the domestic value added expressed in domestic or international currency units, X is the sum of domestic costs and mark ups by various players along the value chain, Y is the sum of domestic duties and taxes and Z is the sum of all unofficial charges and extra costs incurred along the value chain.
where SV is the shipment value that represents the total cost of producing and shipping the commodity to a foreign market and FC is the sum of all foreign costs incurred in the process of shipping a commodity to a foreign market, including any duties and taxes.
Through trade policy and regulations, countries often have influence over domestic prices, and this invariably also affect the DVA, and as given in Equation (2), the DVA also influences the SV. DVA and SV are affected by legitimate business costs and mark ups, official customs duties and taxes, as well as unofficial payments and bribes that sometimes have to be made to facilitate a particular operation. Because any country only has influence over its own domestic policy, DVA is an important measure of the extent to which a country can achieve competitiveness of its domestically produced commodity. When DVA is less than a specific export parity benchmark, a country is said to be competitive in producing and exporting a given commodity (at least against the country (ies) from which the particular benchmark is estimated. Likewise, if the DVA is less than a specific import parity benchmark, a country is said to be competitive in producing commodities which it can use to substitute for imported commodities.
On the other hand, because of the comprehensive nature of the SV in that it combines both domestic and foreign costs; it is also a measure of competitiveness in regional and international markets. Regional or international trade competitiveness is determined by comparing SV at the final market with an equivalent parity price, which is a Free on Board (FOB) price for exports or a Cargo, Insurance, Freight (CIF) price for import substitutes. By examining the build-up of SV (and DVA) from stage to stage, the methodology reveals the competitiveness of the overall value chain, including the various segments and key players along the chain. For example, if one stage accounts for a disproportionately large share of final SV, interventions focused on that part of the value chain are likely to have a significant impact on the overall competitiveness of the chain (Keyser, Citation2006; Tchale & Keyser, Citation2010).
4.1. Farm-level analysis
The defined typology used for the analysis is termed FAM-Low, which implies low level of farm management given that over 90% of the farmers interviewed in the two countries are classified as low-input, low-output smallholder farmers. This is the most basic management regime, typical of the average maize farmer who uses only the low levels of essential inputs.
In terms of prices and costs, all prices reported in this article are for the 2011/12 agricultural season. Farm input and output prices include transport up to the farm gate or other places where the next participant in the value chain takes over responsibility for that commodity. All prices are quoted in the local currency unit and are expressed in US dollars using relevant exchange rates.
The estimated crop yields reflect a realistic expectation in a year with “normal” growing conditions using low levels of inputs at smallholder farmer level. There are many variations, including seasonal growing conditions, local soil type, farmer skill, seed quality and many other factors that may affect the actual yields across countries, but it is assumed that factors affecting smallholder farming systems in these two countries are similar, and therefore their yields should be comparable. The yields of maize were assumed to be 1214 kg/ha and 921 kg/ha for Malawi and Mozambique respectively. Maize prices at farm level were assumed to be US$166.67 per ton and US$235.42 per ton for Malawi and Mozambique respectively. Maize prices at assembly level were assumed to be US$300 per ton and US$399.50 per ton for Malawi and Mozambique, respectively. The average estimated distance to maize markets was 5 km for Malawi and 12.3 km for Mozambique.
The value chain analysis uses an aggregate cost of all factors in the production and marketing of maize in 2011/12 in the two countries. Since family labor often accounts for a large share of production costs, a proxy value is applied to impute the value of family labor. A proportion of the wage was applied to value family labor, i.e. at 60% of the rate for hired labor. Smallholder farmers rarely have the opportunity to sell their labor at the full wage rate and this approach is a simple way to impute the cost of family labor for purposes of a competitiveness analysis. The amount of family labor was estimated based on the number of adult equivalents computed from household members, based on their respective ages and gender, and applying proportionate adjustments for tasks that must be carried out over a limited number of days. Data on hired labor was collected directly using the structured household survey applied to households in selected areas in the two countries.
In terms of production costs, the estimated per hectare (or per ton) cost of long-term investments used at each stage of the value chain was estimated using the capital recovery cost method. In case of simple equipment, the annual cost of using such equipment was estimated over its useful life as a basis for an estimated economic rate of return on the investment. This approach has the advantage over the simple division of an input’s value by its useful life as it accounts for the fact that if the farmer did not purchase the equipment, the money could have been invested in the next best alternative enterprise.Footnote1
The results of the key variables used for the analysis are shown in Table .
Table 2. Key variables used in the analysis
Data on maize production and returns among Malawian and Mozambican smallholder farmers is shown in Table . Maize is a staple crop in Malawi and is grown by virtually all smallholder farmers, irrespective of their agro-ecological zone. In interpreting these results, it should be noted that in the south of the country, where the study was conducted, most smallholder farmers cultivate less than 0.5 ha. The results indicate that smallholder farmers under low management systems earned US$86 per ha (or US$71 per ton) on average from maize in the 2011/12 season. Farmers spend almost half (45%) of their costs on fertilizer, 5% on seed and about 23% on labor (both family and hired labor).Footnote2
The average maize yield under the low management system is 1.214 ton/ha from rain-fed maize plot with a seed rate of 25 kg/ha. The model assumes, as per the data, the application of both basal and top dressing fertilizers, such as nitrogen, phosphorus and potassium (NPK) and urea. It also considers labor costs. At the assembly level, transportation costs and margins for the traders are taken into account in the analysis.
In the case of Mozambique, the average maize yield under the low management system is estimated at 921 kg/ha from rain-fed maize plots with a seed rate of 25 kg/ha (Table ). The model includes the application of both basal and top-dressing fertilizer. It also considers labor costs. Results on the returns show that smallholder maize farmers in Mozambique make about US$178 per hectare or US$193 per ton, which is a higher margin relative to Malawi. Total production costs amount to US$55 per hectare or US$60 per ton, which is about one quarter of the gross revenue obtained. At the assembly level, transportation costs and margins for the traders are taken into account in the analysis. The farm-level composition of the costs indicate that fertilizer and seed take up about 38%, while family and hired labor take up 27% of the costs. Annual depreciation of capital equipment and marketing costs take up 24% and 11%, respectively. Table compares the net returns to smallholder maize production in the two countries.
Table 3. Comparative indicators of value chain performance in maize (Malawi and Mozambique)
4.2. Assembly level analysis
At the assembly (or trader) level, Malawian traders are making about US$98.16 per ton of maize grain bought from farmers and sold on the market as shown in Table . They incur costs for transportation (7%), storage and fumigation (5%), packing (6%), hired labor (2%), overheads (1%) and depreciation of their capital assets (5%). On a per-ton basis, the traders appear to be making a higher margin when compared to the farmers. Given the volume of the maize they handle, the margin per ton is quite high relative to the farmers’ margin. This implies that most of the margin realized in the maize marketing chain as a whole accrues to traders, more than it does to farmers. This could be the result of the existing market structure and its underlying inefficiencies. Most of Malawi’s agricultural production areas are remotely located with weak access roads. As such, the few traders that operate in such markets charge a higher risk premium, which invariably reduces the farm gate price that is paid to farmers.
Table 4. Comparative indicators of value chain performance in maize for Malawi and Mozambique
Likewise, in the case of Mozambique, traders are making US$75.90 per ton of grain sold, as shown in Table . Maize traders incur variable costs for transportation (1%), storage and fumigation (2%), packing (6%), hired labor (5%), overheads (3%) and depreciation of their capital assets (6%). Farm production costs comprise 24% of the total costs of the assembler and 52% is the purchase price, or the produce price paid to the farmer at farm gate value. On average, traders are making a lower margin when compared to farmers, on both a per-hectare and a per-ton basis. This may imply that there are more traders in the maize market who offer competitive prices to farmers, as over half the assembler’s cost, on average, is spent to pay the farmers for the maize grain purchased. See Table for a comparison of the maize value chain performance at the assembly (trader) level between Malawi and Mozambique.
4.3. Analysis of competitiveness in maize trade between Malawi and Mozambique
In order to estimate the key measures of competitiveness as shown in Equations (1) and (2), we first started to estimate the domestic and international transportation costs; a financial price of US$0.13 per ton per km has been assumed, based on average domestic transportation costs in the two countries. This average was reported during data collection. The value chain analysis compares a country’s final SV for each commodity with an international parity price. Assumptions regarding road and sea freight prices are required. Since this data was not collected through the study instruments, assumptions were made based on national and international sources. For Malawi, information provided by the Ministry of Transport was used. To determine international transport costs for Malawi and Mozambique, an average cost of US$80 per MT was used to calculate freight costs based on the South African Futures Exchange (SAFEX) reference point at Randfontein (South Africa) plus US$40 per MT for onward freight to Blantyre (Malawi). Half the rates were used for Mozambique due to its proximity to the deep-sea ports of Nacala and Beira.
In terms of Malawi’s trade competitiveness, the total estimated DVA is US$261.86 per ton and it has a SV of US$301.34 per ton. This implies that it costs the farmer US$262 to produce a ton of maize using the low management system. Due to foreign costs (most of which comprise transportation costs), it costs the farmer US$301 to produce and export a ton of maize from Malawi (in the Balaka area).
In the case of Mozambique, given the lower costs at production and assembly levels, Mozambican maize grain traders are the most competitive relative to Malawi because they face lower domestic costs (DVA = US$138.29 per ton). Due to lower foreign costs (mostly due to lower transportation costs), the SV, which is estimated at US$224.10 per ton, also provides them much better scope for competitiveness in the maize export market. The estimated competitiveness measures are presented in Table .
Table 5. Comparative indicators of maize trade competitiveness in Malawi and Mozambique
Further comparison of the total SV for maize produced by smallholder farmers in Malawi and Mozambique, against the SAFEX parity price (US$250 per ton) shows that at this price level, Mozambique is more competitive than Malawi in terms of selling maize on the SAFEX.
4.4. Determinants of domestic value-added (DVA)
In order to come up with recommendations that are relevant for policy, the study assessed the determinants of DVA using a log-linear regression function. The log-linear function is given as:
where lnY is the natural log of maize DVAc for both countries and X is a vector of explanatory variables that were hypothesized to affect DVA in each country. These variables include land size, maize yield, family labor, age of household head, highest education level of any family member, male family members aged between 16 and 58, female family members aged between 16 and 58, and family members below the age of 16. is the stochastic error term assumed to be normal with mean zero and variance
. A log-linear function is a regression function in which one of the variables is logarithmically transformed and assumes that a non-linear relationship exists between the independent and dependent variables (Benoit, Citation2011). Using the logarithm of one or more variables instead of the un-logged form makes the effective relationship non-linear, while still preserving the linear model. Logarithmic transformations are also a convenient means of transforming a highly skewed variable into one that is more approximately normal, as in the case of this relationship where it is assumed that without logarithmic transformation, the distribution of the key variables in Equation (3) are unlikely to be similar. The results of the log-linear regression model are given in Table .
Table 6. Results of determinants of maize DVA
The regression results show that, with the exception of land size and maize yield, not all the variables were significant in explaining DVA for maize. The results show that land size and maize yield positively and significantly affect DVA. In order to improve DVA or in other words, to improve cost efficiency in domestic maize production, there is need to focus on improving the maize yield. This is consistent with other value-chain studies (Tchale & Keyser, Citation2010; Mango et al., Citation2015), which show that yield is most critical factor affecting competitiveness, particularly among smallholder farmers. Land size (or area cultivated with maize) is positively related to DVA. This is also consistent with the findings related to the inverse relationship between land size and productivity. The land area allocated to maize among smallholder farmers in the two countries is low (normally less than 5 ha). However, this is likely to be different with increasing area under maize (i.e. the inverse relationship indicates that beyond a certain level, yield declines with increasing maize area).
5. Discussion of the main findings
Four main factors may explain the level of competitiveness in the two countries in the study. These factors include crop productivity, the cost of agricultural inputs, the cost of transport, and trader margins at the assembly level. This study describes each factor and provides evidence in the following subsections where possible.
5.1. Low productivity
The study results indicate low maize yields in both countries. Although maize yield in Malawi is slightly higher (at 1.2 ton per hectare), it is considered quite low in terms of regional and international standards. Even the yield gap between these levels and the potential yields, given the technology, should be quite high. The analysis assumes similar levels of crop management and agro-climatic conditions, given that both countries face similar micro-climatic conditions and the structure of the agricultural sector is very similar, with the majority of farmers classified as smallholders with low management systems (see Figure ).
Figure 2. Comparison of smallholder maize (kg/ha).
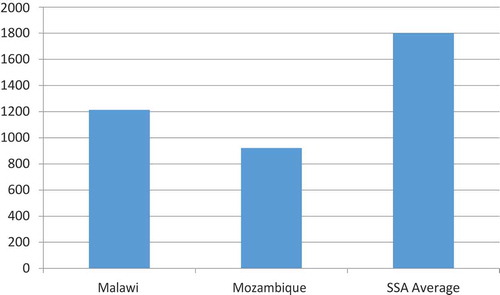
The low crop yields are attributed to the low levels of fertilizer intensity and the use of low-yielding crop varieties, mostly as a result of the high cost of agricultural inputs, especially in Malawi, which are both land locked and face high levels of international transportation costs when compared to other countries, such as Mozambique. In land-abundant countries, such as Mozambique, the yield difference could also be attributed to differences in the natural fertility of the soil. Using the analysis templates, a productivity enhancement scenario, where productivity is raised by 2–5%, is applied. The net profit and value chain competitiveness indicators are then also compared to the baseline. The results show that for every 1% increase in productivity, net revenue increases by 3.5% in Malawi and 4.5% in Mozambique. Similarly, the value chain performance indicators (DVA and SV) invariably improve with a marginal change in productivity. These results are consistent with those found in other similar studies (cf. Tchale & Keyser, Citation2010).
5.2. High cost of agricultural inputs as a result of high transportation costs
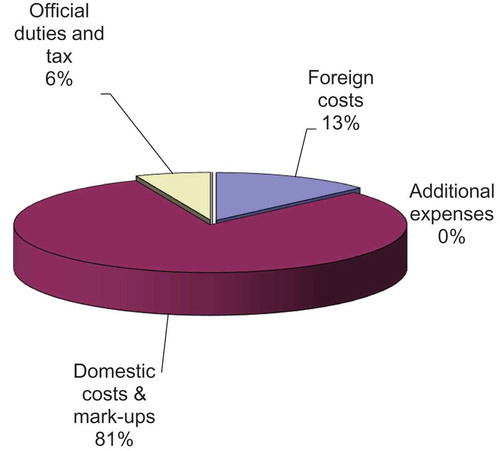
A greater proportion of the crop production costs in countries like Malawi are comprised of input costs, mainly fertilizer and improved seed. As shown in Figure , Malawi’s costs for fertilizer and other agricultural inputs are generally higher than most comparative countries. These countries, which are both far from deep-water ports, normally face very high transportation costs. The high cost of transportation invariably increases the domestic price of inputs. The study provides limited evidence of this, because it did not set up a control for the specific types of inputs, but indicative results attest to the fact that the Malawian smallholder farmers face a cost structure that is dominated by high input costs because of high foreign costs that largely constitute transportation costs. For example, foreign costs constitute 50% of the final SV in Malawi, when compared to only 13% in Mozambique (see Figures and ). Addressing this situation requires public sector interventions in the provision of public goods, as well as innovative arrangements for the procurement of inputs.
Figure 3. Composition of maize shipment value in Malawi.
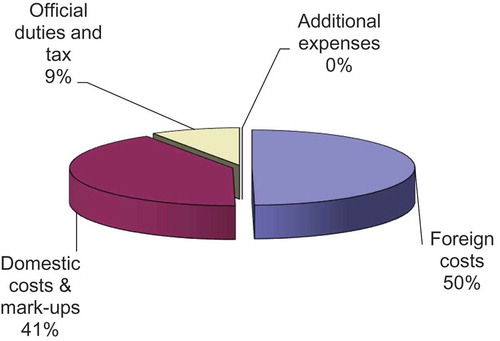
Figure 4. Composition of maize shipment value in Mozambique.
5.3. Trader/assembler margins
Findings from the study suggest higher margins that accrue to traders at the assembly level, especially in Malawi. The researchers examined maize traders’ profit margins (per metric ton) at import parity and found that they are very high when compared to the profit that accrues to the producer. Given that traders generally handle greater volumes than producers do, the traders’ margins are quite high. Such high margins are often attributed to high perceived transaction risks in the remote areas that often limit competition. As such, only a few traders with transportation facilities are able to reach remote areas where they reap monopolistic rates. Through appropriate interventions that improve the development of private traders, thereby enhancing the structure of markets, it is possible that some of the traders’ captured margins could be passed on to the producers, thereby improving the farm gate prices. This is, however, linked to the extent and quality of public goods, such as access roads.
6. Conclusions and policy implications
This article did set out to comparatively analyze the maize value chain’s performance in Malawi and Mozambique. Findings show that smallholder farmers from Malawi and Mozambique face different, albeit similar levels of competitiveness in the production of maize in the legume–cereal farming systems. Competitiveness indicators for maize show that Mozambique has some competitive advantage in the production of maize when compared to Malawi. The key factor that determines such a low competitive edge is the very low productivity of maize. Estimated smallholder productivity levels in both Mozambique and Malawi are quite low by regional and international standards. Mozambique has the competitive advantage in maize production because of the relatively lower input cost, perhaps due to its proximity to the coast, which invariably reduces the input costs relative to the land-locked Malawi.
Due to high transportation costs, Malawi faces relatively higher trader margins and intermediation costs along the value chains. Inorganic fertilizer and other agricultural inputs are costly, mainly due to high international and domestic transportation costs, as well as high trader margins as a result of high transaction risks associated with agricultural input trading. It is therefore likely that the high input cost further leads to the low uptake of fertilizer and improved seed, leading to a low uptake of improved technology. This is the main feature that causes low capitalization of low smallholder management systems, which arrests technological and institutional innovation.
In terms of policy the results imply that interventions in the smallholder sector should focus on improving agricultural productivity. Keeping all factors constant, it is likely that raising productivity alone would significantly raise the competitiveness of smallholder farmers in the two countries. Otherwise, it will be futile to link these farmers to regional and international markets at such low levels of productivity, as they would be unlikely to compete. Productivity is the most important factor in improving agricultural competitiveness as a basis for improving farmer returns. Among other interventions, the promotion of proven technological and institutional innovations that provide an incentive for private and public sector investments in agricultural research and development is critical and primary to unlocking smallholder potential.
Further other gains aimed at improving returns and competitiveness among smallholder farmers would accrue from interventions aimed at reducing the cost of fertilizer, seed and other agricultural inputs. Among other things, governments need to continue investing in public goods that are aimed at reducing transportation costs, such as the rationalization of levies on fuel, and a reduction in domestic taxes and duties. These are more critical for land-locked countries, such as Malawi, which face high transportation costs. Furthermore, there is a need to consider implementing innovative approaches to supply chain management for fertilizer and other inputs, such as timely procurement and bulk-buying arrangements with other countries in the region so as to get lower prices at the point of origin. Given the high cost of establishing viable research and development initiatives, it is worthwhile to promote regional investment.
The overall performance of value chains and the pay-off to smallholder farmers would also improve if appropriate interventions are made to improve the development of private traders, thereby enhancing the structure of commodity markets. This is likely to help smallholder farmers because some of the margins that are captured by the traders, in both the input and output market, could be passed on to the producers, which improves farm gate prices.
Availability of supporting data
Data for this study can be obtained from CIAT Dataverse. Repository URL
Acknowledgements
We gratefully acknowledge research funding from the European Union through the Forum of Agricultural Research in Africa (FARA). We also thank all reviewers for their comments and suggestions on earlier drafts of this article. Special thanks to Ms Janine Thorne for excellently editing this paper.
Additional information
Funding
Notes on contributors

Nelson Mango
Nelson Mango is a rural development sociologist specialized in agrarian transformation processes, with an emphasis on small-scale farming, technology development and social change, endogenous development, and rural livelihoods. Over the years, he has done substantive fieldwork on socio-technical dimensions of maize, zero grazing dairy farming, and soil fertility (re)production in East Africa. He has also worked on livestock, livelihoods, and poverty in Southern Asia and Sub-Saharan Africa using a wide range of methodologies drawn from both quantitative and qualitative research approaches. In the Southern Africa region, his research focused on Conservation Agriculture and how to improve farmers’ livelihoods through multi-stakeholder innovation platforms and linking them to extension and business development services. Currently, his research work has shifted to East and Central Africa with focus on value chains for nutrition and health, Policy, Institutions and Markets, and Climate change and food systems. Theoretically, he combines actor perspective with broader questions related to political economy.
Notes
1. Annual cost per hectare (or per MT) = purchase price of implement * per hectare (or per MT) share of total use * capital recovery factor (CRF). CRF = ((1 + i)^n)*i/(1 + i)^n−1 where i = real interest on savings and n = number of years in the implement’s useful life. See Monke and Pearson (Citation1989) for a detailed discussion of this methodology.
2. The farm input subsidy assumptions are not included, although it may as well be that some of the farmers interviewed may have received support through the Malawi Farm Input Subsidy Programme.
Related Research Data
References
- African Center for Biodiversity. (2017). Who will feed africans? Small-scale farmers and agroecology not corporations. Johannesburg, South Africa: Friends of the earth International. Retrieved from acbio.org.za/wp-content/uploads/2017/01/FoE-africa-report.pdf
- Alemu, Z. G., & Van Schalkwyk, H. D. (2009). Market integration in Mozambican maize markets. Ethiopia: African Books Collective. http://purl.umn.edu/25657
- Benoit, K. (2011). Linear regression models with logarithmic transformations. Methodology Institute, London School of Economics. Retrieved from http://www.kenboit.net/assets/courses/ME104/logmodels2.pdf.
- Burke, W. J., & Myers, R. J. (2014). Spatial equilibrium and price transmission between southern african maize markets connected by informal trade. Food Policy, 49, 59–70. doi:10.1016/j.foodpol.2014.05.008
- Chagomoko, T., Afari-Sefa, V., & Pitoro, R. (2014). Value chain analysis of traditional vegetables from Malawi and Mozambique. International Food Agribusiness Management Review, 17(4), 59-86.
- Chirwa, E. (2006). Commercialisation of food crops in Malawi: Insights from the household survey. Working paper 2006/04. Department of Economics, University of Malawi, Chancellors College, Zomba, Malawi. Available from: http://www.economics.chanco.mw/papers/wp2006_04.pdf.
- Government of Malawi (2006). Food security policy report. Ministry of Agriculture and Food Security. August 2006.
- Keyser, J. C. (2006). Definition of methodology and presentation of templates for value chain analysis, competitive commercial agriculture in Africa (CCAA). Washington, DC: The World Bank, Environmental, Rural and Social Development Unit.
- Levy, S. (2005). Starter packs: A strategy to fight hunger in developing countries? Lessons from the Malawi experience, 1998–2003. Wallingford: CABI.
- Mango, N., Mapemba, L., Tchale, H., Makate, C., Dunjana, N., & Lundy, M. (2015). Comparative analysis of tomato value chain competitiveness in selected areas of Malawi and Mozambique. Cogent Economics & Finance, 3, 1088429. doi:10.1080/23322039.2015.1088429
- Mapemba, L. (2009). Cost of production and gross margins analysis for selected crops under low input management in Malawi. Lilongwe: Ministry of Agriculture.
- Monke, E. A., & Pearson, S. R. (1989). The policy analysis matrix for agricultural development. Ithaca: Cornell University Press.
- Øygard, R., Garcia, R., Guttormsen, A., Kachule, R., Mwanaumo, A., Mwanawina, I., … Wik, M. (2003). The maze of maize: improving input and output market access for poor smallholders in the southern Africa region, the experience of Zambia and Malawi. Agricultural University of Norway Department of Economics and Resource Management Report No. 2.
- Porter, M. (2001). The value chain and competitive advantage. In D. Barnes (Ed.), Understanding business processes. New York, USA: The Open University, Routledge.
- Rubey, L. (2004). Do no harm? How well intentioned government actions exacerbate food insecurity: Two case studies from Malawi. Malawi, Lilongwe: Report, USAID.
- Rubey, L. (2005). Malawi’s food crisis: Causes and solutions. Report for US Agency for International Development (USAID). Lilongwe. http://www.eldis.org/vfile/upload/1/document/0708/DOC14136.pdf
- Stabel, C. B., & Fjeldstad, Ø. D. (1998). Configuring value for competitive and advantage: On chains, shops and networks. Strategic Management Journal, 19(5), 413–437. Published by Wiley http://www.jstor.org/stable/3094221 Accessed 17- 06-2018
- Tchale, H., & Keyser, J. (2010). Quantitative value chain analysis: An application to Malawi. Policy Research Working Paper (WPS) 5242. Washington, DC. The World Bank. http://documents.worldbank.org/curated/en/909391468272372680/pdf/WPS5242.pdf
- Tchale, H., & Sauer, J. (2007). The efficiency of maize farming in Malawi. Cahiers d’économie et sociologie rurales, 82–83. http://ageconsearch.umn.edu/bitstream/189748/2/82-83-33-56.pdf
- United Nations Industrial Development Organisation (2009). Agro-value chain analysis and development. The UNIDO Approach. A staff working paper. Vienna. https://www.unido.org/fileadmin/user_media/Publications/Pub_free/Agro_value_chain_analysis_and_development.pdf
- World Food Programme & FEWSNET. (2007, April). Informal cross border food trade in Southern Africa. Pretoria, RSA: UN World Food Programme Regional Bureau for Southern Africa, Johannesburg RSA and FEWSNET Regional Office