
Abstract
Purpose of the article is to assess the performance of Odisha’s health services’ multiple drug supply chain management using logistics system assessment tool (LSAT) and logistics indicators assessment tool (LIAT). Data were collected on public health supply chains at different levels, state, district, sub-district, or block. For that purpose 13 block level institutions from two districts of Odisha were included. Drug and logistics supply chains of essential drugs, and national programmes were studied. Poorly coordinated Supply chain lead to stock-out of more than 15% of total number of products was higher in backward districts and rural areas. The mean for number of days of stock-out per product were found to be highest at the block level. When we looked for Logistic management unit they were present only at the state head quarters for specific national programmes.
PUBLIC INTEREST STATEMENT
Drug supply chains in public health are expensive propositions in general. In the Odisha state, India, the stock-out of drugs was reported high in backward districts. The logistics management units were not available at different levels. Even the online drug and logistics management system were not effective. The functions such as, cold chain management, HR management, and supervision were found to be poor. Only some of the operational issues were addressed completely by the authorities. Efforts should be made on real time forecasting with stakeholders, supervision, and supply planning to establish a successful supply chain management system. This affects the stock-out situation in general that in turn affects different national programs and the routine services. The variation in reporting system and record maintenance affect the supply chain systems adversely. It was also found that there was a poor knowledge on the supply chain and logistics management systems among the service providers as many were not trained on the subject.
1. Introduction
The aim of public health is to ensure the uninterrupted supply of vaccines to immunization services, and essential drugs to other services linked to vertical programmes at their delivery points. The challenge is to deliver drugs effectively, efficiently, and sustainably. For that the system requires a strong and optimized supply chain management system. The present article is about multiple disease-specific supply chains such as vaccines for routine immunization, Tuberculosis control programme, AIDS control programme, Leprosy control programme, vector-borne disease control programme, routine essential drugs and family planning products in the state of Odisha.
Lack of infrastructure and a system in the drug supply system is an important issue. While there is an increase in multiple cold chain products, in addition to vaccines a number of other pharmaceutical products require controlled-temperature storage. This is another aspect that led to an inquiry into supply chain management in public health products.
In India, total health expenditure increases with gross domestic product (GDP), but percentage share of GDP reduced after 2004–2005 due to increasing cost of healthcare (MOHFW, GOI, Citation2009). During 2004–2005 private share of health expenditure was 78.05% and out of pocket expenditure by households around 71.13% in India out of total health expenditure. Out of expenditure on medicine/drugs contributes major share even in public health institutions due to non-availability of drugs (MOHFW, GOI, Citation2009).Out of government spending on health, expenditure on drug is the major component next only to salaries and wages and without drugs it is impossible to manage disease and sufferings(Health and family welfare department, GoO, Citation2003b). As supply chain (SC) consumes a major share of funds and, therefore, has potential for the success and sustainability of organizations if managed properly (Magak, Citation2014; Singh, Tatambhotla, Kalvakuntla, & Chokshi, Citation2013).
1.1. Supply chain
The supply chain is complex and dynamic system of organizations, processes, people, information system that involved in identification of customer need and transportation of products from supplier to customer (Pinna, Carrus, & Marras, Citation2014). Various major functions of drug and logistics supply chains are drug selection, forecasting, quantification, procurement, inventory management, storage, distribution, transportation, and logistics management information system (LMIS).
1.2. About Odisha
Odisha is a state that is located in the east of India. About 83% of population reside in rural areas and more than 22% population are tribal (Government of Odisha, Citation2015). Majority of Odisha population depend on the public healthcare system for their need (Kundu, Citation2014). In spite of gradual increase of the drug budget and policy reforms in recent years, there is evidences of drug non-availabilities at peripheral health institutions in Odisha mostly due to improper SC management (Health and family welfare department, GoO, Citation2013a, Citation2013b; Hussain, Dandona, & Schellenberg, Citation2013; Mohanty & Chakravarty, Citation2013). Overall drug and logistics systems consist of multiple fragmented supply chains distributed across various vertical and horizontal.
1.3. Evidences against the multiplicity of supply chain
Multiple Supply Chain systems ensure better product availability of specific health programme. But it increases the cost, complexity and reduces flexibility due to over specialization and probably potential for inefficiency (Bornbuschand Bates, Citation2013). Success stories of integration of family planning with essential drugs and Acquired immune deficiency syndrome (AIDS) control supply chain in Nepal, Africa, and Latin America. Intra-departmental politics, political commitment, and proper planning are important factors that lead to barrier and enabler in the process of integration (Amo-Adjei, Kumi-Kyereme, Amo, & Awusabo-Asare, Citation2014; USAID, Citation2011a, Citation2011b, Citation2011c, Citation2011d; Yadav, Lydon, Oswald, Dicko, & Zaffran, Citation2014).
1.4. Measuring supply chain performance
Performance assessment needed for public health SC to derive useful insights for SC optimization in due course. This requires adoption of a suitable performance matrix. Out of several available matrixes logistics system assessment tool (LSAT) and logistics indicators assessment tool (LIAT) of United States agency for international development (USAID) are more suitable for public health. (Bigliardi and Bottani, Citation2014; USAID, Citation2011a).
1.5. Improving supply chain performance
Health system is adopting successful strategies of business/industrial world to improve on efficiency and effectiveness of process modification(Kumar & Ozdamar, Citation2004; Iannone, Lambiase, Miranda, Riemma, & Sarno, Citation2013;Laeiddee, Citation2010; John Snow, Inc, Citation2012; USAID | DELIVER PROJECT, Task Order 1, Citation2009a; Bertolini, Bevilacqua, Ciarapica, & Postacchini, Citation2015;Global Healthcare Exchange, Citation2011). In the context of the public health supply chain following three types of process transformation were suggested. Product Integration is merger of various sub processes of different vertical programmes at strategic points where it is possible. Supply chain segmentation strategically organizes the supply chains into distinct groupings or segments that have common logistic needs with the aim of responding customer necessity. Supply chain integration interconnects all the functions, information, and people at various levels, partners across programmes, organizations, and sectors to work together in a coordinated way. There is a process of evolution through various phases such as ad hoc, organized, integrated, extended through which each supply chain moves as is matures (USAID | DELIVER PROJECT, Task Order 1, Citation2009a; Allain, Goentzel, Bates, & Durgavich, Citation2010; McCord & Olson, Citation2011).
In public health, supply chain exists as multiple chains of facilities with a complex structure. Such complex structures need regular monitoring and performance assessment for the purpose of deriving useful insights for optimization of supply chains.
A Korean study (Lee & Nam, Citation2016) empirically identified components of supply chain orientation and analysed causal relationship between supply chain orientation and supply chain management. A Moroccan study (Khlie & Abouabdellah, Citation2017) integrated the process improvement and customer satisfaction for higher patient safety in healthcare setting. A study (Chukwu, Ezeanochikwa, & Eya, Citation2017) on assessment of awareness and readiness of Nigerian pharmacists on supply chain management practices based on new policies of Nigerian government for improved access to medicines. A retrospective study (Gilbert, Thakare, Ramanujapuram, & Akkihal, Citation2017) on digital, mobile/web-based information system implementation in Uttar Pradesh, India investigated improvements and stabilization of supply chain performance after the introduction of digital information system. For performance measurement, it is important to adopt a suitable performance matrix. Many matrixes for performance measurement were developed for this. Popular matrixes are, balanced scorecard by Kaplan and Norton, supply chain operations reference model of supply chain council, data envelopment analysis by Charnes, Gunasekaran framework (Gunasekaran, Patel, & McGaughey, Citation2004), LSAT and LIAT of USAID and Bigliardi framework (Bottani & Bigliardi, Citation2014).
Among the mentioned performance frameworks, LSAT and LIAT of USAID (Citation2011a) are more suitable for public health. The LSAT is an assessment tool that studies about components of the logistics system and the LIAT is used to assess effectiveness and efficiency of system functioning (USAID | DELIVER PROJECT, Task Order 1, Citation2009).
1.6. Rationale for the study
Proposed study is first one to assess the existing situation and will help in strengthening the existing system by analysing the gaps and bringing out the practical process specific suggestions for improvement. In this study all major supply chains were studied at all levels. This is one among a few studies conducted in India. For the present study administrators and other stakeholders such as suppliers, political body general public were not considered. And only stock-out and system performances were assessed.
1.7. Objective
The present study aims at assessing the drug supply chain management performance using LSAT and LIAT and also studies the stock-out situation at different levels. By doing that it also aims at assessing the components of the logistics system and assesses the efficiency and effectiveness of the system.
2. Material and methods
Public health supply chain facilities of various levels of Odisha state were studied. A facility assessment tool that was administered to persons managing the drug supply chain of different facilities of Odisha state. LMIS a facility assessment tool was administered used for this purpose. In addition, LSAT including LMIS had the following items organizational variation, product selection, forecasting, obtaining supplies/procurement, inventory management, warehousing and storage, transportation, organizational support, and product use.
For stock status verification logistics managers were asked to report the stock-out position of the drugs and logistics out of the list using LIAT. For essential drugs, the number of items that were stock-out was more. The institutions in general indented only the items that were suggested by doctors and many were outside of the essential medicine list. Stock ledgers of 2013–2014 and 2014–2015 were studied to find the items indented by the facility and stock-out. In this process, some items out of the list were not assessed, and some items that were assessed were not included in the list. Both LSAT and LIAT of USAID were used after adapting to local conditions. In this process, some items out of the list were not assessed, and some items that were assessed were not included in the list. After the collection of data through LSAT and LIAT format, entered into a Microsoft Excel 2013 spread sheet. Figure shows six different programmes at all the three levels viz. state, district, and block levels. It also shows different components of each of the programme such as human resources, warehouse, product selection, procurement, transportation, and cold chain.
Figure 1. Supply chain levels with different functions.
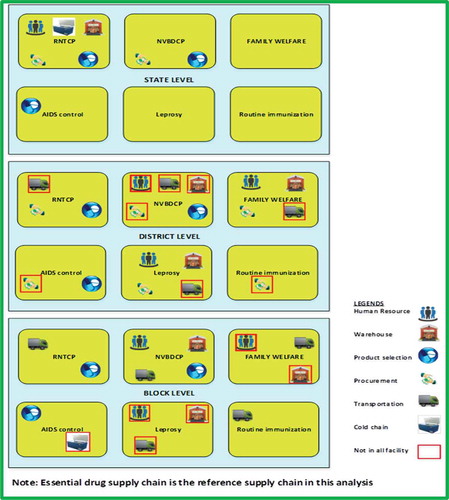
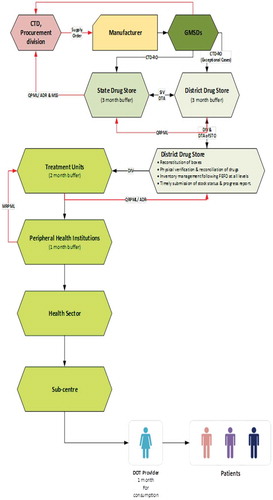
Figure explains how the supply chain works at different levels. Here, the RNTCP programme is illustrated for the purpose of explaining the different steps such as procurement, distribution at different levels from the state level stores to the patients at the sub-centre level after transported to district and block levels.
Figure 2. Supply chain for a specific programme- RNTCP.
2.1. Sample size calculation
For sample selection, multi-stage cluster random sampling was used (Please refer Figure ). A 12 countries study conducted during 2008 has concluded that LSAT was a reliable and valid tool for monitoring and evaluating supply chain performance under family planning programme (Karim, Bieze, & Chimnani, Citation2008; USAID | DELIVER PROJECT, Task Order 1, Citation2009).
Figure 3. Sample selection and data collection procedure in study area.
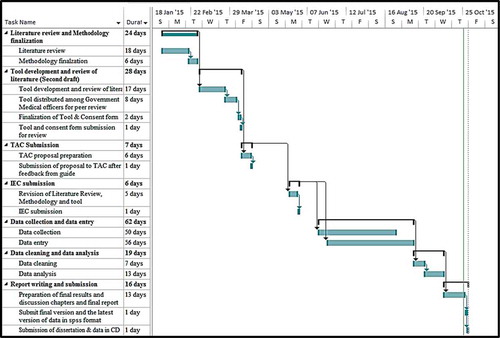
Statistically significant sample size is only required in case of LIAT to make generalized statement about a system. The final sample size calculated as 28 facilities (at 95% Confidence interval level) based on 50% facilities (please refer Figure ) having the expected level of performance, with an absolute precision of 20%, 372 numbers of facilities and design effect of 1.2 (Dean, Sullivan, & Soe, Citation2014; John Snow, Inc./DELIVER, Citation2005). Figure shows the Gantt Chart for the study.
Figure 4. Location map of Odisha showing the study districts and state headquarters.
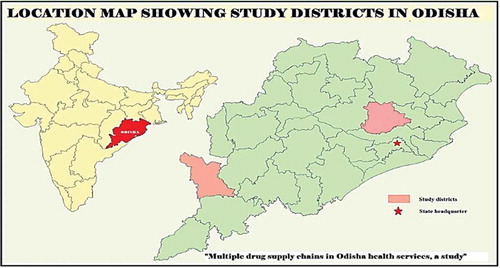
Figure 5. Gantt chart for the study.
2.2. Operationalization of terms used
Widely used terms for major SCs such as routine immunization, AIDS control, essential drugs, leprosy, National Vector Borne Disease Control Programme (NVBDCP), Revised National Tuberculosis Control Programme (RNTCP), Family Welfare for Universal Immunization Programme, National AIDS Control Programme, essential drug, National Leprosy Eradication Programme, Revised National Tuberculosis Control Programme, and family welfare supply chains, respectively, for ease of data collection.
2.3. LSAT analysis
LSAT data of each facility scored section wise as per the guideline of the tool and the responses/documents collected and added to the LIAT quantitative tool as one of the outcome variable.
In next step SC wise, section wise, and level wise situational analysis and strength, weakness, opportunity, threat (SWOT) analysis done on the basis of document collected and opinion of logistics managers. These analyses were summarized in a comparison table to find differences in performances. Finally this leads to predict the reason behind such differences and scope of improvement where possible.
SC wise process mapping flowchart prepared using Microsoft Visio Professional 2013 from situational analysis of LSAT tool, available documents. The output of such analysis discussed again with the logistics personnel at various levels and necessary corrections made where required.
2.4. LIAT analysis
Data on stock-out situation entered in a separate spread sheet (SC wise, facility wise, and level wise). Average days of stock out per product and percentage of product stock-out was calculated from those spread sheet. These two along with LSAT score entered in LIAT spread sheet as outcome variable.
2.5. Theory
2.5.1. LSAT analysis
LSAT data first segregated supply chain wise in a separate spread sheet. Then LSAT data of each facility scored section wise as per the guideline of the tool and the responses/documents collected at the facility. The total score of each facility added to the LIAT quantitative tool as one of the outcome variables. In next step supply chain wise, section wise, and level wise situational analysis were done with the help of collected documents and opinion of logistics managers on various aspects described in LSAT tool followed by a section-wise SWOT analysis of each supply chain. Then these situational analysis and SWOT analysis documents were summarized section wise and supply chain wise comparison table to compare the performances of each supply chain to find the reason behind such differences and possible scope for improvement. From this situational analysis based on LSAT tool, based on available documents, supply wise process mapping was done for drug and logistics and information flow using Microsoft Visio Professional 2013. The output of such analysis discussed again with the logistics personnel at various levels and updated.
2.6. LIAT analysis
Initially, data were collected on the stock-out situation and entered in a separate spread sheet in the following levels: Supply chain wise, facility wise, and level wise. The average days of stock out per product and percentage of product stock-out were calculated from those spread sheets. To elaborate more on these outcome variables, first, product wise number of days of stock-out of each product was listed during the last 6 months. Under each institution, separate supply chains were assessed in separate spread sheets. They were analysed for each supply chain and facility for the percentage stock-out for products in a point in time in the last 6 months were calculated. The above-mentioned outcome variables along with LSAT score were entered in LIAT spread sheet and designated as the outcome variables.
2.7. Analysis procedure
Univariate analysis, bivariate analysis of LIAT tool, and comparative SWOT analysis of LSAT are performed. Under bivariate analysis higher LSAT score, lower mean days of stock-out per product and the lower percentage of facilities facing more than 15% stock-out indicating a better performing supply chain were the outcome variables. The relations between three outcome variables were also explored. Later Odisha supply chains were analysed for its integration as discussed earlier
The supply chain wise univariate analysis was done for the percentage of stock-out of products; state-level personnel of each supply chain was consulted to know if there was any cut-off provided by the guideline, which was considered acceptable with respect to stock-out range. As there was no such a guideline, 15 cut-off was considered to be practically optimum for the analysis. If the stock-out is more than fifteen percentage it is considered to be high. This was used for cross-tabulation with independent variables. For analysis, Chi-square and Fisher’s-exact test were performed using SPSS (Version 21.0). While performing Chi-square when the cell values were less, then Fisher’s-exact value was performed. For LSAT score and average days of stock-out per product t-test or ANOVA (for the independent variables with the number of categories were more than two) were done with relevant logically linked independent variables. The mean value of the outcome variable in each category was interpreted in the light of significant levels.
2.8. Model development
Among the above-discussed models, Odisha supply chains found to follow product integration. This is because the literature shows individual supply chains strategically merged at various levels for various functional purposes. When one analyses the supply chains using supply chain integration model, Odisha supply chains were nearly an organized model, where rules, procedures, and responsibilities were defined but they were not properly coordinated.
2.9. Ethical approval and official permission
Ethical approval was obtained from the Institutional Ethical Committee of Sree Chitra Tirunal Institute for Medical Sciences and Technology, Thiruvananthapuram. (Reference No. SCT/IEC/750/JUNE-2015). Thereafter, permissions from relevant government authorities of various levels were obtained. An informed written consent from each respondent for interviewing and utilizing the data was taken before interview. Necessary steps were taken to maintain anonymity and confidentiality of the participants.
3. Results
3.1. Organizational variation of LSAT score and stock-out situation
3.1.1. General description
All study institutions had electricity, water, and telephone connectivity. Except for one block, all had connectivity by having all-weather roads. All the state level facilities were located in Bhubaneswar city (capital of Odisha state). District and sub-district level institutions were located in smaller towns and the block level community health centres were located in rural areas. KBK districts are considered as a region of backward area in terms of health indicators (Government of Odisha, Citation2015). KBK comprises of undivided districts of Koraput, Balangir, and Kalahandi (KBK) have since 1992–1993 been further divided into eight districts: Koraput, Malkangiri, Nabarangpur, Rayagada, Balangir, Subarnapur, Kalahandi, and Nuapada.
3.1.2. Region
Table shows mean days of stock-out per product (p = 0.160) and percentages of institutions facing stock-out of more than 15% of products (p = 0.004) was significantly lower at state headquarter and higher in KBK district. The mean LSAT score was significantly higher (p < 0.001) in state head quarter and lower in KBK district.
Table 1. Region wise comparative analysis of LSAT score and stock-out situation
3.1.3. City/town/village
Evidence showing mean days of stock-out (p = 0.006) and percentages of institutions facing stock-out of more than 15% of products (p = 0.032) was significantly higher at the facility levels in rural areas (village) and lower in those in the city areas. Arithmetic Mean for LSAT score followed significantly (p < 0.001) in opposite direction (Please refer Table ).
Table 2. City, town and village wise distribution of LSAT score and stock-out situation
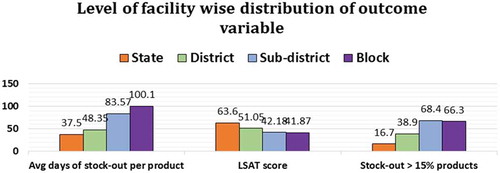
3.1.4. Level of facility
The lowest mean days of stock-out per product (p = 0.004) was at state headquarter and highest at the block level. The lowest percentages of institutions facing stock-out of more than 15% of products (p = 0.021) was at state headquarter and highest at sub-district level. The mean LSAT score was highest (p < 0.001) at the state level and lowest at the block level (Please refer Appendix A and Figure ). These differences in all cases were significant.
Figure 6. Level of facility wise distribution of LSAT score and stock-out situation.
3.1.5. Type of facility
Two types of facilities were studied. One was the warehouse, where the products were stored and inventory was managed and other was service delivery points. In service delivery points, beneficiaries, or patients were provided services using these products. Mean days of stock-out per product (p = 0.119) and percentages of facilities facing stock-out of more than 15% products (p = 0.653) was higher in warehouses in comparison to service delivery points. Arithmetic Mean for LSAT score was significantly highest at warehouses and lowest at service delivery points (p = 0.039). This was because warehouses are always at a higher level than service delivery point with high LSAT score.
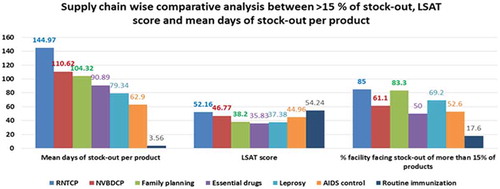
3.1.6. Supply chain
Figure represents a comparative analysis LSAT score and the stock-out situation with respect to seven different supply chains. Mean days of stock-out per product (p < 0.001) and percentages of facilities facing stock-out of more than fifteen percentage products (p = 0.001) was significantly highest in Revised National Tuberculosis Control Programme (RNTCP) and lowest in routine immunization. Rest all supply chains were within these limits. The mean LSAT score was significantly higher (p < 0.001) for RNTCP and routine immunization and lower for essential drugs.
Figure 7. Supply chain wise comparative analyses of outcome variables.
3.2. Organization and staffing
The organizational structures of different supply chains and its effect on organizational policies at the local market level are another dimension to supply chain. Leprosy programme did not have logistics management unit at any level. Rest all supply chains had their logistics management unit up to district level except for RNTCP and in AIDS control supply chain at the district which was not a DAPCU district (The districts with a high prevalence of HIV were classified as DAPCU districts) districts where they had only at state level. The government had the policy to promote small and medium enterprises (SME) by giving preferences in government purchases with an order number 14741 dated 6 May 2014. State Health Department had a list of 20 items to be purchased through these procedures, which included essential drugs and National Vector Borne Diseases Control Programme (NVBDCP) drug supply chains. However, state health department increased the turnover amount of the SME from Rs. 10 lakhs (1 Million) to Rs. 10 crores (100 Million) as a prequalification criterion for purchase was a contradiction to the above-mentioned order with no proper justification. Later, the department had to give an explanation from the government by a letter bearing number 2076 dated 13 March 2015.
4. Discussion
Region wise mean days of stock-out per product and proportion of facility facing more than 15% stock-out were higher and mean LSAT score was lower in KBK districts. In general KBK regions were most deprived on various fronts confirms the findings that they had a minimum availability of drugs (Government of Odisha, Citation2015). The similar problem has existed in lower level facilities of rural areas. This causes poor provisioning of drugs to the majority of the population in the state and this ultimately contributes to out of pocket expenditure on health (Government of Odisha, Citation2015; MOHFW, GOI, Citation2015). This study reported RNTCP, NVBDCP, family welfare, and essential drugs supply chains were showing higher stock-out, in conformity with the findings of study reporting stock-out of RNTCP and NVBDCP drugs in Darbhanga (Roy et al., Citation2009) and NVBDCP and essential drugs in Odisha (Hussain et al., Citation2013; Mohanty & Chakravarty, Citation2013). The present study reported lowest stock-out of vaccines with mean days of stock-out of 3.5 in three institutions out of 17 immunization facility assessed contrary to the finding of VMAT study that reports stock out of BCG in some institutions and DPT in the entire state of Odisha (UNICEF, Odisha, Citation2007). Vaccine supply chain is the most organized supply chain in Uttarakhand (Bausell, Bem, Chimnani, & Stone, Citation2014), a finding in conformation with this study. As reported in findings, small-scale industries challenged the government decision of increasing turnover amount as prequalification criteria and stall away from the procurement process for at least four years, which affected the peripheral institutions. This was a non-operational factor that affected the supply chain (Kundu, Citation2014; Orissa, High court, Citation2010).
4.1. The strength of the study
All major supply chains studied at all levels.
Only among a few studies conducted in India.
4.2. Limitations of the study
Administrators and other stakeholders such as suppliers, political body general public are not considered in this study.
Only stock-out and system performances are assessed.
4.3. Competing interests
Authors have no competing interests.
5. Conclusions
From the present study, it is clear that the operational issues related to supply chain in public health were not addressed properly by the authorities in the health system. This could be addressed by integrating different drug supply chains in the state of Odhisha. When we looked for integration, we found there was partial integration of supply chain in Odisha. Another important aspect found by the study is the stock-out situation, in general, was not satisfactory. This affected the national programs in addition to routine health service provision. Another process-based factor that affected the drug supply chain is the differences in reporting and record maintenance systems. They have an adverse effect on the drug supply chain. Government need to act fast to address the above-mentioned issues to improve the drug supply chain in the state of Odisha.
The author statement
Prof. Srinivasan Kannan, the corresponding author is a Professor of Public Health, teaches and do research in the area of Health Management. He teaches and supervises research of MPH and Ph.D. students. The first author, Dr. Sambit Kumar Behera, is a Public health practitioner and was a student of MPH. The present paper on ‘Multiple drug supply chain management of Odisha’s health services’ is an important contribution to public health management. With the expertise in health management, both authors explored the area of supply chain management in healthcare that will improve the services and save money for the exchequer. In general management aspects of public health are not given much of importance in the published journal articles because of the domination of epidemiological approaches to public health.
Acknowledgements
Authors would like to thank Department of Health Services, Government of Odisha, the officials of Health Services, Odisha and all who have contributed to data collection.
Additional information
Funding
Notes on contributors
Sambit Kumar Behera
Sambit Kumar Behera was a student of Master of Public Health at Achutha Menon Centre for Health Science Studies, Sree Chitra Tirunal Institute for Medical Sciences and Technology, Thiruvananthapuram, Kerala, India. He is presently working with Department of Health Services, Government of Odisha.
Srinivasan Kannan
Srinivasan Kannan is a Professor at Achutha Menon Centre for Health Science Studies, Sree Chitra Tirunal Institute for Medical Sciences and Technology, Thiruvananthapuram, Kerala, India.
Related Research Data
References
- Allain, L., Goentzel, J., Bates, J., & Durgavich, J. (2010). Reengineering public health supply chains for improved performance: Guide for applying supply chain segmentation framework. Arlington, VA: USAID | DELIVER PROJECT, Task Order 1.
- Amo-Adjei, J., Kumi-Kyereme, A., Amo, H. F., & Awusabo-Asare, K. (2014). The politics of tuberculosis and HIV service integration in Ghana. Social Science & Medicine, 117, 42–49. doi:10.1016/j.socscimed.2014.07.008
- Bausell, L., Bem, J., Chimnani, J., & Stone, M. (2014). India landscape analysis of RMNCH+A supply chains Himachal Pradesh, Punjab and Uttarakhand [WWW Document]. Retrived from https://www.jsi.com/JSIInternet/Inc/Common/_download_pub.cfm?id=15498&lid=3 (accessed 5.8.18)
- Bertolini, M., Bevilacqua, M., Ciarapica, F. E., & Postacchini, L. (2015). Business process reengineering of drugs storage and distribution: A case study. International Journal of Procurement Management, 8(1/2), 44–65. doi:10.1504/IJPM.2015.066287
- Bigliardi, B., & Bottani, E. (2014). Supply chain performance measurement: A literature review and pilot study among Italian manufacturing companies. International Journal of Engineering, Science and Technology, 6(3), 1–16. doi:10.4314/ijest.v6i3.1S
- Bornbusch, A., & Bates, J. (2013). Multiplicity in public health supply systems: A learning agenda. Global Health: Science and Practice, 1(2), 154–159.
- Bottani, E., & Bigliardi, B. (2014). Supply chain performance measurement: A literature review and pilot study among Italian manufacturing companies. International Journal of Engineering, Science and Technology, 6, 1–16. doi:10.4314/ijest.v6i3.1S
- Chukwu, O. A., Ezeanochikwa, V. N., & Eya, B. E. (2017). Supply chain management of health commodities for reducing global disease burden. Research in Social and Administrative Pharmacy, 13, 871–874. doi:10.1016/j.sapharm.2016.08.008
- Dean, A. G., Sullivan, K. M., & Soe, M. M. (2014). OpenEpi: Open source epidemiologic statistics for public health. Atlanta, GA, USA. Retrieved from www.OpenEpi.com
- Gilbert, S. S., Thakare, N., Ramanujapuram, A., & Akkihal, A. (2017). Assessing stability and performance of a digitally enabled supply chain: Retrospective of a pilot in Uttar Pradesh, India. Vaccine, Building Next Generation Immunization Supply Chains, 35, 2203–2208. doi:10.1016/j.vaccine.2016.11.101
- Global Healthcare Exchange. (2011). Applying supply chain best practices from other industries to healthcare: A GHX white paper for healthcare executives. Louisville: Global Healthcare Exchange, LLC.
- Government of Odisha. 2015. Land and people, Odisha profile. Retrieved October 12, 2015, from http://www.odisha.gov.in/portal/ViewDetails.asp?vchglinkid=GL012&vchplinkid=PL051
- Gunasekaran, A., Patel, C., & McGaughey, R. E. (2004). A framework for supply chain performance measurement. International Journal of Production Economics, 87(3), 333–347. doi:10.1016/j.ijpe.2003.08.003
- Health and family welfare department, GoO. (2003b). Orissa vision 2010-a health strategy, Orissa state integrated health policy, strategies and action points. Bhubaneswar: Health and family welfare department, Govt. of Orissa.
- Health and family welfare department, GoO. (2013a). Outcome budget 2012-2013. Bhubaneswar: Health and family welfare department, Govt. of Odisha.
- Health and family welfare department, GoO. (2013b). Setting up of the “Odisha state medical corporation” for implementation of “Free medicine distribution scheme” Gazette notification. Health and family welfare department, Govt. of Odisha.
- Himachal Pradesh, Punjab, and Uttarakhand. USAID | DELIVER PROJECT, Task Order 4. Retrieved December 8, 2017, from http://www.jsi.com/JSIInternet/Inc/Common/_download_pub.cfm?id=15498&lid=3
- Hussain, M. A., Dandona, L., & Schellenberg, D. (2013). Public health system readiness to treat malaria in Odisha State of India. Malaria Journal, 12(1), 1–11. doi:10.1186/1475-2875-12-1
- Iannone, R., Lambiase, A., Miranda, S., Riemma, S., & Sarno, D. (2013). Modelling hospital materials management processes. International Journal of Engineering Business Management, 5, 1–12. doi:10.5772/56607
- John Snow, Inc. (2012). Getting products to people: The JSI framework for integrated supply chain management in public health. Arlington, VA: Author.
- John Snow, Inc./DELIVER. (2005). Logistics indicators assessment tool (LIAT). Arlington, VA: Author.
- Karim, M. A., Bieze, B., Chimnani, J. 2008. ‘Measuring family planning logistics system performance in developing countries: Working paper.’ Arlington, VA: USAID | DELIVER PROJECT, Task Order 1.
- KBK, Government of Odisha. (2015). KBK districts: A unique approach towards development. Retrieved April 12, 2015, from http://www.kbk.nic.in/pdf/KBKProfile.pdf
- Khlie, K., & Abouabdellah, A., 2017. Integrating lean and six sigma for the securement of the medication circuit, in: 2017 international colloquium on logistics and supply chain management (LOGISTIQUA). In: Presented at the 2017 International Colloquium on Logistics and Supply Chain Management (LOGISTIQUA), pp. 148–153, Rabat, Morocco. doi:10.1109/LOGISTIQUA.2017.7962889
- Kumar, A., & Ozdamar, L. (2004). Business Process re-engineering at the hospitals: A case study at Singapore hospital. In: Networked simulations and simulated networks. 18th European Simulation Multi conference (ed Graham Horton), Magdeburg, Germany, June 13–16, pp. 308–317. Germany: SCS Publishing House.
- Kundu, S. (2014). Health sector reforms in Orissa and its implications for the health services ( PhD thesis). Delhi: Jawaharlal Nehru University.
- Laeiddee, C. (2010) Improvement of re-order point for drug inventory management at Ramathibodi Hospital ( PhD Thesis). Mahidol University, Thailand.
- Lee, T., & Nam, H. (2016). An empirical study on the impact of individual and organizational supply chain orientation on supply chain management. The Asian Journal of Shipping and Logistics, 32, 249–255. doi:10.1016/j.ajsl.2016.12.009
- Magak, A. A. (2014). Effects of management of supply chain on performance of public health institutions in Migori County in Kenya. Interdisciplinary Journal of Contemporary Research in Business, 5(11), 82–104.
- McCord, J., & Olson, N. (2011). Supply chain evolution: Introduction to a framework for supply chain strengthening of developing country public health programs. Arlington, VA: USAID | DELIVER PROJECT, Task Order 4.
- Mohanty, A., & Chakravarty, N. (2013). An epidemiological study of common drugs in the health supply chain: Where does the compass point? Journal of Humanitarian Logistics and Supply Chain Management, 3(1), 52–64. doi:10.1108/20426741311328510
- MOHFW, GOI. (2009). National health accounts India, National health accounts cell, Ministry of health and family welfare, Government of India (In collaboration with WHO India Country Office). Retrieved from http://www.planningcommission.nic.in/reports/genrep/health/National_Health_Account_04_05.pdf
- MOHFW, GOI. (2015). Rural health statistics 2015. Ministry of health and family welfare, Government of India. Retrieved October 12, 2015, from https://nrhm-mis.nic.in/Pages/RHS2015.aspx?RootFolder=%2FRURAL%20HEALTH%20STATISTICS%2F(A)RHS%20-%202015&FolderCTID=&View=%7BC50BC181-07BB-4F78-BE6F-FCE916B64253%7D
- Orissa, High court. (2010). Utkal pharmaceuticals manufacturers association vs. state of Orissa & others on 20 December. W.P. (C) No.18496 of 2009. Retrieved October 8, 2015, from http://indiankanoon.org/doc/159951745/
- Pinna, R., Carrus, P. P., & Marras, F. (2014). The drug logistics between efficiency and safety for patients: The experience of an Italian region. In 17th Toulon-Verona (ICQSS) International Conference “Excellence in Services”, (pp. 291–306). 28–29 August 2014. Liverpool, England: Liverpool John Moores University.
- Roy, C., Das, J. K., Jha, H. K., Bhattacharya, V., Shivdasani, J. P., & Nandan, D. (2009). Logistics and supply management system of drugs at different levels in Darbhanga District of Bihar. Indian Journal Public Health, 53, 147–150.
- Singh, P. V., Tatambhotla, A., Kalvakuntla, R., & Chokshi, M. (2013). Understanding public drug procurement in India: A comparative qualitative study of five Indian states. BMJ Open, 3(2), e001987. doi:10.1136/bmjopen-2012-001987
- UNICEF, Odisha. (2007). Assessment cum training of vaccine and cold chain management in Orissa- A VMAT Study. India: UNICEF.
- USAID. (2011a). Family Planning and HIV Integration Profile: Malawi. K4Health. Baltimore, USA.
- USAID. (2011b). Family planning and HIV integration profile: Nigeria. K4Health. Baltimore, USA.
- USAID. (2011c). Family planning and HIV integration profile: Rwanda. K4Health. Baltimore, USA.
- USAID. (2011d). Family planning and HIV integration profile: Uganda. K4Health. Baltimore, USA.
- USAID | DELIVER PROJECT, Task Order 1. (2009). Logistics system assessment tool (LSAT). Arlington, VA: Author.
- USAID | DELIVER PROJECT, Task Order 1. (2009a). Putting integration into perspective: Proven practices to strengthen public health supply chains. Arlington, VA: Author.
- Yadav, P., Lydon, P., Oswald, J., Dicko, M., & Zaffran, M. (2014). Integration of vaccine supply chains with other health commodity supply chains: A framework for decision making. Vaccine, 32, 6725–6732. doi:10.1016/j.vaccine.2014.10.001
Appendix A
Appendix A1. Bivariate analysis table
Appendix A2. Association between LSAT score and independent variables
Appendix A3. Association between more than 15% product stock-out and independent variables