
 ?Mathematical formulae have been encoded as MathML and are displayed in this HTML version using MathJax in order to improve their display. Uncheck the box to turn MathJax off. This feature requires Javascript. Click on a formula to zoom.
Abstract
The paper considers conceptual, methodical, and practical aspects of the target financial forecasting at the micro level, i.e. the company level, as a new instrument of anticrisis financial management for a company to overcome its financial difficulties and enhance its financial position within a time-period of practically any length. The methodology of the research, the results being presented in the paper, is based on the concept of the financial ratio analysis, the concept of the company cash flows, and the concept of the Balanced Scorecard (in terms of its financial score). It is depicted that the procedure of the target financial forecasting comprises an appropriate information-accounting support, a target financial forecasting of the company financial position, a target forecasting of the company’s cash flows, a development of the specific events (managements’ decisions) aimed at overcoming the company’s financial difficulties and enhancing its financial position. The author has stated that in the present-day environment the target financial forecasting is an effective instrument of the financial forecasting that enables to set up the base for overcoming the company’s financial difficulties and strengthening its financial position. The major fields of the target financial forecasting application are an anticrisis bankrupt company management, a management of the company at the verge of its bankruptcy, as well as a company’s investment appeal enhancement (in terms of its financial aspect).
Public Interest Statement
This paper is devoted to the conceptual, methodical, and practical aspects of the target financial forecasting at the level of a company. The target financial forecasting is a new instrument of the anticrisis financial management aimed at overcoming the company’s financial difficulties and enhancing its financial position within a time-period of practically any length. The methodology is based on the concept of the financial ratio analysis, the concept of the company cash (fund) flows, and the concept of the Balanced Scorecard (in terms of its financial score). The procedure of the target financial forecasting comprises an appropriate informational-accounting support, the target financial forecasting of the company financial position, the target forecasting of the company’s cash flows, a development of the specific events (management’s decisions) aimed at overcoming the company’s financial difficulties and enhancing its financial position. The major fields of the target financial forecasting application are an anticrisis company management, as well as the company’s investment appeal enhancement (in terms of its financial aspect).
1. Introduction
The idea of the target financial forecasting as an instrument to improve company financial health has been created by the author of the present article. The results of the first empirical study of the problem bearing predominantly theoretical nature were presented in a rather brief paper and published six years ago (Krylov, Citation2015). Since then the idea of the target financial forecasting has been developed in the further authors’ publications (e.g., Krylov, Citation2015) relevant to the strategic financial management of the company performance basing on the financial score of the Balanced Scorecard.
The present article is some kind of the outcome of the author’s research of the target financial forecasting at the level of a company. The article considers both its theoretical-methodical basis and applied and practical aspects highlighting the target financial forecasting applicability as the instrument of the anticrisis financial management.
The anticrisis financial management is assumed as a complex of measures based on the appropriate cash flows and aimed at the diagnostics of the company’s financial difficulties and strengthening its unhealthy financial position. Each cash flows improving the company’s financial position entails one or a few specific management’s decisions.
“Unhealthy (crisis) financial position” concept of the company bears a certain degree of uncertainty as its financial difficulties may differ in consequences. The company is considered to be technically insolvent in case it is unable to meet its current liabilities; meanwhile, the insolvency may be temporary and can be eliminated. Thus, the insolvency implies a lack of funds. On the other hand, the insolvency, in case of the company bankruptcy, implies that its liabilities outstrip the assets, i.e. either the company owners’ equity is insufficient or the balance liquidity is too weak due to its unsatisfactory structure. The financial difficulties concept also comprises all the range of intermediate situations falling between the margins. The company faces with financial difficulties due to:
insufficient attention to the market demand (for the products choice, quality, price, etc.);
unsatisfactory financial company management (risks management failure, excessive financial obligations, etc.).
The first reason is considered as some kind of the unhealthy company business while the second one is taken as the unduly company financial management.
The diagnostics of the financial difficulties or the financial diagnostics is based on the results of the company financial position analysis. It is exercised with the company’s key financial ratio values that enable to evaluate its financial resources position and economic implications resulting from their management decisions implementation. The diagnostics is focused on the solvency and financial health maintenance as well as the advanced reveal of the company’s financial performance difficulties. In order to manage effectively the company’s cash flows with a view to overcome its financial difficulties and improve its financial position indicators and the financial ratios as well, a target financial planning and, as a consequence, target financial forecasting are employed as the forecasting having been evaluated and accepted can be taken as the major assumption in planning.
In this connection, the research of theoretical, methodical, and practical aspects of the target company financial performance forecasting with the financial ratio values comprising synthesized information of the company financial position is of special importance.
Meanwhile, the present-day financial management theory and practice have developed a number of company financial performance forecast techniques; some of them basing on the financial ratios. Referred to them are budgeting, percentage of revenues technique, and economic-mathematical technique described in quite a few relevant articles (e.g. Block, Hirt & Danielsen, Citation2011; Bernstein, Citation1993; Brealey, Mayers, & Allien, Citation2017; Brigham, Citation1983; Brooks, Citation2014; Helfert, Citation1994, Citation2001; Lee & Finnerty, Citation1990; McLaney, Citation1992; Van Horne, Citation1989). However, the techniques described are labor-consuming, dependent on the sales forecast and insufficiently accurate. In addition, the applications of the financial forecast technique proposed are primarily designed to be applied within the healthy company performance conditions experiencing neither financial difficulties nor the need to develop any anticrisis events.
Generally speaking, the author considers critical to develop a new method that enables to exercise the target financial forecasting within anticrisis company financial management with the key financial ratios bearing no drawbacks mentioned, i.e. sufficiently accurate, non-tedious, and applicable for any type of entity. In addition, to improve both the target financial forecasting efficiency and to form its information-analytical support the procedures are worth incorporating.
2. Financial forecasting at the level of a company (present-day state of the problem)
In the present-day environment, the financial forecasting at the level of the company, i.e. at the micro level, presumes an application of the well-known techniques described in the relevant references on the financial accounting analysis, financial analysis, and financial management (Bernstein, Citation1993; Bernstein, Wild, & Subramanyam, Citation2001; Block, Hirt & Danielsen, Citation2011; Brealey et al., Citation2017; Brigham, Citation1983; Brigham & Houston, Citation2015; Brooks, Citation2014; Helfert, Citation1994; Citation2001; Higgins, Koski, & Mitton, Citation2016; Knot, Citation1985; McLaney, Citation1992; Lee & Finnerty, Citation1990; Makridakis & et al., Citation1998; Penman, Citation2004; Pocock & Taylor, Citation1988; Subramanyam, Citation2014; Van Horne, Citation1989; Van Horne & Wachowicz, Citation2009; Watsham & Parramore, Citation2004, et al.) such as budgeting, percentage of revenues technique, and so-called economic-mathematical technique incorporating mathematical processing methods of time, space, and time-spatial aggregate. In budgeting, percentage of revenues technique are utilized as short-term financial forecasting instruments, and the economic-mathematical technique is treated as the instrument for the middle-term and long-term financial forecasting.
Consider briefly the financial forecasting technique at the micro level mentioned.
The budgeting as the instrument of the financial forecasting presumes a calculation of a few options of the overall company budget for the period to come and a selection, by the comparative analysis, of the most optimum one for further implementation as the financial target.
As a rule, the total (main) budget of the company comprises two basic elements: target budget and financial budget. The target budget is composed of the sales forecast (sales target), the production target with the cost estimates, and the income statement forecast. The financial budget consists of the cash flow budget, capital investments budget, and the leading balance sheet.
The block-scheme of the company budgeting is presented in Figure .
Preparation of the sales forecast. The sales are forecast for all product range both in value and sales volume basing on the firm contracts, marketing analysis, break-even point analysis, and the company production capacity. The company crediting policy for the time-period to come is defined as well as the monthly net sales are determined.
Development of the production plan and costs estimation. The production plan is developed by the sales volume forecast taking into account the finished goods inventories at beginning of the forecast period and the finished goods stock to be transferred to the coming time-period. The production plan is the basis for the estimation of the direct material and labor costs, indirect costs followed by the forecasting of the manufactured goods cost and the cost of the goods sold. The raw materials and other supply are determined as well as the monthly payments schedule dealing with the company core activity is developed.
Figure 1. The block-scheme of the company budgeting.
3. Calculation of cash flow and capital investments budgets.
The cash flow budget of the company is calculated by the monthly basis and includes four sections as follows:
the section of cash inflow comprising a cash balance at beginning of the forecast time-period, cash income from customers, and other cash inflow;
the section of cash outflow including total cash payments scheduled for the forecast time-period;
the section of surplus or deficit cash demonstrating the difference between the first and second sections and containing the cash balance at end of the forecast time-period;
the financial section anticipating the cash deficit offset (a negative outcome of the third section) by various external funding sources (loans, borrowings, issuance of the company’s securities).
If a company presumes an investment activity in the nearest future, it forms a capital investment budget reflecting the lead of the long-term capital investments and defining the source of funding of the company’s long-term investments.
4. The Income Statement forecasting. The Income Statement forecast is calculated with the sales forecast and production cost taking into account other company’s operations income and costs as well as the external funding sources servicing. The calculation defines anticipated tax payments, to be paid in the coming time-period and entered correspondingly in the second section of the cash flow budget. Thereby it is critical to interlink cash and cash equivalents budget and the Income Statement forecast.
5. The Balance Sheet forecasting. The Balance Sheet forecast is developed by the balance sheet items correctness for the previous (reported) period taking into account all the data forecast having been obtained during the previous budgeting stages.
The budgeting is the most accurate and detailed technique of the financial forecasting of the company performance. However, the technique is labor-consuming and is generally employed by large and middle-sized companies operating computerized financial forecasting.
Percentage of revenues technique, simple and succinct, entails the advanced assessment of coming costs, assets and liabilities in the form of the percentage of revenues for the time-period to come. Later, the obtained data, expressed in percent, are utilized to develop the Balance Sheet forecast.
The sequence of the Balance Sheet forecasting under the percentage of revenues technique is exercised as follows:
The variable costs, current assets, and short-term liabilities are improved by the same percentage of the revenues growth. Thereby, for the time-period forecast the current assets and current liabilities will amount to the preceding percentage of revenues.
The growth of the percentage of the fixed assets cost is estimated for the specified percentage of revenues improvement taking into account production methods and idling or partially idling production facilities at beginning of the forecast time-period, as well as their depreciation level, etc.
The rest of the intangible assets (i.e. the fixed assets excluded) remain unchanged for the forecast.
The long-term liabilities are forecast as they are.
All the elements of the owners’ equity, other than the retained earnings, are considered as unchanged for the forecast.
The retained earnings are forecast with the forecast gross profit margin and the dividend payout ratio taken into account:
where REE* is retained earnings at end of the forecast time-period,
REB is retained earnings at beginning of the forecast time-period,
FR* is forecast revenues,
Fgm* is forecast Gross Profit Margin (net earnings/revenues ratio),
FD * is forecast Dividend payout ratio (dividend/net earnings ratio).
7. The calculation having been completed, we have to figure out the amount of necessary liabilities to cover the assets, thus defining the amount of additional external funding (AEF) to be calculated by two methods:
7.1. Basing on the previous calculation:
where ΣFA* is sum of the forecast assets,
ΣFL* is sum of the forecast liabilities (retained earnings included);
7.2. By means of the formula:
where AIR is required assets increase,
RLI is random liabilities growth,
REI is retained earnings increase,
RА is reported period assets tied to revenues in percentage terms,
RL is reported period liabilities tied to revenues in percentage terms,
RR is revenues for the reported period,
FR * is forecast revenues,
Fgm * is forecast gross profit margin (net earnings/revenues ratio),
FD * is forecast dividend payout ratio (dividend/net earnings ratio),
△CR is revenues change (FR *–RR).
The equality of the results obtained by means of the formulae (2) and (3) can be considered as an indirect evidence of the previous computations validity.
The main advantage of the percentage of revenues technique is that it is simpler and less expensive when applied. However, the technique implies that the company operates at full capacity and lacks inner provisions to ensure the target sales volume and causes the company to raise extra external funding. It should be noted that one ought to be cautious when applying the technique if the company possesses such provisions. Overall, it is less accurate than the previous one; meanwhile, it enables to obtain sufficiently reliable results to be applicable mostly for small and middle-size business.
The economic-mathematical technique of the financial forecasting is based on the application of the mathematical methods to process time, space, and time-spatial aggregates. The techniques are fundamental in terms of the formalized forecasting that enables to vary the complexity of the algorithms applied. A selection of the technique depends on the variety of factors, the initial data being available.
The first situation – the time set availability – is frequent in practice: the indicator dynamics data for the acceptable forecast are available for a financial analyst or a financial manager to single the trend out. Various discrete financial ratios for a certain time-period may be referred to such indicators. Thereby we obtain a dependence of the financial ratio values on the time factor, set by the table, the dependence to be processed by means of special mathematical methods (elementary dynamic analysis, autoregression dependence analysis, etc.) and further extrapolated into the future, so as the appropriate forecast is provided for various time-periods.
The second situation – the spatial integrity availability – appears to arise in those cases when the indicator statistics are not either available or the indicator value is believed to be influenced by certain factors. The multifactor regression analysis is appropriate for the case. The qualitative analysis results in the identification of the factors making an impact on the forecast indicator variation (e.g. a certain financial ratio). The linear regression equation is most frequently constructed.
The third situation – the time-spatial aggregate availability – occurs when the dynamics sets are not sufficient to make the statistically acceptable forecasts, the influence of the factors different in the economic nature and their dynamics to be taken into account. The initial data encompass the indicator matrixes (e.g. financial ratios) each presenting the same indicators values (financial ratios) for different time-periods. The processing techniques of the aggregates comprise a parameter averaging of the year regression equations, time-periods of company statistics, and covariation analysis.
All the ingredients of the economic-mathematical technique of the financial forecasting to be executed imply an application of the complex mathematical models and powerful software for processing. It is the mainframe computer that is to be used for the purpose. In addition, a lot of statistics is needed for the case.
Having completed the brief overview of the present-day methodical instruments for the financial forecasting at the micro level we consider the methodology of the present research.
3. Methodology of research
The methodology of the research, the results being presented in the paper, is based on the three concepts as follows:
1. A concept of the financial ratio analysis.
2. A concept of the company cash (fund) flows.
3. A concept of the Balanced Scorecard (in terms of its financial scores).
Consider briefly each of them.
3.1. A concept of the financial ratios analysis
At present, the financial ratios analysis is considered as one of the basic instruments of the financial position and financial analysis.
Each financial ratio is a relative indicator featuring an aspect of the financial position and estimated as a ratio of one accounting indicator to another one or a relationship of two qualitative financial characteristics.
There are more than a hundred financial ratios. Many of them complement, adjust, or correlate each other although they bear different names but the same accounting technique and vice versa, the same names but different accounting technique. There exist a group of so called key financial ratios utilized to develop normal (recommended, standard) values facilitating qualitative evaluation of the company’s financial position (Krylov, Citation2012).
A qualified and experienced financial analyst is able to perceive a more complete understanding of the company’s financial position by the financial ratios analysis and interpretation rather than analyzing the characteristics in question separately (Van Horne, Citation1989; Horne & Wachowicz, Citation2009).
The interpretation of the financial ratios is related to the analyst’s position and perspective. The financial ratios are employed by various users, such as bankers, shareholders, shareowners, and managers. While assessing and interpreting specific values of the financial ratios, we ought to be well aware of the targets and perspectives (Lee & Finnety, Citation1990).
The financial ratios are the instruments of the analysis that enable for the analyst to reveal the symptoms of the basic conditions. In addition, the correctly interpreted financial ratios can identify the areas to be carefully researched. The financial ratios analysis can bring out the conditions and trends uncovered by considering individual elements of financial ratio. The financial ratios in themselves are of little importance; they are to be interpreted by comparing them with the previous financial ratios of the same company, with the benchmarked standards or with the financial ratios of other companies in the industry (Bernstein, Citation1993; Bernstein et al., Citation2001).
The financial ratios serve as a convenient means of generalizing an immense amount of financial data and an instrument of the comparative analysis of the company performance (Brealy, Mayers & Allien, Citation2017).
Meanwhile, an actual usefulness of every specific financial ratio is strictly stipulated by the special analysis targets. Moreover, financial ratios are not absolute criteria. The significant financial ratios are utilized to reveal changes in the company financial position and performance and to illustrate the trends and nature of the changes. They can also bring out the risks and opportunities for the company in research. It should be noted that the business evaluation by means of the financial statements is based on the data for the previous period and shows the company performance for the past time-periods. The extrapolation of the obtained results into the future presents some difficulties. Still, the decisions taken by the results of the financial analysis can make an impact only on the future, as the past has already gone and become sunk costs (Helfert, Citation1994, Citation2001).
Thus the application of the financial ratios to analyze a company financial position and exercise a financial analysis is essential as they enable:
to reveal the company development trends by analyzing dynamics of its financial ratios values;
to ascertain companies having a higher degree of the financial risk and probability of bankruptcy, to determine strengths and weaknesses of the company operation by comparing actual values of the financial ratios and standard (recommended) ones;
to define the most attractive company to be invested in by comparing interbusiness financial ratios values;
to forecast the company financial results and financial position.
The main groups of the financial ratios are specified to feature such aspects of the company financial position as property, plant and equipment, financial stability, solvency and liquid assets, resources intensity, operation and resources efficiency, stock exchange position (for public companies).
The concept of the company cash (fund) flows. The cash flows, sometimes called fund flows (Helfert, Citation1994, Citation2001), reflect the flow of the company assets, liabilities, and owners’ equity within a certain time-period. They are treated as some kind of a link between the company financial position at the period beginning and end, defining the transformation courses from one financial position to the other and attracting the researchers’ interest.
According to the author of the present article, the fund flows, i.e. the company financial resources flows in a wider sense, presume cash flows, other assets flows (expressed in value), flows of sources of funding (liabilities), financial results (earnings, expenses, taxes). To put it differently, the concept of the “fund flow” has got a much broader meaning than the concept of the “cash flow”. The integrity of the company fund flow reflects the company operations turnover expressed in value. However, it should be noted that a number of researchers (Bernstein, Citation1993; Bernstein et al., Citation2001; Subramanyam, Citation2014; Van Horne, Citation1989; Van Horne & Wachowicz, Citation2009) identify fund flows as cash flows.
The company fund flows, as the company financial resources flow and the reflection of the company operations turnover expressed in value, respectively, can be assumed as a developing system, comprising three interlinked subsystems:
fund flows related to the company day-to-day (core) activity;
fund flows dealing with company investment activity;
fund flows involved in the company financial activity.
The first subsystem, i.e. the fund flows related to the company day-to-day (core) activity, is assumed as the main subsystem; the second one, i.e. the fund flows dealing with the company investment activity is taken as an auxiliary one; and the third – the fund flows involved in the company financial activity is treated as a support subsystem.
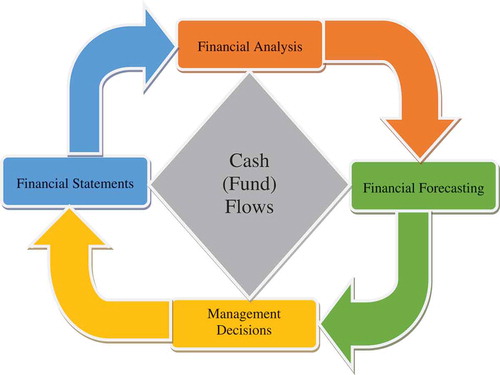
By integrating the fund flow subsystems caused by the company core, investment, and financial activities and interrelating all the fund inflows and outflows, the cycle of the company financial resources flow is obtained. The servicing cycle of the current assets forms a foundation of the procedure. The cycle of the financial resources flows of any company can be generalized by the model
of its fund (cash) flows presented in Figure , frequently found in some form in the relevant references on the cash flow statement analysis, financial analysis, and financial management (Bernstein, Citation1993; Bernstein et al., Citation2001; Brigham, Citation1983; Brigham & Houston, Citation2015; Higgins et al., Citation2016; McLaney, Citation1992; Van Horne, Citation1989; Van Horne & Wachowicz, Citation2009).
Figure 2. Model of company cash (fund) flows.
Obviously, there is no any starting or end point for an operating company: its financial resources present a continued process. The end product is formed by an aggregate of the material costs, fixed assets and labor costs that result in cash outflow. The products are later sold either against cash or credit. The credit sales entail accounts receivable end up in cashing. If the net sales (the sales volume expressed in value) exceed overall costs (depreciation of appropriate assets) (included) for a certain time-period the profit occurs, if not – the losses.
The volume of Cash and Cash Equivalents (the central point of the Figure), as a rule, fluctuates depending on the production schedule, sales volume, cashed Accounts Receivable, capital expenditure, and financing.
The Raw Materials and Supplies in Stock, Work in Process, Finished Goods in Stock, Accounts Receivable, Accounts Payable, on the other hand, fluctuation depends upon the Goods Sales, Production schedule and the company policy towards its key accounts, Stocks and Accounts Payable. It is taken for granted that an arrangement of both finance and cash flows management is the first and foremost task of the company management. The thing is that the cash inflow and outflow are interlinked. A deficit in one of the elements will affect the overall system. The Goods Sales discontinued affect the vital procedure of the Finished Goods conversion into Cash and Accounts Receivable, which, in its turn, results in a depletion of the financial resources. Inability to replenish the reserves for such resources as the Owners’ Equity, Borrowings and Accounts Payable may entail a discontinuation of the operational activity resulting in the future goods sales “losses”. On the contrary, the costs cut for advertising and sales, e.g. may decrease the Finished Goods conversion into Cash and Accounts Receivable. A long-term cash flow block may cause the company insolvency.
The company’s ability to counteract the unexpected cash flows delay due to the contingencies, i.e. its ability to attract cash resources from various sources, to increase owners’ equity, to sell and transfer its assets, and to regulate the level and direction of the company activity so that they correspond to the changed environment is understood as the company financial flexibility (Bernstein, Citation1993; Bernstein et al., Citation2001) dependent on many factors and subject to abrupt changes. It depends upon the company profitability, stability, its size and position in the industry, a structure of the assets and capital as well as upon the conditions and trends of the fund market. As a rule, the company’s ability to raise funds is essential for seeking financial sources at the moment of emergency and current liabilities maturity prolongation. The funding prepared in advance and opened credit lines are more reliable financial sources at the moment of the urgent need rather than potential funding. Other factors influencing the evaluation of the company financial flexibility is the ratings of the company securities, bonds and preferred stock; the assets sales restrictions; a degree of discretionary costs; an ability to respond to the environment change; strikes, a decrease in demand and ceased deliveries. The financial flexibility is worthwhile when evaluating the company’s long-term solvency.
It should be noted that cash availability does not generate any gain or very little gain, and in the process of prices growing they lose its purchasing capacity. However, in spite of the above statement, the availability of this most liquid asset ensures that the risk is reduced to the greatest extent. The company management ought to make a decision of the cash to be invested in the assets or costs, thereby raising the risk, as the chance of the assets conversion back into cash is less than 100%. The risks are various. The risks related to the cash transfer into temporary assets are lower than that into the long-term assets, e.g. property, plant and equipment, and some kinds of inventory. Similarly, the cash investment into various assets and sales costs bears the risk in terms of the invested funds conversion back into cash. The company’s short-term liquidity and long-term solvency depend upon the reimbursement and realization of outlay.
Notice that the fund flow speed is taken into account in their management (Pocock & Taylor, Citation1988). The cash flow speed, i.e. the speed of its accessibility, is an essential factor to evaluate the current and future financial company stability. Its importance lies in the company management control of the liquid resources in its disposal. If the flow is featured by a sufficiently fast speed, the company management ought be able to cover the liabilities having preferred rights for the available resources. Any negligence in meeting the liabilities will hurt the company reputation and its ability to finance its activity.
Planning the future or anticipated cash flows is known to be an important part of the planning procedure. The expected cash inflow for the time-period will be calculated and compared with the anticipated payments and their speed. Any discontinuations are to be evaluated especially those resulting in the deficit. The most important element of the financial management is its ability to utilize profitably the surplus and cover the likely deficit.
As a rule, the permanent capital is to be invested with good return but its volume ought to be sustained at the lowest level possible to enable the company to develop, facing no financial difficulties. The likely short-term deficits are to be forecast and covered, for example, by means of the short-term borrowings. It is easier to agree the deficit cover if it is forecast beforehand.
However, the concept of the fund flow is featured by some constraints. The thing is that whilst the cash is retaining its form, the company management acquires a certain degree of freedom in terms of the cash investment. The freedom of actions depends on the amount of cash having been invested in such costs as dividend payment, raw materials and supplies stock, reserves, long-term investment, and debt payment. The total amount of cash inflow is specified by the company management to attract such resources as owners’ equity and borrowings. As for non-invested funds at the moment of their inflow to the company, the management is free to transfer them wherever they consider worthwhile. It is this non-invested part of cash flow that presents a special interest for the analyst. The non-invested funds are also named as “free cash flow” (Bernstein, Citation1993; Bernstein et al., Citation2001).
3.2. The concept of the balanced scorecard (in terms of its financial score)
The Balanced Scorecard as an efficient analytical instrument applied in the field of strategic management is understood as an aggregate of parameters featuring an overall company performance in the present-day market economy. The concept was developed by American scientists Robert Kaplan and David Norton at the beginning of the 90s of the twentieth century (Kaplan & Norton, Citation1992), evolving both in their works (Kaplan, Citation2008), (Kaplan & Norton, Citation1996, Citation2001, Citation2003, Citation2006, Citation2008; Kaplan, Norton, & Rugelsjoen, Citation2010), (Kaplan et al., Citation2010), and other researchers (Brown, Citation2007; Friedag & Schmidt, Citation2002; Horvath & Partners, Citation2004; Maisel, Citation1992; Niven, Citation2005, Citation2006, Citation2014; Olve, Roy, & Wetter, Citation2000; Rampersad, Citation2008), and was multiply tested.
Balanced Scorecard is focused on creating wider competitive opportunities; it reflects a balance to be brought about between the short-term and long-term goals, the financial and non-financial scores, the basic and auxiliary parameters, as well as the internal and external factors of the company economic activity. In terms of information, the BSC is to be accessible for the employees of all levels, based on the cause and effect; results attain factors and their interrelation with financial data.
The main goal of the Balanced Scorecard is to transform a company strategy into specific tangible objectives, scores, and end up with events.
The BSC scores being relatively few (about 25 scores in average), they are selected (developed) depending on the outlook and strategic goals of any particular company and have individual features, so as the company managers and employees focus on the factors resulting in the outstanding achievements for the company competitiveness.
The Balanced Scorecard encompasses four basic interrelated scores: finance, a customer, internal business processes ones as well as training and personnel development score considered through the prism of key problems, strategic goals, scores, and their target values and strategic events as well.
The developed financial balanced scorecard score for which strategic goals being basic to develop the strategic goals and the rest of the BSC score is presented as a table (Table ).
Table 1. Financial balanced scorecard score
The scores of the Balanced Scorecard system, as a whole, and its financial score are special for any particular company and are subject to its financial strategy. Nevertheless, as an example, we identify some general financial BSC scores, measuring its strategic goals and being universal for various companies at the stages of their life cycles and enter them into Table .
Table 2. Certain general indicators of the financial BSC score
It has been presented in the author’s previous publications that the financial BSC score indicators can be utilized by any company as the information base to exercise the Applied Strategic Financial Analysis (Krylov, Citation2015). The latter is a part of the Applied Strategic Analysis and consists of the indicators values comparative assessment, diagnostics, and forecast (Krylov, Citation2010, Citation2013, Citation2014, Citation2015).
The concepts of the company financial ratios, cash flows, Balanced Scorecard (in terms of its financial score) form the methodology of the research; the results are presented in the paper. Having succinctly characterized the latter, we consider the author’s theoretical, methodical, applied, and practical aspects of the target financial forecasting as the basis of the anticrisis company cash flow management.
4. Results
4.1. The conceptual basis of the target financial forecasting as the foundation of the anticrisis financial management
Describing the conceptual basis of the target financial forecasting as the foundation of the anticrisis financial company management, the author specifies eight stages in the procedure:
A formation of the information base.
A selection of the financial ratios.
An analysis of the company financial position and forecasting of the financial ratios values.
A calculation of the leading balance sheet indicators and selected financial data.
A calculation of the leading net cash flows by the balance sheet items.
A formation of the equations system of the cash flows.
A calculation of the leading cash inflows and outflows.
A development of the events (managements’ decisions) aimed at the company’s overcoming its financial difficulties.
Let discuss the stages (applicable to middle-size and large industrial companies as they play a significant role in world economy).
4.1.1. A formation of the information base
The author has selected a Balance Sheet, Income Statement, and other forms of accounting (financial) statement complemented by the Selected Financial Data from the current accounting, further named as “the Balance Sheet and Selected Financial Data” for the information base of the target financial forecasting (e.g. at year of reported end). To form the base, the Balance Sheet is to be reclassified (i.e. regrouped), the Selected Financial Data from other financial statements and current accounting are to be attached, as well as the model of the company Cash Flows (Figure ) is to be transformed so that they are interlinked (agreed). The new cash flows arising in the conditions of the company bringing out of the crisis financial position are entered into the model.
4.1.2. A selection of the financial ratios
The financial ratios are selected from the information base by the following principles:
their usefulness for the overall analysis of the company financial position with a view to ensure the position forecasting efficiency and the financial resource flow;
their substantiality at the minimum of the financial ratios;
their drawing up into the system of equations, the balance equalities taken into account.
The author considers expedient to classify the financial ratios into four groups featuring the main aspects of the company financial position: property position, financial stability, solvency and liquidity, business activity (comprising an intensity of the resources utilization, an efficiency of activity and resources utilization, a securities market position (for public companies)).
4.1.3. An analysis of the company financial position and forecasting the financial ratio values
The analysis of the company financial position and the forecast of the financial ratio values presume two approaches to be carried out.
Under the first approach, the calculated financial ratio values obtained on the basis of the initial information base are compared with the actual or developed standards. If the values of one, several, or all financial ratios values appear to be unsatisfactory, they all are to be corrected. The leading values of the financial ratios end up. In other words, the financial ratios values are immediately corrected.
Within the second approach the financial ratio values are corrected by the overall (i.e. complex) evaluation of the company financial position.
The two options are acceptable for the matter.
The first one presumes a formation of the model of the most generalized indicator of the performance efficiency evaluation (the profitability of the assets and Owners’ Equity, the ratio of the economic growth stability, etc.). The indicator is treated as the outcome index of the complex evaluation of the company performance efficiency exercised on the basis of the selected financial ratios. In this case, another financial ratio is to be added to the principle of the financial ratios selection having been stated above. The ratio implies a potential to utilize the selected financial ratios as the factors within the factoring model of one of the most generalized indicators of the company performance efficiency evaluation. Later, the outcome indicator value is compared with the standard one and is corrected if the result is unsatisfactory. The correctness result is understood as the leading value of the outcome indicator of the complex company performance efficiency evaluation, the values of the defining factors changing accordingly. The changes present the leading values of the financial ratios.
The second approach is associated with the rating of the company financial position by means of the selected financial ratios. The rating is exercised either by the expert score analysis or by the calculation of the integral indicator. Then the outcome rating number is compared with the standard one and is corrected if the result is unsatisfactory. The correctness result presents the leading value of the outcome rating number, the values of the financial ratios changing, respectively. The changes imply the leading values of the financial ratios.
4.1.4. A calculation of the leading balance sheet indicators and selected financial data
The leading Balance Sheet indicators and Selected Financial Data are calculated by solving the system of equations. The system of equations is composed of the financial ratio formulae and balance equalities. The initial data for the system solution are the leading target values of the financial ratios and the condition that the value of the Balance Sheet indicator or the Selected Financial Data which are either unchanged or set to be changed.
4.1.5. A calculation of the leading net cash (fund) flows by the balance Sheet items
The calculation of the leading net cash (fund) flows by the Balance Sheet items is obtained by the item deduction of the initial values from the leading Balance Sheet indicators. The leading net cash (fund) flows by the Balance Sheet items and the Selected Financial Data (which are fund flows by their economic nature, e.g. Revenues, Net Sales, Net Income, Dividends, etc.) are assumed as the initial data to forecast the cash (fund) inflows and outflows within the transformed model of the company cash (fund) flow.
4.1.6. A formation of the equations system of the cash (fund) flows
This stage seems to be the most essential and complicated of the eight. The transformed model of the company cash (fund) flows must take into account all the company cash (fund) inflows and outflows and interlink them by the system of the equations. That is the complexity. It is essential that neither errors nor inaccuracy is allowed while considering and interlinking the cash (fund) flows; otherwise, the desired improvement of the company’s financial position is not attained. The stage is not only essential and complicated but labor consuming as well, as the system will contain far more equations than that for the calculation of the leading Balance Sheet indicators and Selected Financial Data. Obviously, a number of the unknowns will noticeably exceed a number of the equations so the introduction of the initial conditions is required. The forecast values of the cash (fund) flows are assumed as the said condition. Certain assumptions may be introduced to simplify the system of the equations. The issue of the specific simplifying equations and initial conditions is to be settled separately in any specific case.
4.1.7. A calculation of the leading cash (fund) inflows and outflows
The leading cash (fund) inflows and outflows are calculated by solving the system of the equations mentioned above on the basis of the leading net cash (fund) flows by the Balance Sheet items and the initial conditions and assumptions having been determined.
4.1.8. A development of the events (managements’ decisions) aimed at the company’s overcoming its financial difficulties
The leading values of the cash (fund) inflows and outflows and the Selected Financial Data define the methods for the company to improve its financial position and overcome its financial difficulties respectively. Basing on them, the events (managements’ decisions) aimed at the company’s overcoming its financial difficulties and improving its financial security are developed.
4.2. Methods of the target financial forecasting as the basis of the anticrisis financial management
To consider the methods of the target financial forecasting as the basis of the anticrisis financial management of the company within the time-period of practically any length the author specifies four steps as follows:
Preparation of the information-accounting support of the target financial forecasting.
Target forecasting of the company financial position.
Target forecasting of the company cash (fund) flows.
A development of the events (management’s decisions) aimed at the company’s overcoming its financial difficulties.
4.2.1. Preparation of the information-accounting support of the target financial forecasting
The interrelationship of the company Balance Sheet and Selected Financial Data as well as the cash (fund) flows model that causes to reclassify (to regroup) the company Balance Sheet, to attach additional data needed and to transform a standard model of the cash (fund) flows, forms the basis of the preparation of the information-accounting support of the target financial forecasting.
The reclassified balance sheet and selected financial data are presented in the Table .
Table 3. Balance sheet and selected financial data
The assets of the Balance Sheet are presented by two sections: Current and Non-current Assets. The Current Assets comprise Cash and Cash Equivalentes, Accounts Receivable, Raw Materials and Supplies, Work in Process, Finished Goods, and Other Current Assets. The Non-current Assets are divided into Fixed Assets, Intangible Assets, Long Term Financial Investment, and Other Non-current Assets.
The liabilities of the Balance Sheet are presented by three sections: Current Liabilities, Long-Term Liabilities, and Owner’s Equity. The Current Liabilities comprise Accounts Payable and Short-Term Debt. Current Liabilities and Long-Term Liabilities are combined into Debt Capital.
The Selected Financial Data are presented by Revenues, Net Sales, Net Income, Dividend paid to Preferred Stockholders and Dividend paid to Common Stockholders, Payroll Expense, Selling, Administrative and General Expenses, Depreciation and Amortization, Tax Expense, and Interest Expense. It should be noted, that the item “Dividends” is replaced by the “Retained Earnings” one for nonpublic company and the “Dividends paid to Preferred Stockholders”, “Dividends paid to Common Stockholders” are excluded. The transformed model of the company fund flows is presented in Figure . Compared with the standard model (Figure ), the model in question contains a number of changes enabling, on the one hand, to elaborate the standard model and interrelate it with Balance Sheet (in the process of reclassifying) and the Selected Financial Data, on the other, to adapt the model for the company fund flow forecasting related to the improvement of the company financial position.
Figure 3. The transformed model of the company cash (fund) flows.
For example, it takes into account the dividends paid for the Preferred and Common Stockholders, and the liabilities including Short-Term Payables and Long-Term Liabilities. In addition, the company can realize Long-Term and Short-Term Investments.
The depreciation procedure comprises both a Depreciation of the Fixed Assets and an Amortization of the Intangible Assets.
The three new Cash Flows are added, the two of them take into account the sales of the Raw Materials and Supplies and the Work in Process for the company to improve its financial position, the third Cash Flow represents the prepaid Materials and Supplies (the absence of the Accounts Payable).
All the cash flows within the transformed model of the company fund flows stated in the Figure are decoded in the Table . The results of the calculations are divided into the intermediary and the end ones. The intermediary results of the target financial forecasting are presented by the leading values of the financial ratios and the net cash flows by the Balance Sheet items. The end results are the leading values of the company fund flows within their transformed model (Figure and Table ).
Table 4. The company cash (fund) flows
Figure 4. The block-scheme of the algorithm of the target forecasting of the company financial position.
Completing the preparation of the information-accounting support of the target financial forecasting as the instrument of the methods of the company financial position improvement we commence the treatment of the procedure proper.
4.2.2. Target forecasting of the company financial position
On the basis of the discussed selection concept and grouping, and the prepared information accounting support of the target financial forecasting in the form of the Balance Sheet and the Selected Financial Data (Table ), the indicators specifying the company financial position the system of the financial ratios is formed for its analysis. The system comprises four groups of the financial ratios characterizing
the company Property, Plant and Equipment position, Solvency and Liquidity, financial health and operational performance. There are 21 financial ratios listed as follows:
1. Financial ratios characterizing company Property, Plant and Equipment position (3);
Long-term Investment/Non-Current Assets Ratio (R1.1);
Fixed Assets/Non-Current Assets Ratio (R1.2);
Intangible Assets/Non-Current Assets Ratio (R1.3).
2. Financial ratios featuring company Solvency and Liquidity (7):
Cash & Equivalents/Current Liabilities Ratio (R2.1);
Cash & Equivalents +Short-Term Investment/Current Liabilities Ratio ((R2.2);
Cash & Equivalents +Short-Term Investment +Accounts Receivables/Current Liabilities ratio (R2.3);
Cash & Equivalents +Short-Term Investment +Accounts Receivables +Raw Materials & Supplies/Current Liabilities Ratio (R2.4);
Cash & Equivalents +Short-Term Investment +Accounts Receivables +Raw Materials & Supplies +Work-in-Process/Current Liabilities Ratio (R2.5);
Cash & Equivalents +Short-Term Investment +Accounts Receivables +Raw Materials & Supplies +Work-in-Process +Finished Goods/Current Liabilities Ratio (R2.6);
Liquidity Ratio (R2.7).
3. Financial ratios describing company financial strength (3):
Return on Equity Ratio (R3.1);
Debt Capital Ratio (R3.2);
Accounts Payable/Current Liabilities Ratio (R3.3).
4. Financial ratios characterizing company Operational Performance (8):
Economic Growth Ratio (R4.1);
Profitability Ratio (R4.2);
Invested Capital Turnover Ratio (R4.3);
Net Sales Ratio (R4.4);
Net Revenues Ratio (R4.5);
Payroll/Production Cost Ratio (R4.6);
Selling, Administrative & General Expenses/Sales Revenues Ratio (R4.7);
Dividend/Net Income Ratio (R4.8).
The formulae to calculate the financial ratios listed above referred to by their abbreviations in Table are as follows:
Deriving from the calculation formulae of the financial ratios, balance equalities, and dividend equations, the author has designed the following system of equations (the indicator К4.8 marked with * and dividend equations are excluded for the non-public companies):
The system of equations presented characterizes the overall company financial position. Each equation (other than the last three) presents a financial ratio (formulae 4–24) for which value is being calculated by the indicators of the Balance Sheet and Selected Financial Data (Table ). The reversal procedure is also feasible, i.e. the calculation of the indicators of the Balance Sheet and Selected Financial Data derived from the specified values of the financial ratios. However, it is an initial condition that is to be set for the system of equations to be specifically solved. The value of an indicator of the Balance Sheet or Selected Financial Data is selected for the matter.
Hence the system of equations proposed by the author is an instrument of both the overall company financial position characterization and the company financial forecasting.
The procedure of the company financial forecasting commences from completing the Balance Sheet or Selected Financial Data (Table ) with numerical data. Then the values of the financial ratios are calculated under the formulae 4–24 and analyzed. Should the values of one or a few financial ratios be improved, they are corrected. In the opposite case, they remain unchanged. The leading values of the financial ratios are derived. The initial condition is later set, i.e. the indicator of the Balance Sheet or Selected Financial Data which are either unchanged or set to be changed. The leading values of the financial ratios and the initial condition are substituted into the system of the Equations (25). The system of the Equations (25) is solved for the unknown values of the indicators of the Balance Sheet or Selected Financial Data. The outcome presents the leading values of the indicators of the Balance Sheet or Selected Financial Data, specifying the target forecast of the company financial position.
The block-scheme of the algorithm of the target forecasting of the company financial position is presented in Figure .
It should be noted that in addition to the direct correctness of the financial ratios, their correctness is feasible by changing the company’s financial position rating.
However, to correct the financial ratios values by changing its rating number ought to be effected only for a fewer financial ratios being comparatively equal in terms of the financial position ratios. In the opposing case, the procedure will complicate the objective of the target forecasting of the company financial position and bring in a certain element of subjectivism (inevitable for the development of any rating league table of the company financial position). The latter will affect and/or distort the results of the forecasting.
4.2.3. Target forecasting of the company cash (fund) flows
The initial data for the target forecasting of the company cash (fund) flows are presented by the previously calculated leading Balance Sheet and Selected Financial Data as well as the initial Balance Sheet.
The net (fund) flows by the Balance Sheet items (indicators) are derived from the item deduction of the initial Balance Sheet from the leading Balance Sheet.
Then we are to define the leading cash inflows and outflows by the Balance Sheet items and interlink them between each other and with the leading Selected Financial Data within the transformed model of the company fund flows (Figure ).
To solve the problem, we ought to express the net cash flows by the Balance Sheet items as corresponding cash inflows and outflows. It should be noted that the following equations (Krylov, Citation2012) are valid for the cash flows by the Balance Sheet items:
where – the forecast value (at the end of the time-period forecast) of the ith item (indicator) of the balance sheet;
– the initial value (at the beginning of the time-period forecast) of the ith item (indicator) of the Balance Sheet;
– the forecast value of the cash inflow (fund inflow) by the ith item (indicator) of the Balance Sheet (for the time-period of forecasting);
– the forecast value of the cash outflow (fund outflow) by the ith item (indicator) of the Balance Sheet (for the time-period of forecasting);
– the forecast change of the value of the ith item (indicator) of the Balance Sheet (net cash flow for the time-period of forecasting).
The formulae of the kind (27) form the basis of the system of equations interlinking the leading Selected Financial Data, leading net cash flows as well as the cash inflows and outflows by the items of the Balance Sheet (Tables and ). The system is considered to be the instrument of the target forecasting of the company cash (fund) flows within the transformed model (Figure ):
where IC&E and ОC&E are cash inflow and outflow, respectively.
In the system of equations, we mark by *s the values known at this stage of solution. Obviously, a number of the unknowns exceeds the number of equations. Therefore, we have to introduce certain initial conditions and assumptions:
If ΔOCA ≥ 0, then ΔOCA = IOCA and ОOCA = 0;
ΔONCA ≥ 0, then ΔONCA = IONCA and ОONCA = 0;
ΔLTI ≥ 0, then ΔLTI = ILTI and ОLTI = 0;
ΔSTI ≥ 0, then ΔSTI = ISTI and ОSTI = 0;
ΔLTL ≥ 0, then ΔLTL = ILTL and ОLTL = 0;
ΔSTD ≥ 0, then ΔSTD = ISTD and ОSTD = 0;
ΔAP ≥ 0, то ΔAP = IAP and ОAP = 0;
or,
if ΔOCА < 0, then ΔOCА = ОOCA and IOCA = 0;
ΔONCA < 0, then ΔONCA = ОONCA and IONCA = 0;
ΔLTI < 0, then ΔLTI = ОLTI and ILTI = 0;
ΔSTI < 0, then ΔSTI = ОSTI and ISTI = 0;
ΔLTL < 0, then ΔLTL = ОLTL and ILTL = 0;
ΔSTD < 0, then ΔSTD = ОSTD then ISTD = 0;
ΔAP < 0, then ΔAP = ОAP and IAP = 0;
or inflows (or outflows) of OCA, ONCA, LTI, STI, LTL, STD, AP are specified as initial conditions.
(2) When calculating the taxes payable (TE) a state of the function a is determined by tax rates and methods of their calculation and arguments by their kinds. The leading tax payables can be specified as initial conditions.
(3) The states of the functions g and f utilized to calculate the leading income (II) and Interest Expense (IE) are determined by the interest rates for the time-period forecast for the appropriate contracts. II = IE = 0 is true. The leading Income and Interest Expense can also be specified as initial conditions.
(4) АINA or DFA is set as initial condition.
(5) If ΔINАC&E = IINA–ОINA,C&E ≥ 0, then ΔINAC&E = IINA and ОINA,C&E = 0,
or, if Δ INАC&E = IINA–ОINA, C&E < 0, then ΔINAC&E = ОINA,C&E and IINA = 0,
or IINA–initial condition,
or ОINA,C&E–initial condition.
(6) If Δ FAC&E = IFA–ОFA,C&E ≥ 0, then Δ FA C&E = IFA and ОFA,C&E = 0,
or, if ΔFAC&E = IFA–ОFA,C&E < 0, then ΔFAC&E = ОFA,C&E and IFA = 0,
or IFA–initial condition,
or ОFA,C&E–initial condition.
(7) IEC,C&E is specified as initial condition.
(8) ISC is set as initial condition.
(9) ОWP,C&E is specified as initial condition.
(10) ОRM,C&E is specified as initial condition.
The process of the target forecasting of the company cash (fund) flows (inflows and outflows) commences from substituting the initial data (leading values of the leading cash flows by the Balance Sheet items and leading values of the Selected Financial Data into the system of Equations (28)) taking into account the initial conditions and accepted assumptions. The system of equations is to be solved. The outcome presents the leading values of the cash flows: inflows and outflows by the Balance Sheet items. The leading values of the cash (fund) inflows and cash (fund) outflows by the Balance Sheet items as well as the leading values of the Selected Financial Data are integrated into the unified system of the cash (fund) flows. The system defines methods to improve the company financial position and overcome the financial difficulties.
The block-scheme of the algorithm of the target forecasting of the company cash (fund) flows is presented in Figure .
Figure 5. The block-scheme of the algorithm of the target forecasting of the company cash (fund) flows.
In the process of the target financial forecasting, a few versions of the target cash (fund) flows forecast can be calculated. The most acceptable and realistic one is derived from the comparative assessment results in terms of its applicability and practical implementation within a certain time-period to come scheme of the algorithm of the target forecasting of the company cash (fund depending on the specific objective internal and external factors which make an impact on the company performance.
4.2.4. Development of the events (management’s decisions) aimed at the company’s overcoming its financial difficulties
On the basis of the leading cash (fund) flows, the specific events (management’s decisions) are developed to overcome the company financial difficulties and improve its financial health laying the foundation for its financial strategy for the time-period to come (Table ).
Table 5. Results of the target forecasting of the company cash (fund) flows
The overcome of financial difficulties (improvement of financial health) as the strategic financial target, the most essential indicators of the financial statements (Balance Sheet and Selected Financial Data and the developed events (management’s decisions) are to be included into the financial score of the company Balance Scorecard.
The following methods of the target financial forecasting are considered as the main leads of its practical application:
anticrisis management of bankrupt company and companies at the verge of a certain degree of bankruptcy;
enhancement of company investment appeal (in terms of finance).
The methodical approach is the same for both cases differing in the values of the financial ratios and initial conditions.
4.3. Mathematical model of the target financial forecasting as the basis of the anticrisis financial management and its calculation
The integration of the system of the equations enables to develop a mathematical model of the target financial forecasting derived from the said algorithms of the target forecasting of the company financial position and its Cash Flows. The mathematical model of the target financial forecasting is assumed as a deterministic model of the general-purpose programming. The aim of the model defines methods to overcome the company financial difficulties and improve its financial position respectively basing on the leading cash flows.
The author of the article thinks the model of the target financial forecasting to be rather complicated and multilevel; therefore, he advises to consider a programmed realization of one of its essential version featured as follows:
The initial conditions for the system of the Equations (25) to be solved are either Equity Capital or Long-Term Liabilities, or Indebtedness, or Accounts Payable or Short-Term Debt, or Revenues.
The initial conditions and certain assumptions for the system of the Equations (28) assume the following parameters:
Long-Term Investment inflow (ILTI);
Marketable Securities and Short-Term Investment inflow (ISTI);
Long-Term Liabilities inflow (ILTL);
Inflow of Cash Return on Equity (IEC,C&E);
Sales against Cash flow (ISC);
Tax Expense flow (TE);
Interest Expense flow (IE);
Depreciation of Fixed Assets flow (DFA);
Intangible Assets outflow into Cash (ОINA,C&E);
Fixed Assets outflow into Cash (ОFA,C&E);
Work-in-Process outflow into Cash (ОWP,C&E);
Raw Materials and Supplies outflow into Cash (ОRM,C&E);
Other Non-Current Assets outflow (ОONCA);
Other Current Assets outflow (ОOCA);
Accounts Payable outflow (ОAP);
Short-Term Debt outflow (ОSTD).
The parameters have been selected owing to their predictability and the market environment.
The author of the paper has developed the program derived from the mathematical model of the target financial forecasting by means of the Microsoft Excel Tables. The name of the program is “Target Financial Forecasting”. The program enables to analyze and forecast the company financial position as well as to forecast the company Cash (fund) Flows (both public and non-public companies) basing on the mathematical model of the target financial forecasting.
4.4. Practical application of target financial forecasting as the basis of anticrisis financial management
Consider practical application of the project having been developed by the author and described above in terms of the target financial forecasting for the Public Limited Company (PLC) “Strela”, as an example.
The numerical data (initial data and calculations results) are entered into the Tables (Tables –1), respectively.
Table 6. Initial balance sheet and selected financial data of “Strela” PLC at end of the reported year
Table 7. Financial ratio values utilized to analyze “Strela”’s PLC financial position
Table 8. Leading balance sheet and selected financial data of “Strela” PLC at end of future period
Table 9. Leading cash (fund) flows by the balance sheet items of “Strela” PLC for the future time-period
Table 10. Leading cash (fund) “Strela”’s PLC flows for future time-period
The financial ratio values to analyze and evaluate the financial position of “Strela” PLC have been derived from the initial data in Table . It is evident from the second column of Table that the calculated values of many financial ratios, first and foremost Solvency and Liquidity, are unsatisfactory. Consequently, the conclusion is drawn that “Strela”’s PLC financial health is poor, and the company is facing financial difficulties. To improve its financial position, the values of the insufficient financial ratios need to be improved,i.e. corrected, so as they acquire corrected (improved) leading values provided in column three of Table .
Later, the initial condition (a value of Equity Capital, ad hoc) is specified for further calculation of the leading Balance Sheet and leading Selected Financial Data. The calculation outcome of the leading Balance Sheet and leading Selected Financial Data is entered in Table . Should they be achieved, “Strela” PLC will have improved its financial position and overcome its financial difficulties to a greater extent by the year end.
Then calculated are leading cash (fund) flows by the Balance Sheet items for the future time-period. The results are entered in Table .
The leading net cash flows by the reclassified Balance Sheet items, leading Selected Financial Data, as well as the initial conditions and assumptions enable to determine overall leading Cash “Strela”’s PLC Flows for the future time-period facilitating to improve the company financial position to the set level and overcome its financial difficulties (Table ).
The leading cash (fund) flows obtained act as the basis for the development of the events. “Strela” PLC overcomes its financial difficulties and improves its financial position, the key ones being generalized in Table . Proceeding from the substantial change of the Balance Sheet and Selected Financial Data indicators, the anticipated future time-period for the implementation is of the order of 5–7 years.
Table 11. Certain key results (fairly generalized) of the target financial forecasting for “Strela”’ PLC
Table demonstrates that the events dealing with “Strela”’s PLC cash (fund) flows bear a sufficiently general character. The “Strela” PLC managers operating certain company assets, liabilities, and financial outcomes are able to specify and work them out.
5. Discussion
Having discussed the target financial forecasting as the basis for the anticrisis financial management in terms of its conceptual, methodical, and practical aspects, we compare it with such financial forecasting techniques at the level of the company, i.e. the micro level, considered in the relevant references and applied today as budgeting, percentage of revenues, and economic-mathematical techniques. The first two methods are applied as an instrument for short-term financial forecasting and the third one for long-term financial forecasting.
It should be noted that all financial forecasting techniques considered (budgeting, percentage of revenues technique, economic-mathematical technique) are primarily designed to be applied within the healthy company performance conditions experiencing neither financial difficulties nor the need to develop any anticrisis events. For the company to find the way out of the unhealthy financial position, the techniques are not sufficiently effective because the financial forecasting for the short term is based on the sales forecast (revenues). The values of the leading financial ratios characterizing the desired financial position to be attained are required in order to correct the company financial position. The values can be obtained by application of the budgeting and percentage of revenues techniques. However, the latter entails a time-consuming method of selection resulting in larger number of calculation variants until the financial ratios values characterizing the desired financial position is reached. In this case, the financial forecasting sequence is changed: first, forecast is financial statements data specifying the company financial position, second, forecast are its cash flows. The proposed approach simplifies the forecasting issue, extends its capacity, and cuts the time taken.
The economic-mathematical technique as an instrument for middle-term and long-term financial forecasting is unlikely to be applied in unfavorable performance environment due to its features mentioned above; and therefore cannot be considered as a means of the target financial forecasting to improve the company financial.
Hence, compared with the current methods of the budgeting, percentage of revenues, and economic-mathematical technique, the target financial forecasting is the most effective instrument of the financial forecasting that enables to design the basis for the company to overcome its financial difficulties.
6. Conclusions
Generalizing the results of the author’s research presented in the article the following conclusions are drawn:
The target financial forecasting is a new instrument of the anticrisis financial management aimed at overcoming the company’s financial difficulties and enhancing its financial position within a time-period of practically any length;
The methodology is based on the concept of the financial ratio analysis, the concept of the company cash (fund) flows, and the concept of the Balanced Scorecard (in terms of its financial score);
The procedure of the target financial forecasting comprises an appropriate informational-accounting support, the target financial forecasting of the company financial position, the target forecasting of the company’s cash flows, a development of the specific events (management’s decisions) aimed at overcoming the company’s financial difficulties and enhancing its financial position;
The target financial forecasting is based on the financial ratios analysis (first and foremost those characterizing company’s solvency, liquidity, and financial stability) selected in terms of their usefulness, richness of content to formulate a system of equations;
The financial ratios enable to assess the company financial position and its financial difficulties, if any, of certain degree of their severity;
The reasonable correctness of the unsatisfactory financial ratios values lead to cash flows forecasting for the company management decisions to overcome its financial difficulties;
In the present-day environment, the target financial forecasting can be an effective instrument of the financial forecasting that enables to set up the base for the company to overcome its financial difficulties and enhance its financial position;
The major fields of the target financial forecasting application are an anticrisis bankrupt company management, a management of the company at the verge of bankruptcy, as well as the company’s investment appeal enhancement (in terms of its financial aspect);
The author acknowledges the target financial forecasting applicability for middle-size and large industrial companies.
7. Implications for future research
The author considers the basic implications for future research of the target financial forecasting as an instrument to improve company financial health as follows:
Improvement of the target financial forecasting mathematical support (equations system and mathematical models) in terms of reducing a number of input initial conditions and assumptions with a view to raise accuracy of the target financial forecasting results;
Development of the techniques, mathematical models, and software of target financial forecasting for companies and organizations in such industries as trade, services, public transport, communications, etc. for them to overcome their financial difficulties (as the case may be).
Additional information
Funding
Notes on contributors
Sergey Krylov
Sergey Krylov is a doctor of economic sciences, professor in accounting and economic analysis at the Department of Accounting and Audit in Ural State University of Economics, Yekaterinburg city, Russian Federation. His research interests include Financial Analysis, Financial Forecasting and Balanced Scorecard.
References
- Bernstein, L. A. (1993). Financial statement analysis: Theory, application and interpretation. Boston: Irwin.
- Bernstein, L. A., Wild, J., & Subramanyam, K. R. (2001). Financial statement analysis. New York, NY: McGraw-Hill Higher Education.
- Block, S. B., Hirt, G. A., & Danielsen, B. (2011). Foundations of financial management. New York, NY: McGraw-Hill Education.
- Brealey, R. A., Mayers, S. C., & Allien, F. (2017). Principles of corporate finance. New York, NY: McGraw-Hill Education.
- Brigham, E. F. (1983). Fundamentals of financial management. New York, NY: Holt Saunders.
- Brigham, E. F., & Houston, J. F. (2015). Fundamentals of financial management: Concise. Boston: Cengage Learning.
- Brooks, C. (2014). Introductory econometrics for finance. New York, NY: Cambridge University Press.
- Brown, M. G. (2007). Beyond the balanced scorecard. Improving business intelligence with analytics. New York, NY: Productivity Press.
- Friedag, H. R., & Schmidt, W. (2002). Balanced Scorecard: Mehr als ein Kennzahlensystem. Berlin: Haufe Mediengruppe.
- Helfert, E. A. (1994). Techniques of financial analysis. Boston: Irwin.
- Helfert, E. A. (2001). Financial analysis: Tools and techniques. A guide for managers. New York, NY: McGraw-Hill.
- Higgins, R. C., Koski, J., & Mitton, T. (2016). Analysis for financial management. New York, NY: McGraw-Hill Education.
- Horvath & Partners. (2004). Balanced scorecard Umzetzen. Stuttgart: Schaeffer-Poeschel Verlag GmbH.
- Kaplan, R. S. (2008). Conceptual foundations of the balanced scorecard. Handbook of Management Accounting Research, 3(1), 1253–1269.
- Kaplan, R. S., & Norton, D. P. (1992). The balanced scorecard: Measures that drive performance. Harvard Business Review, 70(1), 71–79.
- Kaplan, R. S., & Norton, D. P. (1996). The balanced scorecard: Translating strategy into action. Boston: Harvard Business School Press.
- Kaplan, R. S., & Norton, D. P. (2001). The strategy-focused organization: How balanced scorecard companies thrive in the new competitive environment. Boston: Harvard Business School Press.
- Kaplan, R. S., & Norton, D. P. (2003). Strategy maps. Boston: Harvard Business School Press.
- Kaplan, R. S., & Norton, D. P. (2006). Alignment. Using the balanced scorecard to create corporate sinergies. Boston: Harvard Business School Press.
- Kaplan, R. S., & Norton, D. P. (2008). The execution premium: Linking strategy to operations for competitive advantage. Boston: Harvard Business School Press.
- Kaplan, R. S., Norton, D. P., & Rugelsjoen, B. (2010). Managing alliances with the balanced scorecard. Harvard Business Review, 88(1), 114–120.
- Knot, G. (1985). Understanding financial management. London, Sydney: Pan Books.
- Krylov, S. (2012). Methodological approach to company cash flows target-oriented forecasting based on financial position analysis. Economics Bulletin, 32(1), 830–836.
- Krylov, S. (2013). Applied strategic analysis as further balanced scorecard concept development. Proceedings of the 11th Eurasia Business and Economics Society (EBES) Conference (pp. 35–42). Ekaterinburg, Russia: Russian Acad. Sci. Inst. Econ. Ural Branch.
- Krylov, S. (2015). Applied strategic financial analysis within strategic management of organization finance. European Journal of Business and Management, 7(15), 1–16.
- Krylov, S. I. (2010). Razvitie metodologii analiza v sbalansirovannoi sisteme pokazatelei [Development of analysis’s methodology in the balanced scorecard]. Moscow: Finance and statistics.
- Krylov, S. I. (2014). Theoretical aspects of economic balanced scorecard analysis. Asian Journal of Finance & Accounting, 6(1), 90–109. doi:10.5296/ajfa.v6i1.4821
- Lee, C. F., & Finnerty, J. E. (1990). Corporate finance: Theory, method, and applications. New York, NY: Harcourt Brace & Company.
- Maisel, L. S. (1992). Performance management: The balanced scorecard approach. Journal of Cost Management, 6(2), 47–52.
- Makridakis, S., Wheelwright, S. C., Hyndman, R. J., & Chang, Y. (1998). Forecasting methods and applications. New York, NY: John Willey & Sons, Inc.
- McLaney, E. J. (1992). Business finance for decision makers. London: Pitman Publishing.
- Niven, P. R. (2005). Balanced scorecard diagnostics: Maintaining maximum performance. Hoboken: John Willey & Sons, Inc.
- Niven, P. R. (2006). Balanced scorecard step-by-step: Maximizing performance and maintaining results. Hoboken: John Willey & Sons, Inc.
- Niven, P. R. (2014). Balanced scorecard evolution: A dynamic approach to strategy execution. Hoboken: John Willey & Sons, Inc.
- Olve, N.-G., Roy, J., & Wetter, V. (2000). Performance drivers: A practical guide to using the balanced scorecard. Chichester: John Wiley & Sons, Ltd.
- Penman, S. (2004). Financial statement analysis and security valuation. New York, NY: McGraw-Hill/Irwin.
- Pocock, M. A., & Taylor, A. H. (1988). Financial planning and control. Aldershot, Hants: Gower.
- Rampersad, H. K. (2008). The way to a highly engaged and happy workforce based on the personal balanced scorecard. Total Quality Management & Business Excellence, 19(1–2), 11–27. doi:10.1080/14783360701602155
- Subramanyam, K. R. (2014). Financial statement analysis. New York, NY: McGraw-Hill Education.
- Van Horne, J. C. (1989). Fundamentals of financial management. Englewood Cliffs: Prentice-Hall.
- Van Horne, J. C., & Wachowicz, J. M. (2009). Fundamentals of financial management. Harlow: Pearson Education Limited.
- Watsham, T. J., & Parramore, K. (2004). Quantitative methods in finance. New York, London: International Thomson Business Press.