
Abstract
The purpose of the following research is to analyze the expectations and perceptions of the consumer through the measuring of the intrinsic and extrinsic signals, as well as the expected quality of the organic tortilla to evaluate its impact over the purchasing intention. The design of the research was non- experimental, the scope was descriptive, correlational, causal and cross-sectional. The sampling method was non-probabilistic by convenience using a personal survey applied to a sample of 386 consumers at Tlaxcala’s Alternative Market in 2017. This research demonstrates the importance of the consumer while looking for alternatives to assess their purchase. The importance it shows among the organic sector is related to the information obtained, in order to design marketing strategies oriented toward the processed food market, being able to improve the signaling of the product and the perception of the consumer.
PUBLIC INTEREST STATEMENT
The rapid growth and boom of organic products has come to consider new models of purchasing behavior. This has caused companies to be unaware of the important factors of organic products including physical aspects such as their own expectations. Therefore, this research helps to know what are the most suitable and strategic ways to drive consumers’ intention to buy. This information will help organic product companies to make better decisions and establish follow-up mechanisms towards the modification and innovation of new products.
1. Introduction
The recent increase in the population oriented towards the consumption of by-products resulting from organic farming is one of the most important tendencies of the last decade. This orientation is supported both by socio-cultural and environmental factors; which altogether represent a sustainable option (Schwentesius, Gómez, Ortigoza, & Gómez, Citation2014). According to Willer and Kilcher (Citation2012), though Africa, Asia and Europe are home to 34% of the total of organic producers, indicators reveal that Uganda, India and México have taken a stance on the list, adding 1.6 million producers around the world.
In México, productive processes are regulated by the Organic Produce Law, through the National Service of Health Services, Innocuousness and Agro-alimentary Quality [SENASICA] (Secretary of Agriculture, Stockbreeding, Rural Development, Fishing and Feeding [SAGARPA], Citation2016). SAGARPA (Citation2017) reported 13 certified national organizations (third party audits) and increased their coverage to 22,933 producers in 2017, and 157 processed products certified as organic ones.
One of the players in the organic field is the consumer, who has changed its purchasing habits and has become much more thoughtful when choosing between such products and conventional ones, set aside by the benefits they offer. Kiss, Kontor, and Kun (Citation2015) state that the client’s perception is an interesting aspect since they consider certain characteristics such as flavor, odor and having nutrients that are far superior to those of standard products, represent an opportunity for producers and traders.
Hence, Chih-Ching and Yu-Mei (Citation2015) suggest it is important to develop marketing strategies. Identifying the factors that interfere with the consumer’s behavior and motivate them to buy organic products. With this idea in mind, both production and commercialization of organic produce in Mexico is being driven by specialized markets among different cities. There, local farmers offer certified high-quality products (Roldan, Gracia, Santana, and Horbath, Citation2016).
The following research centers on the Alternative Market of Tlaxcala, where there is a big amount of consumers who buy organic tortillas. However, producers do not have enough information about the consumer that could allow them to make better decisions on how to increase market sales. Hence, the analysis of all the intrinsic and extrinsic signals of the organic tortilla as well as the quality consumers expect when buying, will provide elements to assess the impact generated by the purchasing intention.
2. Literature review
2.1. Organic farming and green marketing
Due to the existence of an alimentary demand on behalf of the population, several producers have tried to meet such requests in as little time as possible and speed up the productive processes by using agrochemicals in excess. Shu-Yen, Chiao-Chen, and Tyrone (Citation2016) note that these farming practices convey negative effects not only for the environment but also for the health of the consumers, who are paying close attention to organic products as an alternative to this problem.
Anwar and Jan (Citation2016) point out that Green Marketing involves activities related to the production and/or consumption of products that are environmentally friendly. Turning out to be attractive for many traders since it allows them to look after a new market niche where consumers are conscious about environmental protection, willing to pay a higher price to the one they would pay for a conventional product.
2.2. The consumer of organic products and the purchasing intention
Paul and Rana (Citation2012) define organic products as those cultivated free from agrochemicals, pesticides or genetically modified organisms that are harmful to the environment. On the other hand, Gbadamosi (Citation2016) sustains the fact that the intention to purchase green products is one behavior displayed by the consumer in favor of the environment. There are assertions about the factors that affect the behavior and therefore exert influence over the purchasing intention. Bartels, Reinders, Sen, and Du (Citation2015) indicate that the behavior shown among organic product consumers is defined based on what they have acquired.
Therefore, Liang (Citation2016) argues the intention to acquire this type of products is affected by the link between distribution channels and the frequency of interaction of the consumer. Pearson, Henryks, Sultan, and Anisimova (Citation2013) point out the intention derives from the individual’s motivation and its relationship with two elements: the attitude displayed towards organic products and the system values it possesses. Also, they mention the term value refers to the products’ attributes and it functions as a record of the purchasing intention. According to Mohd Suki (Citation2018), the products’ reputation and the image could increase of the purchasing intention.
2.3. Product signals and their impact on the purchasing intention
Bi, Gao, Hause, and Hausmann (Citation2015) highlight the importance of the signals perceived by the consumer as an indicator of the quality they expect to obtain from the product and suggest resorting to the Theory of Using Signs. There are three tests to conduct sensory assessment: descriptive; compares the physical attributes of the product. Discriminatory; establishes differences between products and Hedonic, which evaluates the consumer preferences regarding the products.
Nasir and Karakaya (Citation2014) state that some product signals function as predictors of the purchasing intention, therefore the perception revolves around hedonic and functional variables of the product. So, the consumer searches for the product which offers a higher number of benefits. Likewise, Shu-Yen et al. (Citation2016) sustain the physical attributes are key elements among attitude generation, which when favorable, not only improve the product’s image but also increase the consumer’s purchasing intention.
Regarding the organic products’ intrinsic and extrinsic signals, Sampaio and Gosling (Citation2015) explain that just like conventional products, these elements generate an impact on the purchasing intention (see Figure ). Additionally, they insist on the importance they have for the consumer considering perceptions over health, pricing, branding, quality and availability of the product, to assess them all together at the moment of deciding whether to buy it or not.
Figure 1. Model of organic food consumer behavior. Adapted from Sampaio & Gosling (Citation2015).
At last, Pearson et al. (Citation2013) mention it is necessary to communicate and explain to all the positive intrinsic and extrinsic attributes of the organic products to the consumer. The previous, with the objective of justifying the benefits they promise and guarantee the food’s value. This way, the consumer may change its perception about the relationship between the cost and benefits and will be convinced to proceed with the purchase.
2.4. Impact of the intrinsic and extrinsic signals of the organic product over the consumer’s perception
Corchs, Ciocca, Bricolo,and Gasparini (Citation2016) mention the intrinsic signals weigh more in the consumer’s mind when assessing a product. In the alimentary field, they sustain the first intrinsic attribute to analyze is the product’s appearance, which tends to influence directly on their perception. In the same sense, Chao-Sen (Citation2015) stands by the design as more than just a simple representation, since it symbolizes a valuable signal, attracting the consumer and strengthening the perceived image.
Fisher, Du Rand, and Erasmus (Citation2012) emphasize the need to use product signals correctly, to communicate a message that can awaken the consumer’s attention. Zimmerman and Shimoga (Citation2014) agree that the design is an element that influences the determination of the product’s perceived value. However, they point out the consumer also considers other intrinsic variables such as portion size, how healthy it is, as well as being influenced by the behavior of other individuals.
In this way, Ergönül and Ergönül (Citation2015) explain that signals motivating organic consumption and influencing directly during product selection are linked to both functional elements like health, and extrinsic properties such as quality assurance, origin safety and pricing. Thus, Lim, Yong, and Suryadi (Citation2014) illustrate that even when the perception is related to the value attributed to the characteristics of the product, the consumer keeps track of the expenses that result from the purchase.
Jaramillo (Citation2016) describes how the consumer acquires the product due to their intrinsic characteristics and information about health and environmental benefits they offer. Moreover, flavor is an important factor, followed by the quality and freshness of the consumables used during its production. The Food and Agriculture Organization (FAO Citation2017) emphasize that the nutritional quality refers to the attributes of the product in terms of nutrients and energy intake. Continuing with this order of ideas, we propose the following hypotheses:
H1a. Intrinsic signals perceived of an organic product as the tortilla are positively and directly related to expected health quality.
H1b. Intrinsic signals perceived of an organic product as the tortilla are positively and directly related to expected nutritional quality.
H1c. Intrinsic signals perceived of an organic product as the tortilla are positively and directly related to expected sensory quality.
H1d. Intrinsic signals perceived of an organic product as the tortilla are positively and directly related to expected convenience quality.
H1e. Intrinsic signals perceived of an organic product as the tortilla are positively and directly related to expected process quality.
Pricing becomes an extrinsic factor determining the decision-making process and affecting the satisfaction when the product’s benefits turn out to be insufficient for the buyer. Bezawanda and Pauwels (Citation2013) explain that the price is an indicator of the relationship between cost and benefit; the consumer expects products to deliver a higher value to make up for the price they are willing to pay. Hence, if the price is too high the buyer might reconsider purchasing the product if the advantages are unknown.
In case of organics, Iyer, Davaru and Paswan (Citation2016) argue that consumers usually consider the price of these products to be very high, so before deciding whether they buy them or not, they conduct an internal evaluation where they suppose there should exist an equivalent or higher number of benefits justifying the purchase.
From another perspective, Araque, Montero, Rivera, and Aragon (Citation2015) show health and environmental benefits are elements that determine the quality and take part in the product assessment process. Focusing on that, Vega, Torres, Murgado, and Parras (Citation2014) claim that when the components of an organic product (such as nutrients) contribute to health, the perception of the customer improves along with its quality.
Vega, Parras, Murgado, and Torres (Citation2013) assert that the value attributed to the product’s quality depends on extrinsic signals such as health, process quality, nutrients and legitimacy of its origin. Nevertheless, Llamas (Citation2009) details how the product’s process is an important element for the consumer since being able to confirm the usage of quality controls makes it easier to choose whether to buy a product or not.
On the other hand, Ahmed and Byker (Citation2017) mention that in the alimentary context, the sensorial attributes of the food are those that determine the quality of the product and therefore, exert a mediating effect on the purchase decisions. However, Fernández-Ferrín, Bande, Calvo-Turrientes, and Galán-Ladero (Citation2017) emphasize that the ease with which the consumer can acquire and prepare a food, for example, a local product, is a determinant factor of the significant quality since it suggests a natural food. In that sense, the following hypothesis states that:
H2a. Extrinsic signals perceived of an organic product as the tortilla are positively and directly related to expected health quality.
H2b. Extrinsic signals perceived of an organic product as the tortilla are positively and directly related to expected nutritional quality.
H2c. Extrinsic signals perceived of an organic product as the tortilla are positively and directly related to expected sensory quality.
H2d. Extrinsic signals perceived of an organic product as the tortilla are positively and directly related to expected convenience quality.
H2e. Extrinsic signals perceived of an organic product as the tortilla are positively and directly related to expected process quality.
2.5. Relationship between the organic product signals and the expected quality
For purposes of this study, the consumer’s expectations are analyzed in function of the expected quality, according to Ruiz and Parreño (Citation2013) they are the prospects the consumer makes up in his mind about what he hopes to receive from a product during the purchase. In that sense, Salgado and Espejel (Citation2016) define five dimensions of the expected quality: expected convenience quality, expected sanitary quality, expected process quality, expected sensory quality and expected nutritional quality (see Figure ).
Figure 2. Structural model proposed with hypothesis. Source: Salgado and Espejel (Citation2016).
Related to the convenience quality, Krajewski and Ritzman (Citation2000) outline it comprises the inherent functions of the product, which from the consumer’s perspective they are more comfortable, such as product preservation. On the other hand, sanitary and process quality relate to the production stage. The World Health Organization (WHO, Citation2015) defines sanitary quality as the adequate performance of the processes to optimize the handling of the resources and improve the user’s safety by decreasing the risks of using external agents such as chemicals. Dolly (Citation2007) explains that quality is a process linked to different controls established during the planning of activities which allow delivering a product with specific characteristics to fulfill the expectations of the customer. As for sensory quality, Costell (Citation2005) says it involves attributes assessed by the customer, to compare and differentiate it from other products. At that point, he takes those he considers to be better and relate to its preferences.
Gneezy, Gneezy, and Lauga (Citation2014) mention that quality keeps a close relationship with extrinsic attributes such as pricing, where each variation impacts the consumer’s expectations. Therefore, a high price product supposes a higher quality indicator and it fulfills the consumer’s expectations. In agreement with this affirmation, Rong-Da (Citation2016) states that the price is the attribute with superior assessment and it symbolizes a safe signal since it guarantees extrinsic attributes like quality are good.
Atanasoaie (Citation2012) revealed how when establishing a pricing rate one must first explain and convince the consumer about the product’s benefits as related to its value and attribute quality. In the same sense, Islam (Citation2014) supports the fact that organic products are sold at higher prices because the consumer has already proven how organic products have a superior quality to those produced in a conventional way. So, they are confident that paying a higher price is justifiable.
2.6. Relationship between the organic product’s expected quality and the purchasing intention
Marty et al. (Citation2015) explain that quality among food products is an element that forms the basis of the positive association between food expenditure. Thus, in food-purchasing behavior, it is possible to identify purchased higher-quality food and characterize consumer´s choices. According to Menozzi, Halawany-Darson, Mora, and Giraud (Citation2015) consumers tend to be careful when evaluating the product because they feel motivated by the quality they expect to find in it. Under this premise, they examine the food exhaustively before making their purchase, so, at the time of acquiring the product they will perceive that quality and trust it, which will later result in a greater purchase intention.
Grunert, Hieke, and Wills (Citation2014) exposed how the inherent characteristics of the product play an important role in the behavior of the consumer during the process of evaluation before making the decision to consume. As a result, the authors indicate that quality attributes such as the brand, information written in the package or the price, exert a positive impact over knowledge and motivation, two elements that intervene during the decision-making process.
On the other hand, Buaprommee and Polyorat (Citation2016) argue that consumers have a quality consciousness that is deeply related to the different levels of relevance that are assigned to the product’s quality. In this sense, the higher the level of quality consciousness they have, the greater the consumer’s interest in looking for high-value food products. Therefore, quality directly influences consumer behavior and purchase decision-making. For the above, Campbell (Citation2013) points out that food availability is an attribute that is associated with the purchase intention of sustainable, local and natural products. Therefore, the consumer is willing to accept the relative difficulty of preparing the food in exchange for enjoying other quality attributes such as sensory, health, taste, nutritional value and that the product is elaborated under a natural process.
Additionally, Baker, McCabe, Swithers, Payne, and Kranz (Citation2015) indicate that the preference that consumers have when choosing any food product is directly influenced by the quality they expect to find in sensory appeal. In this regard, sensory appeal refers to the physical attributes of the product such as taste, appearance, texture and smell, which motivate the desire to buy. For all of the above reasons, we established the following hypothesis:
H3. There is a positive relationship between expected health quality and purchase intent.
H4. There is a positive relationship between expected nutritional quality and purchase intent.
H5. There is a positive relationship between expected sensory quality and purchase intent.
H6. There is a positive relationship between expected convenience quality and purchase intent.
H7. There is a positive relationship between expected process quality and purchase intent.
3. Methodology
3.1. Sample
To tackle our research objectives, we present a research file in the . We explain general information about universe, sample unit, geographic area, method, survey and details collection.
Table 1. Research file
3.2. Structural model proposed using a hypothesis
The structural model intended to prove is the one proposed by Salgado and Espejel (Citation2016) in which they assess two dimensions: consumer perception and expectation around a product; In this case, we adjusted the characteristics of the organic tortilla. In a way, that perception corresponds to the product’s intrinsic and extrinsic signals, whereas the expectation comprehends the different types of the product’s expected quality. Therefore, we seek to determine the existing relationship between dimensions by measuring its eight concepts and the impact they generate over the purchasing intention for such products.
3.3. Instrument design
The instrument consisted of a questionnaire designed based on the model of structural equations by partial least squares, from now on PLS. It comprehended eight concepts: intrinsic signals perceived, extrinsic signals perceived, expected sanitary quality, expected nutritional quality, expected sensory quality, expected convenience quality and expected process quality, which all together impact on the purchasing intention. (Salgado & Espejel, Citation2016). In that sense, 72 variables detached under a 7-level Likert Scale, oriented to measure the previous concepts (see Table ).
Table 2. Operationalization of the questionnaire items
By going through the variables that compose the questionnaire, we look to understand how the consumer perceives the intrinsic and extrinsic signals of the organic tortilla. In a second stance, the consumer’s expectations revolving around the attributes they wish to find as indicators of the five types of quality products. In third place, the degree of importance assigned to each of the intrinsic and extrinsic signals of the product to identify those acting as purchasing motivators (Salgado and Espejel, Citation2016).
3.4. Validity of the instrument
Due to the item adjustment and the inclusion of new variables in the questionnaire, we needed to conduct the validation of the content and asses the level of reliability of the measuring scales (Espinoza, Sanhueza, Ramirez and Saez, Citation2015). To validate the content we analyzed and refined the items of the PLS model by Salgado and Espejel (Citation2016), as well as the structural equation model (SEM) proposed by Leon, Espejel and De la Serna (Citation2016). We also used an in-depth focus group and interview techniques to present items according to the product’s characteristics.
Malhotra (Citation2008) suggests conducting a pilot test in order to prove the questionnaire before applying it to the target population. Therefore, on March 2017, we applied the instrument to 33 individuals, between 10 am and 12 pm inside the market. As far as the reliability scale goes, Frías (Citation2014) supports the idea of using Cronbach’s Alpha Reliability Coefficient to observe the degree of internal consistency among variables to determine if they, in fact, measure the concepts, where a value close to 1 indicates a high consistency between items. From the previous, we obtained the following data (see Table ).
Table 3. Analysis of Cronbach’s Alpha reliability coefficient
Based on the performed analysis, there is a positive correlation between the instrument’s scales. The coefficient of concepts possessing more internal consistency are: 0.756 in perceivable intrinsic signals, 0.934 regarding the expected sanitary quality, 0.744 on expected process quality and 0.904 on purchasing intention. Whereas the lowest values belong to 0.601 on perceivable extrinsic signals, 0.602 on expected sensory quality, 0.623 on expected convenience quality and 0.692 on the expected nutritional quality.
George and Mallery (Citation2003) state that Cronbach’s Alpha value can be considered acceptable if it is higher than 0.7 However, Huh, Delorme, and Reid (Citation2006) agree that when the exploratory studies demonstrate values that are equal or superior to 0.6 can also validate the instrument. In that sense, the concepts do possess internal consistency and the instrument is in fact valid.
3.5. Statistical technique
The database was examined with the aid of statistic packages IBM-SPSS Statistic Base, STATA SE 13.0 Base, and SmartPLS Professional. According to Vilalta (Citation2016), we used descriptive statistics to study demographic variables, as well as central tendency measurements and dispersion to analyze the scale’s values. In order to shape the distribution, we resorted to the Shapiro-Wilk normality test.
In reference to the study of correlations between the different concept variables, we followed the methodology proposed by Salgado and Espejel (Citation2016) using multivariate analysis as the correlation coefficient by Pearson and the PLS Technique. Lastly, we eliminated the variables and concepts with low significance to create a PLS model capable of predicting the purchasing intention of organic tortillas.
4. Analysis of the results
4.1. Descriptive analysis
Based on the data obtained from the surveys, we built a crosstab matrix to find out characteristics of the sample (386 consumers). We identified that even when the number of men and women was similar; the Female group was wider, since it represented 50.78% of the respondents, in comparison to the male group which accounted for 49.22% of the total sample population. In reference to the level of studies, most of the consumers have a degree, 51.30% of the total sample, followed by those who accomplished a high school diploma, which represents 29.79% of the total (see Table ).
Table 4. Demographics of the consumers surveyed
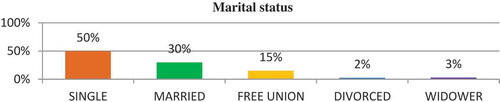
Referring to the marital status of the consumers, Figure shows that 50% of the sample population was single, 30% was married and 15% have a free union. Meanwhile, the widowers and the divorced represent a 2% and 3% minority, respectively.
Figure 3. Marital status.
In relation to the income level, Figure demonstrates that 26% of the people earn less than $5,000 a month, 30% represents those who earn between $5,000 and 10,000; 27% of the sample earn between $11,000 and $15,000. The remaining 17% belongs to a small group of consumers with a monthly income of $16,000 to $36,000 and on.
Figure 4. Income level.
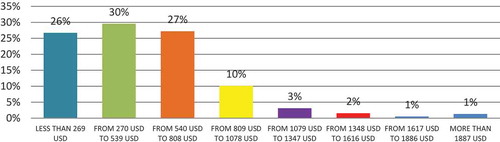
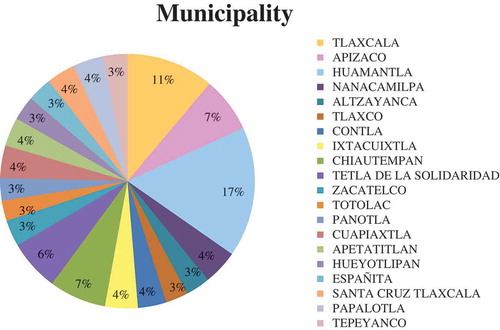
Figure displays the municipalities of origin, where the predominant group comes from Huamantla, representing 17% of the sample, people living in Tlaxcala represent 11% of the sample, and those residing in Apizaco and Chiautempan each represent a 7% of the total.
Figure 5. Municipality of origin.
4.2. Normality test
Martin, Lafuente, and Faura (Citation2015) advise demonstrating the distribution prior to conducting the statistical analysis. Guisande, Vaamonde, and Barreiro (Citation2013) state that the most reliable test to measure the variable’s normality is the Shapiro-Wilk test. The test compares the value of W to a critical value according to the level of significance, which is usually 5% and establishes a null hypothesis signaling a normal distribution when the value of P is higher than 0.05 (see Table ).
Table 5. Shapiro-Wilk test
According to the values obtained in the previous table, given the value of P (PROB>Z) for each of the 74 variables of the model is lower than 5% the hypothesis is rendered null and void, hence it indicates an asymmetric distribution.
4.3. Pearson’s correlation coefficient
Guisande et al. (Citation2013) explain that in order to measure the relationship between two variables we can use Pearson’s correlation coefficient (r). It allows us to observe the magnitude of the relationship between each pair of variables and the level of dependency they have. Values closer to −1 and 1 show a strong correlation. Given that the coefficients obtained in the present study match the acceptable range, and the significance level remains below 5%, the variables subjected to measurement are related and relevant.
4.4. Item analysis by construct using tendency measurements and deviation
According to Mendenhall, Beaver, and Beaver (Citation2013) standard deviation allow us to observe the distance between any items from a sample as related to the average. In Table , the scores of each item are 1 to 2 standard deviations away from the average, and the polled sample assigned a superior value to 4 of the attributes of the tortilla from a 7-point scale, which shows a positive score.
Table 6. Averages and standard deviation of the items by construct
We used an arithmetic mean to identify the characteristics of greater impact on the consumer, locating the highest values among variables. Hence, the intrinsic signals that had a greater impact on the consumer were freshness, consistency, and flavor, while the extrinsic signals with the highest effect were the producer’s reputation, followed by the package size and the price.
Following the methodology of Vilalta (Citation2016) the inherent attributes of the organic tortilla that generate the highest expectations are: in the expected sanitary quality that the product is free of chemicals; in the expected nutritional quality the nutritional value; in the expected sensory quality flavor, freshness and consistency; in the expected convenience quality o, the ease of preservation of the product and in the expected process quality that the production process is natural, has quality controls and is ecological.
Also, these results indicate that the elements that generate the highest expectations in the consumer regarding the expected sanitary quality are that the product is free of chemicals. Of the nutritional quality expected the nutritional value; of the expected sensory quality is the flavor and freshness of the product. From the expected convenience, the preservation of the product and the expected process quality, the quality controls and that it is ecological.
It is important to point out that the expected quality in the expectation dimension has means superior to those of the perception dimension. Although the consumer positively qualified the physical and inherent characteristics of the organic tortilla, it expects to receive better attributes in color and shape of the product, as well as a better packaging design that does not harm the environment.
4.5. Multivariate analysis tests
According to Salgado and Espejel (Citation2016), the model is composed of eight constructs of reflective nature; in the dimension of perception are the intrinsic and extrinsic signals. In the dimension of expectation are the expected quality of health, nutrition, sensory, convenience and process. The constructs quantify the impact that their variables exert on the purchase intention of the organic tortilla. Levy and Varela (Citation2006) point out that a reflective construct is one in which the variables explain the construct.
Hair, Anderson, Tatham, and Black (Citation1999) outline how this model helps indicate type of relationship between each group of variables, going through multiple variables to evaluate independent variables. At the same time, a structural model links the independent variables with the dependent ones. To this matter, Salgado and Espejel (Citation2016) highlight that the most suitable technique to quantify the existing relationship between constructs is through the multivariate statistic technique of Partial Least Squares (PLS).
Hair, Hult, Ringle, and Sarstedt (Citation2017) explain that to know the significance of the PLS structural model, the Bootstrapping technique must be used when applying the PLS algorithm. Therefore, we obtained the t-student test, the Path coefficient and the coefficient of determination R2 to know the type and magnitude of the relationships between the constructs. In this sense, the Path coefficient determines how each variable influences the constructs, as well as the type of relationship that exists from construct to construct, being significant when it approaches −1 or +1.
The R2 coefficient establishes to what extent the variance explains the variables, the higher its value, the better will the model explain the constructs. Meanwhile, the t-student test estimates the individual significance of the variables, where the null hypothesis states that a relationship is significant when the value is higher than 1.96 (Hair et al., Citation2017). Based on the above, we used a Bootstrapping on 500 subsamples and 500 maximum iterations to identify the variables with the most significant loads in each construct, obtaining the following:
Based on the Table , we observed values below 1.645 in 8 relationships, between the construct of extrinsic signals and the types of quality, as well as in the convenience, sanitary and nutritional quality and the intention of purchase. Thus, eight hypotheses are supported: H1a, H1c, H1d, H1e, H3, H5, H6 and H7. These results reveal that the inherent characteristics of the product (extrinsic signals) have no significant relationship with the other constructs. Therefore, we require a secondary confirmatory analysis (Figure ):
Table 7. Relationship analysis
Figure 6. Analysis of path coefficients- organic tortilla PLS model.
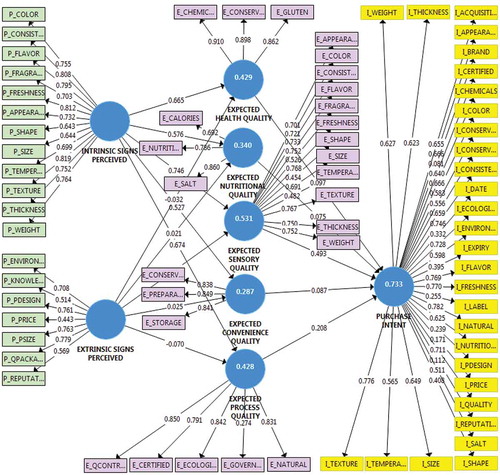
As in Figure , the relation between the extrinsic signals and the types of expected quality possess lower values (closer to 0 in all the cases). This confirms there does not exist a significant relation between the previously mentioned constructs and what is more interesting, the client does not consider the organic tortilla’s inherent characteristics as relevant when evaluation its intention to purchase them.
On the other hand, we conducted a comparison between the PSL model of the intention to purchase organic tortillas without intrinsic signals (Figure ) against the model without extrinsic signals (Figure ), in order to analyze the behavior of the variables and indicators. By eliminating the intrinsic signal construct loads change to positive; however, its relationship with the constructs of expected quality and the intention of purchase remain weak.
Figure 7. Tortilla organica PLS model—extrinsic signals perceived.
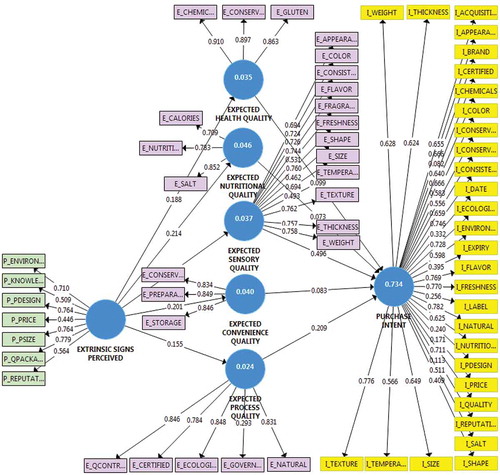
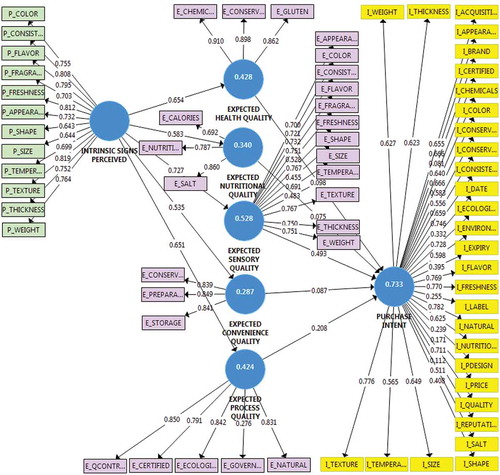
Likewise, the Path coefficients of extrinsic signals-expected quality and expected quality-purchase intention show values lower than 0.7, showing that the relationships are not significant. Therefore, the variables of the extrinsic signal construct are not able to explain the model and it is necessary to eliminate them. Then, we verified that the intrinsic signal model has better construct-construct and variable-construct indicators in Path coefficients and in R2 determination coefficients (Figure ):
The model was retaken with the construct of perceived intrinsic signals (Figure ) and eliminated both constructs and variables with Path coefficients lower than 0.6, to obtain an effective model with items that really influence the consumer when evaluating the product. Therefore, the new PLS model has Path coefficients of 0.722 between the perceived intrinsic signals and the expected sensory quality, as well as 0.833 between the expected sensory quality and the purchase intention.
Figure 8. Organic tortilla PLS model—perceived intrinsic signals.
In addition, the Figure indicates a strong relationship between the dimensions and a high level of prediction of the purchasing intention. Likewise, we obtained a Normalized Adjustment Index (NFI) of 0.782, which according to Garcia, Garcia, and Domenge (Citation2012) being a value closer to 1 and by the size of the sample, the model’s data adjustment is reasonable. Finally, the PLS model of the organic tortilla’s purchasing intention is defined in Figure :
Figure 9. PLS model about the purchase intention of the organic tortilla.
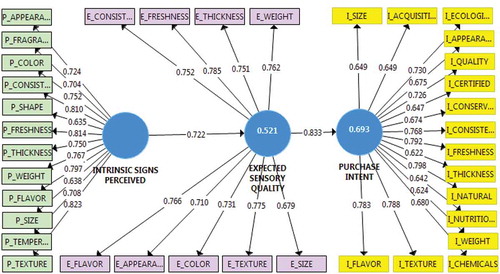
Using the model presented in Figure , the 12 original intrinsic signals that directly impact the expectations of the consumer of organic tortillas are conserved. However, only the sensory quality construct expected through nine variables turns out to be significant for the model. Table contains the three items with the strongest loads in each construct, which exert a high impact on the purchase intention:
Table 8. Items of greater impact in the organic tortilla PLS model
On Table , we can identify two high-impact items that coincide in the three model constructs, these being the texture and the freshness of the organic tortilla, taken as a justification of the intention to purchase the product. It should be noted that the achieved results represent an important finding on this subject, since in this case, the consumer weighs more on the quality of physical characteristics of the product rather than on the packaging design, the brand or its price.
5. Discussion
The given research analyzes the relation that exists between the perceptions and the expectations of the consumer around the characteristics of the organic tortilla offered in the Alternative Market of Tlaxcala. The model of structural equations is used to evaluate the attributes of this food and measure the impact exerted by the intrinsic and extrinsic signals of the product, as well as the expected quality on the purchase intention.
By analyzing the measurements of central tendencies and the statistical tests of multivariate analysis we obtained interesting results that allow us to validate two of the four proposed hypothesis. First of all, we detect that appearance and size were the intrinsic signals with higher impact over the consumer’s perception, while the price was the extrinsic signal with higher impact over perception.
We found that in spite of what was stated based on the existing theory, the intrinsic signals belonging to the organic tortilla that impose a greater impact on consumers are freshness, consistency and flavor. Whereas, the extrinsic signals with greater impact on the consumer’s perception is the producer’s reputation, followed by the packaging size and in a third place, the price of the product.
On the other hand, this study indicates that the elements that generate the highest expectations in the consumer regarding the expected sanitary quality are that the product is free of chemicals. Of the expected nutritional quality, the nutritional value of the product; of the expected sensory quality, flavor and freshness. Of the expected convenience, the preservation of the product and the expected quality process, the quality controls during the production process and the product being ecological.
We fail to reject H1a, H1c, H1d and H1e because there is a positive relationship between intrinsic signals perceived by the consumer and the expected health quality, expected nutritional quality, expected sensory quality, expected convenience quality and expected process quality. The model shows that the extrinsic signals have negative and insignificant coefficients, which is why they were eliminated from the final model. Likewise, H3, H5, H6 and H7 were validated; because it indicates that there is a positive relationship between the elements that shape the expected quality (health, sensory, convenience and process) toward to purchase intention of the organic product.
An early finding shows other attributes exerting influence over the consumer’s expectation, the consistency of the organic tortilla is a variable among the sensory quality area and the product resulting from a natural production process a variable among the process quality. Other important factors are the attributes that improve the expectation of the quality such as flavor, freshness, the product being free from preservatives, with a natural production process and having quality controls.
A second finding states that the extrinsic signals are not causal of the purchase intention of the organic tortilla. Therefore, the consumer attaches greater importance to intrinsic type signals such as the quality of the physical characteristics of the product and gives less weight to extrinsic elements such as the design and material of the package, the tortilla brand or the price. The final PLS model shows that the items with the greatest impact that coincide in the three dimensions, especially the purchase intention, are the texture and freshness of the product.
The tortilla is a product of great relevance for Mexicans since it constitutes a staple of their basic diet and is a star product by excellence. However, to this date, there is no record of research related to this product, so this investigation contributes to the consumer’s behavior in relation to the knowledge in the subject of the perception of the organic tortilla.
6. Conclusion and recommendations
The Alternative Market of Tlaxcala, Mexico is made up of companies that produce and commercialize organic products of agricultural and livestock origin. It has experienced a decline in the number of people who buy one of their best products, the organic tortilla. Therefore, the objective of this research was to analyze consumer expectations and perceptions through the measurement of the intrinsic, extrinsic signals and the expected quality of the organic tortilla to evaluate its impact on the purchase intention.
The flavor and freshness are considered attributes that influence expectations about quality, as well as food being free from preservatives, coming produced in a natural process and having quality controls. We created a new PLS model showing Texture and Freshness as the items with the greatest impact on the resulting constructs, especially on the purchase intention.
It is necessary to emphasize that the signals of the product with the lowest values were the color, the shape, the design of the package and its environmental impact. In addition, the dimension of expectation had higher scores than the perception, which means the consumer expects to obtain better attributes than those currently received. Therefore, we conclude that the intrinsic signals of the perception dimension, as well as the expected sensory quality of the expectation dimension, have a direct impact on the purchase intention of the organic tortilla.
This represents an opportunity area for the organic sector. We propose conducting an evaluation about what do companies offer and what does the consumer looks for in the product, to highlight the attributes of greatest interest for the market of the organic tortilla and improve those that do not satisfy the costumer’s expectations. It is important to consider new marketing strategies to improve the customer’s perception and increase the knowledge about the benefits they could acquire when consuming this type of products. Lastly, the given research, aside from favoring companies in the Alternative Market and the consumer, generates a triple impact.
From the social perspective, it generates greater knowledge for the Mexican population regarding the attributes contained in this product, which by obtaining this type of information can follow this trend and eat healthier or better quality food. In the economic aspect, it promotes the local organic produce that is the source of income of diverse families and the creation of jobs in the matter of production. In the ecological field, it respects the conservation of natural resources and reduces the health risks caused by the excessive use of agrochemicals.
Finally, future researches should attend other variables such as the price factor on the perception of the product and the quality of the expected service. To perform a sensory analysis on the perception of flavors and preferences to make recommendations on the modification of the product would be interesting. Similarly, it is proposed to carry out similar studies to other organic products (dairy products, cosmetics, among others) in different regions, for example in Mexico City or Monterrey), where there is greater consumption.
Additional information
Funding
Notes on contributors
Brenda Patricia Gallegos-Hernández
Brenda Patricia Gallegos-Hernández is working in the private industry making marketing strategies. The focus of her research is aimed to build marketing strategies in organic products.
Héctor Hugo Pérez-Villarreal
Héctor Hugo Pérez-Villarreal is currently a full-time professor and researcher at Universidad Popular Autónoma del Estado de Puebla (Mexico). His research interests include marketing strategies, agro-food marketing and customer satisfaction.
Igor Barahona
Igor Barahona is currently a full-time professor and researcher at Universidad Nacional Autónoma de México (Catedras CONACYT). His research interests include Multivariate statistics in applied economics.
Yesica Mayett-Moreno
Yesica Mayett-Moreno is currently Director of the Graduate School of Business and researcher at Universidad Popular Autónoma del Estado de Puebla. Her research interests include management, organizational culture, marketing research and agribusiness.
Related Research Data
References
- Ahmed, S., & Byker, C. (2017). Quality of vegetables based on total phenolic concentration is lower in more rural consumer food environments in a rural american state. International Journal of Environmental Research and Public Health, 14(8), 1–9.
- Anwar, A., & Jan, S. (2016). Consumer attitude towards the marketing-mix of the green products. International Journal of Research in Commerce & Management, 7(2), 86–90.
- Araque, R., Montero, M., Rivera, P., & Aragón, C. (2015). Moderating the relationship between price and perceived value of ethical products. Journal of Agricultural and Environmental Ethics, 28(2), 217–230. doi:10.1007/s10806-014-9528-5
- Atanasoaie, G. (2012). Price on the organic food market. Annals of the University of Petroşani. Economics, 12(4), 5–16.
- Baker, S., McCabe, S., Swithers, S., Payne, C., & Kranz, S. (2015). Do healthy, child-friendly fruit and vegetable snacks appeal to consumers? A field study exploring adult’s perceptions and purchase intentions. Food Qual Preference, 39, 202–208. doi:10.1016/j.foodqual.2014.07.013
- Bartels, J., Reinders, M., Sen, S., & Du, S. (2015). A cross-country investigation of organic consumption behavior: A social identification perspective. Asia-Pacific Advances in Consumer Research, 11, 130–133.
- Bezawada, R., & Pauwels, K. (2013). What is special about marketing organic products? How organic assortment, price, and promotions drive retailer performance. Journal of Marketing, 77, 31–51. doi:10.1509/jm.10.0229
- Bi, X., Gao, Z., House, L., & Hausmann, D. (2015). Tradeoffs between sensory attributes and organic labels: The case of orange juice. International Journal of Consumer Studies, 39, 162–171. doi:10.1111/ijcs.2015.39.issue-2
- Buaprommee, N., & Polyorat, K. (2016). The antecedents of purchase intention of meat with traceability in Thai consumers. Asia Pacific Management Review, 21(3), 161–169. doi:10.1016/j.apmrv.2016.03.001
- Campbell, J. M. (2013). Muy local: Differentiating hispanic and caucasian shoppers of locally produced foods in US grocery. Journal of Retailing and Consumers Services, 20, 325–333. doi:10.1016/j.jretconser.2013.01.009
- Chao-Sen, W. (2015). A study on consumers’ attitude towards brand image, athletes’ endorsement, and purchase intention. International Journal of Organizational Innovation, 8(2), 233–253.
- Chih-Ching, T., & Yu-Mei, W. (2015). Decisional factors driving organic food consumption generation of consumer purchase intentions. British Food Journal, 117(3), 1066–1081. doi:10.1108/BFJ-12-2013-0361
- Corchs, S., Ciocca, G., Bricolo, E., & Gasparini, F. (2016). Predicting complexity perception of real world images. PloS one, 11(6), 1–22. doi:10.1371/journal.pone.0157986
- Costell, E. (2005). El análisis sensorial en el control y aseguramiento de la calidad de los alimentos: Una posibilidad real. Centro Tecnológico Nacional de la Conserva y Alimentación, 23, 10–17.
- Dolly, B. (2007). Administración de servicios de alimentación: Calidad, nutrición, productividad y beneficios . Medellín: Editorial Universidad de Antioquia.
- Ergönül, B., & Ergönül, P. (2015). Consumer motivation for organic food consumption. Emirates. Journal of Food and Agriculture, 27(5), 416–422.
- Espinoza, M., Sanhueza, O., Ramírez, N., & Sáez, K. (2015). Validación de constructo y confiabilidad de la escala de inteligencia emocional en estudiantes de enfermería. Revista latino-americana de enfermagem, 23(1), 139–147. doi:10.1590/0104-1169.3498.2535
- Fernández-Ferrín, P., Bande, B., Calvo-Turrientes, A., & Galán-Ladero, M. (2017). The choice of local food products by young consumers: The importance of public and private attributes. Agribusiness, 33(1), 70–84. doi:10.1002/agr.v33.1
- Fisher, H., Du Rand, G., & Erasmus, A. (2012). The power of food images to communicate important information to consumers. International Journal of Consumer Studies, 36(4), 440–450. doi:10.1111/j.1470-6431.2011.01068
- Food and Agriculture Organization of the United Nations. (2017). Evidence- informed policies and decisions considering multiple factors. FAO Guidance Materials. Retrieved from http://www.fao.org/3/i8240en/I8240EN.pdf
- Frías, D. (2014). Apuntes de SPSS . Valencia: Universidad de Valencia.
- García, J., García, P., & Domenge, R. (2012). Determinantes de la estructura de capital en la pequeña y mediana empresa familiar en México. Contaduría y Administración, 57(3), 67–96.
- Gbadamosi, A. (2016). Handbook of research on consumerism and buying behavior in developing nations. Hershey, PA: IGI Global.
- George, D., & Mallery, P. (2003). SPSS for windows step by step: A simple guide and reference. 11.0 update (4th ed.). Allyn & Bacon: Boston.
- Gneezy, A., Gneezy, U., & Lauga, D. (2014). A reference dependent model of the price – Quality heuristic. Journal of Marketing Research, 51, 153–164. doi:10.1509/jmr.12.0407
- Grunert, K., Hieke, S., & Wills, J. (2014). Sustainability labels on food products: Consumer motivation, understanding and use. Food Policy, 44, 177–189. doi:10.1016/j.foodpol.2013.12.001
- Guisande, C., Vaamonde, A., & Barreiro, A. (2013). Tratamiento de datos con R, Statistica y SPSS (1a ed.). España: Ediciones Díaz de Santos.
- Hair, J., Anderson, R., Tatham, R., & Black, W. (1999). Análisis multivariante. Madrid: Pearson Educación.
- Hair, J., Bush, R., & Ortinau, D. (2010). Un ambiente de información digital (4a ed.). México, D.F.: Mc Graw-Hill Interamericana.
- Hair, J., Hult, G., Ringle, C., & Sarstedt, M. (2017). A primer on Partial Least Squares Structural Equation Modeling (PLS-SEM) (2a ed.). USA: SAGE.
- Huh, J., Delorme, D., & Reid, L. (2006). Perceived third-person effects and consumer attitudes on preventing and banning DTC advertising. Journal of Consumer Affairs, 40(1), 90–104. doi:10.1111/j.1745-6606.2006.00047.x
- Islam, S. (2014). Marketing organic foods through conventional retail outlets. Journal of Marketing Development and Competitiveness, 8(1), 98–112.
- Iyer, P., Davari, A., & Paswan, A. (2016). Green products: Altruism, economics, price fairness and purchase intention. Social Business, 6(1), 39–64. doi:10.1362/204440816X14636485174912
- Jaramillo, J. (2016). Preferencias del consumidor y disposición a pagar por el consumo de tortilla de maíz orgánico. Estudios sociales, 47, 145–161.
- Kiss, M., Kontor, E., & Kun, A. I. (2015). The effect of “organic” labels on consumer perception of chocolates. Annals of the University of Oradea, Economic Science Series, 24(1), 448–457.
- Krajewski, L., & Ritzman, L. (2000). Administración de operaciones: Estrategia y análisis.Naucalpan de Juárez, Edo. de México: Pearson Educación. .
- León, P., Espejel, J., & De la Serna, I. (2016). Modelo causal moderado por el conocimiento en la intención de compra de alimentos orgánicos no procesados de los habitantes en pobreza extrema en la zona urbana de Hermosillo, Sonora, México. Perspectiva Empresarial, 3(2), 71–81.
- Lévy, J. P., & Varela, J. (2006). Modelización con estructuras de covarianzas en Ciencias Sociales: Temas esenciales, avanzados y aportaciones especiales (1a ed.). España: Netbiblo.
- Liang, R. (2016). Predicting intentions to purchase organic food: The moderating effects of organic food prices. British Food Journal, 118(1), 183–199. doi:10.1108/BFJ-06-2015-0215
- Lim, W., Yong, J., & Suryadi, K. (2014). Consumers’ perceived value and willingness to purchase organic food. Journal of Global Marketing, 27, 298–307. doi:10.1080/08911762.2014.931501
- Llamas, C. (2009). Marketing y gestión de la calidad turística. Madrid: Editorial Liber Factory.
- Malhotra, N. (2008). Investigación de mercados (5a ed.). México: Pearson Educación.
- Martín, P., Lafuente, M., & Faura, U. (2015). Guía práctica de Estadística aplicada a la empresa y al marketing (1a ed.). España: Ediciones Paraninfo, S.A.
- Marty, L., Dubois, C., Gaubard, M. S., Maidon, A., Lesturgeon, A., Gaigi, H., & Darmon, N. (2015). Higher nutritional quality at no additional cost among low-income households: Insights from food purchases of “positive deviants”. The American Journal of Clinical Nutrition, 102(1), 190–198. doi:10.3945/ajcn.114.104380
- Mendenhall, W., Beaver, R., & Beaver, B. (2013). Introduction to probability and statistics. Belmont, CA: Cengage Learning.
- Menozzi, D., Halawany-Darson, R., Mora, C., & Giraud, G. (2015). Motives towards traceable food choice: A comparison between French and Italian consumers. Food Control, 49, 40–48. doi:10.1016/j.foodcont.2013.09.006
- Mohd Suki, N. (2018). Determinants of consumers’ purchase intentions of organic vegetables: Some insights from Malaysia. Journal of Food Products Marketing, 24(4), 392–412. doi:10.1080/10454446.2017.1280717
- Nasir, V., & Karakaya, F. (2014). Underlying motivations of organic food purchase intentions. Agribusiness, 30(3), 290–308. doi:10.1002/agr.v30.3
- Paul, J., & Rana, J. (2012). Consumer behavior and purchase intention for organic food. Journal of Consumer Marketing, 29(6), 412–422. doi:10.1108/07363761211259223
- Pearson, D., Henryks, J., Sultan, P., & Anisimova, T. (2013). Organic food: Exploring purchase frequency to explain consumer behaviour. Journal of Organic Systems, 8(2), 50–63.
- Roldán, H. N., Gracia, M. A., Santana, M. E., & Horbath, J. E. (2016). Los mercados orgánicos en México como escenarios de construcción social de alternativas. Revista Académica Universidad Bolivariana Polis, 43(1), 1–18.
- Rong-Da, L. (2016). Predicting intentions to purchase organic food: The moderating effects of organic food prices. British Food Journal, 118(1), 183–199. doi:10.1108/BFJ-06-2015-0215
- Ruiz, E., & Parreño, J. (2013). Dirección de marketing: Variables comerciales . San Vicente, Alicante: Editorial Club Universitario.
- Salgado, L., & Espejel, J. (2016). Análisis del estudio de las relaciones causales en el marketing. Innovar, 26(62), 79–94. Retrieved from https://search.proquest.com/docview/1837592336?accountid=17195
- Sampaio, D. D. O., & Gosling, M. (2015). Intent to purchase and consumption of organic food in minas gerais, brazil. Revista Portuguesa De Marketing, 38(34), 9–22. Retrieved from https://search.proquest.com/docview/1780979887?accountid=17195
- Schwentesius, R., Gómez, M. A., Ortigoza, J., & Gómez, L. (2014). México orgánico. Situación y perspectivas. Agroecología, 9(1–2), 7–15.
- Secretary of Agriculture, Stockbreeding, Rural Development, Fishing and Feeding. (2016). Qué es el sello Orgánico Sagarpa México y cómo obtenerlo. Retrieved from http://www.sagarpa.gob.mx/Delegaciones/coahuila/boletines/Paginas/2016B124.aspx
- CNPO, 2017 by SAGARPA. (2017). SAGARPA activities report (2016–2017). Retrieved from https://www.gob.mx/cms/uploads/attachment/file/255710/5TO_INFORME_2017_web.pdf
- Shu-Yen, H., Chiao-Chen, C., & Tyrone, L. (2016). An analysis of purchase intentions toward organic food on health consciousness and food safety with/under structural equation modeling. British Food Journal, 118(1), 200–216. doi:10.1108/BFJ-11-2014-0376
- Vega, M., Parras, M., Murgado, E., & Torres, F. (2013). The influence of the term ‘organic’ on organic food purchasing behavior. Procedia - Social and Behavioral Sciences, 81, 660–671. doi:10.1016/j.sbspro.2013.06.493
- Vega, M., Torres, F. J., Murgado, E., & Parras, M. (2014). Organic as a heuristic cue: What Spanish consumers mean by organic foods. Psychology and Marketing, 31(5), 349–359. doi:10.1002/mar.20699
- Vilalta, C. (2016). Análisis de datos (1a ed.). México: Centro de Investigación y Docencia Económicas.
- Willer, H., & Kilcher, L. (2012). The world of organic agriculture- statistics and emerging trends 2012 (pp. 25–32). Rheinbreitbach: Die Deutsche Bibliothek.
- World Health Organization. (2015). How safe is your food? From farm to plate, make food safe. Campaign tool kit. Retrieved from http://www.who.int/campaigns/world-health-day/2015/campaign-toolkit.pdf?ua=1
- Zimmerman, F., & Shimoga, S. (2014). The effects of food advertising and cognitive load on food choices. BMC Public Health, 14, 342. doi:10.1186/1471-2458-14-342