
Abstract
This study investigates the effect of integrated global supply chains and port characteristics toward a strategic alliance, strategic Alliance on port strategies such as maritime accessibility, physical port infrastructure, integrated information technology system, and terminal handling charge, and port strategy on port performance. Data were collected through the online and direct survey from 210 respondents made up of practitioners and port experts in Indonesia. To test the model, structural equation modeling was applied by using Lisrel 8.8. The results show that integrated global supply chain and port characteristics have a positive impact on strategic alliances which, in turn, has a positive impact on the development of maritime accessibility, physical port infrastructure, integrated information technology system, and terminal handling charge. However, not all of these factors have a significant impact on: only maritime accessibility and physical port infrastructure have positive impacts while integrated information technology system and terminal handling charge have no significant impact on Port performance.
PUBLIC INTEREST STATEMENT
This study focuses on how integrated global supply chain and port characteristics affects port Strategic Alliance to increase port performance. The Indonesia Port becomes a case study because it has implemented the reform port governance and strategic alliance to enhance port performance. This research will assess the effect of strategic alliance on ports strategies such as maritime accessibility, physical infrastructure, integrated information technology system, and competitive terminal handling charge to increase port performance, especially utility, efficiency, and throughput. Therefore, the port of Indonesia can be more competitive compared with ports in other countries in the World and customers of the port, both export and import, will receive satisfactory services if they use the Indonesia Port.
1. Introduction
The challenge of the maritime industry in the near future would be to brace up for competition in the global supply chain. Recently, Integration seaport and global supply chain were supported by the biggest technology building of ship containers and sophisticated equipment of loading and unloading (Woo, Pettit, & Beresford, Citation2013). This integration can be conducted through an information technology system which is integrated between seaport and Shipping Company, integration of seaport and industry/importer/freight forwarders, integration of internal port processes, and integration of seaport and hinterland network (Clott & Hartman, Citation2016; Tan, Meng, Wang, & Kuang, Citation2018; Woo et al., Citation2013). The challenge provided an opportunity for Indonesian port to undertake port management reform through strategic alliance to enable them to render more efficient services and increase port performance.
The reform on Port management carried out in order to achieve the efficiency of logistics has been the trend in the business which is credited to consolidation and logistics integration. The implementation of a Strategic Alliance on terminal operators is expected to provide a port infrastructure needed for serving vessels that have huge capacities, such as dock depths, dock lengths, and recent equipment of loading and unloading, providing adequate stacking fields, reliable Human Resources and operators, capability latest information technology investments, competitive terminal handling charges, and intermodal transport facilities (Sambrani, Citation2014; Y.-C. Yang & Chen, Citation2016; Munim & Schramm, Citation2018). Also, the Strategic Alliance with Terminal operators is also required to develop its market share and contribute to economic growth and prosperity.
However, integrating business process and management is not quite easy for developing countries like Indonesia because these are industrial parts with high technology and it requires a lot of budgets. In fact, the Indonesian Budgets (APBN) are limited. According to Yuen et al. (Citation2013), Port management model involving the private sector has increased the efficiency of the container terminal. However, the Port management model is influenced by policies on port management and the unique features of each port.
According to Notteboom and Rodrigue (Citation2007), for port business development, there are various alternative strategies that can be implemented, namely through the cooperation of Build-Lease-Operate (BLO), Build-Operate-Share-Transfer (BOST), Rehabilitate-Operate-Transfer (ROT), and Build-Rehabilitate-Operate-Transfer (BROT). However, for the Long-term leases mechanism, operating licenses and BOT schemes are the most commonly used forms of concessions involving the private sector as concession partners (T. Notteboom, Citation2005; T. E. Notteboom & Rodrigue, Citation2007). Port Strategic Alliance models of development varied from one country to another, depending on their policy and characteristics. Therefore, in determining the Strategic Alliance, the port characteristics policy should be considered to ensure that the policies taken do not conflict with existing regulations (Vítor Caldeirinha, et al., Citation2013; World Bank, Citation2007).
The World Bank (Citation2007), identified four common models for managing port which is fast becoming a benchmark of world ports, namely service port model, land-lord port model, tool port model, and fully privatized model. Service port model or operation port model does not involve the private sector in loading and unloading operations. Tool port model affords the private sector the opportunity to load and unload equipment using rent system. Landlord model is a model characterized by a port concession system for the private sector in certain time. And the last is fully privatized model, provides infrastructure and superstructure through the agency of the private sector. These four port management models are not to be absolutely applied. The one to be applied depends on the policies and characteristics of the port in each country of the world.
Therefore, this study will discuss the influence of integrated global supply chain and port characteristic on Strategic Alliance which, in turn, has an influence on port strategies such as maritime accessibility, physical port infrastructure, integrated information technology system, competitive terminal handling charge; and the effect of port strategy on port performance. Indonesia port was used as a case study because it was still in the transition phase through the application of management models.
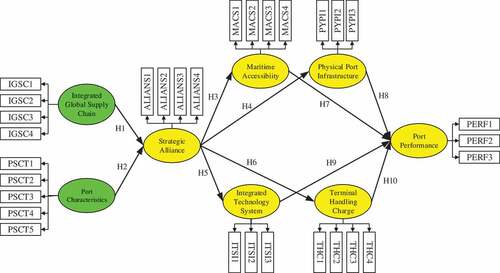
This study uses a structural equation modeling method that starts with the initial conceptual model of the literature study which was extended through the interpretation of the results of a series of practitioner and expert semi-structured interviews, as shown in Figure .
Figure 1. SEM conceptual model.
2. Literature review
2.1. Integration global supply chain on strategic alliance
According to Woo et al. (Citation2013), Port business consolidation trend through an integrated global supply chain has had a positive impact on port operational performance. Seaport integration at the terminal is an integration of information through the IT system and management for more efficient ship service. Therefore the bottlenecks do not occur in the Port. The integrated system does not only occur in the ship service process, but this integration can also provide certainty of demand in container ships that have cooperated with terminal operators.
Furthermore, integrated system in the Port also needs to be conducted to maximize the coordination of loading and unloading services, both container loading and unloading equipment schedules, allocation of resources, use of stacking fields, and the Port administration system. Integration of services through system integration is very important, especially the loading and unloading administration process such as the export-import licensing system, manifest list for security, up to payment methods through an integrated system (Álvarez-Sanjaime, Cantos-Sánchez, Moner-Colonques, & Sempere-Monerris, Citation2015; Clott & Hartman, Citation2016; Woo et al., Citation2013; Tan et al., Citation2018).
Integrated System through IT can also be conducted in terminal containers with a hinterland network (Clott & Hartman, Citation2016). According to Clott and Hartman (Citation2016), the integration of sea port-terminals and hinterland networks provides benefits for operators, ship owners, and industry or cosigner. With this integration, information on service certainty and service transparency are increasing. Therefore, the implementation of “just in time” for all the Port logistics value chain can be achieved.
Although Notteboom and Rodrigue (Citation2005) have proven the impact of supply chain integration on company performance and competitive advantage, the impact of this strategy has not been widely studied. Supply chain integration is not as easy as we think. There are various technical obstacles in the way of its actualization. One technical obstacle is not achieving the target service level agreement of each port chain, and company and government policies that are not in line so that the efficiency of the Port’s logistics services is not achieved.
This is evidenced by Clott and Hartman (Citation2016), which examines supply chain integration (SCI) in the Chicago metropolitan area and finds service corridors to be less responsive or congested corridors will move to different end nodes in large areas. Therefore, regional planning in collaboration with private sector/public infrastructure companies must address functional cooperation with Supply chain integration by focusing on corridors and local improvements.
According to Woo et al. (Citation2013), there are several studies, for example, Panayides and Song (Citation2008) and Tongzon et al. (Citation2009), have tried to overcome this problem, but the positive relationship between the level of port integration into the supply chain and performance is still relatively small. This is why port operators are not in support of adopting this integration strategy. Therefore, the potential influence of the global supply chain integrated on Strategic Alliance needs to be proven to complement previous research through the empirical discussion and assessment of Integrated Global Supply Chain on Strategic Alliance and port performance (Panayides, Citation2006).
H1 (+):
there is a positive effect of Integrated Global Supply Chain on Strategic Alliance
2.2. Port characteristics on strategic alliance
Port strategic alliance development varied from one country to another, depending on their policy and characteristics. The most used strategic alliance, especially infrastructure development, is Build-Operate-Transfer (BOT). In the case of BOT techniques, the government or public authorities give concessions to private companies to finance and build or modernize certain port facilities. The private company has the right to operate the facility and obtain income from certain operations or full ports for a specified period of time. The private sector takes all commercial risks during the concession. At the end of the concession period, the government took ownership of the upgraded assets.
The World Bank (Citation2007) and Ferrari, Parola, and Tei (Citation2015), identified four common models for managing port which is fast becoming a benchmark of world ports, namely service port model, land-lord port model, tool port model, and fully privatized model. Advantages and disadvantages from those four models above can be explained here. The Port Private is flexible, market-oriented but it does not have a vision for the community and regional development. The Landlord Port, its power is a development of community-based and local, and development through public-private partnerships, but it is still rigid, bureaucratic, and possibly having a limited vision for regional development. The Tool Port, its plan is still centralized, and limited public-private partnership, and public financing. Reciprocally, the Public Port has a plan that is still centralized, no market-oriented, still rigid, no possibility of a public-private partnership, and bureaucratic.
Those four models of port management are able to be simplified into a matrix as shown in Table below (Ferrari et al., Citation2015) of those four common models, only operating port that is belonged, built, and operated by the owner, while landlord port and tool port that the owners collaborate with their business partners such as government business entities, local government (province/regency/municipality), or private sectors. Strategic Alliance is applied in Australia, New Zealand, United Kingdom, etc. (Fully Privatization). In France, Italy, Belgium, Germany, Netherlands (land-lord port model); South Africa (tool port model), Ukraine, Israel (operating port model).
Table 1. Measurement confirmatory factor analysis (CFA) for first order SEM result
In addition to the integrated supply chain and integrated vessels, in determining strategic alliances, from previous research also showed that there were several factors that influenced port management reform, especially related to ports in Indonesia. This is the availability of state budget, local industry involvement, development of container ship technology, and port functions such as security of the state, trade, and defense.
According to V. R. Chaldeirinha, et al. (Citation2013), a strategic alliance based on port characteristics has positive influences on port performance. Port Characteristic indicators used in this research are limit of budget, container growth, political climate, strategic alliances policy, regional port location (Chi-Lok & Zhang, Citation2009; V. R. Caldeirinha et al., Citation2013; Cheon, Maltz, & Dooley, Citation2017; D. Yang, Chin, & Chen, Citation2014). Thus, based on the above literature, the following hypothesis is proposed.
H2 (+):
There is a positive influence Port Characteristic on the Strategic Alliance
H3 (+):
there is a positive influence on the Strategic Alliance on Maritime Accessibility
H4 (+):
there is a positive influence Strategic Alliance on the Physical Port Infrastructure
H5 (+):
there is a positive influence of Strategic Alliance on the Integrated Technology System
H6 (+):
There is a positive influence Strategic Alliance on the Terminal Handling Charge
2.3. Port strategy on performance
Many literatures have explained the importance of private involvement in improving the effectiveness, efficiency, and port productivity. Various journals have revealed that nearly all researchers are in support of port concession and the involvement of private sector to enhance productivity (Bridgman, Citation2015; De Oliveira & Cariou, Citation2015; Langen & Pallis, Citation2005; Notteboom & Rodrigue, Citation2005; Parola, Tei, & Ferrari, Citation2012).
Various literature reviewed have listed other factors that influence better port performance to include Speed and reliability of container handling service; high port visiting frequency; adequate port infrastructure, especially the availability of loading and offloading equipment and information technology support; high response toward port service consumer needs; guarantee of goods; closeness of the port to industrial center; low cost.
Yuen et al. (Citation2013) found that the private sector involvement in managing ports is able to escalate efficiency of the container terminal, while the container terminal whose shares completely belong to local people is less efficient. Yuen et al. (Citation2012), were of the opinion that the factors that determine the competitiveness of a container port come from the perspective of port service consumers. These are costs of using the port, port location, port facility, terminal operators, shipping services, port information systems, customs, and government regulation as well as hinterland connections. Likewise, research by Langen and Pallis (Citation2005) infers that an intra-port competition is extensively considered to be profitable for the competitiveness of a port, and for the local and national economy and for consumers and exporters. Wanke and Barros (Citation2015) in their research with title Public-private partnerships and scale efficiency in Brazilian ports: Evidence from two-stage DEA analysis state that effects of public-private partnerships in Brazilian public ports are able to assist terminal operators to exceed the highest level of efficiency by conducting coordination process, providing information technology, and connecting intermodal transportation.
Considering the importance of public sector involvement in developing ports and to carry out performance improvements in the port sector, this recent research will discuss port management model based on the business character in Indonesia. It emphasizes some considerations that port functions as mitigation, security as a state sovereignty, ability to provide infrastructures and superstructure of ports, availability of access to the hinterland and development of industries engaged in the field of port (local development) in order to improve the performance of port and to buttress economic matters effectively and efficiently. Therefore, hypothesis 2 proposed base on the above discussion.
H7 (+):
there is a positive effect of Maritime Accessibility on Port Performance
H8 (+):
There is a positive effect of physical port infrastructure effect on Port Performance
H9 (+):
there is a positive influence of the Integrated Technology System on Port Performance
H10 (-):
There is a negative influence of the terminal handling charge on Port Performance
3. Methodology
3.1. Latent variable and manifest variable
The method used in this research was a Structural Equation Modelling (SEM). The SEM method is able to analyze data comprehensively both the relationship between latent variables and the relationship between manifest variables in each latent variable. In building an SEM model, the first obligatory step is to collect previous research literature about theory built in the conceptual SEM model, as shown in Figure .
The latent variable is an un-observed and un-measured variable directly that needs indicators or manifest variables. While manifest variables or well known as observed variables or measured variable act as indicators in a model of SEM.
In this research, there were eight latent variables and 30 manifest variables. Some of the manifest variables in this research are listed below.
Integrated Global Supply Chain (IGSC). This variable consists of 4 indicators namely Integration can be done through an information system integrated between Seaport and Shipping Company, integration of seaport and importer/freight forwarders, integration of internal port processes and integration of inland ports (Clott & Hartman, Citation2016; Woo et al., Citation2013; Tan et al., Citation2018)
Port Characteristic (PCST). This variable consists of 5 indicators, namely budget constraints, container growth, State political conditions, Strategic Alliance policy, regional port location (Chi-Lok & Zhang, Citation2009; V. R. Caldeirinha et al., Citation2013; Cheon et al., Citation2017; D. Yang et al., Citation2014).
Strategic Alliance (ALIANS). This variable consists of 4 indicators, namely cooperation with existing Port concession methods, New Port development concessions, new terminal development concessions, shipping lines and port pond concessions (V. Caldeirinha, Augusto Felício, & Da Cunha, Citation2017; Ferrari et al., Citation2015; Kemenhub, Citation2015; Oghojafor, Kuye, & Alaneme, Citation2012)
Maritime accessibility (MACS) consists of 4 indicators, namely draft depth, frequency of shipping calls, overall global services, and port accessibility (Jeevan, Ghaderi, Bandara, Saharuddin, & Othman, Citation2015; Marine Department Planning, D. a. P. S. B, Citation2006; Notteboom, Parola, Satta, & Pallis, Citation2017; Quansah, Citation2008; Y.-C. Yang & Chen, Citation2016).
Physical port infrastructure (PYPI)), this variable consists of 4 indicators, namely the ability to modernize loading and unloading equipment, the ability to provide adequate stacking fields, certified operators, and intermodal transport facilities (Sambrani, Citation2014; Y.-C. Yang & Chen, Citation2016; Munim & Schramm, Citation2018).
Integrated Technology System (ITSI), this variable consists of technology investment capabilities of the latest information, port information services, system integration and innovation (Cepolina & Ghiara, Citation2013; Bagchi, & Paik, Citation2001; Y.-C. Yang & Chen, Citation2016)
Terminal Handling Charge (THC). Consist of four indicators such as port fees, cargo handling charges, inland transport costs, and logistics costs (De Borger & Van Dender, Citation2006; Nagurney, Saberi, Shukla, & Floden, Citation2015; Niu & Zhang, Citation2013; Wang, Xiong, Niu, & Zhuo, Citation2018).
Port Performance (PERFORM) consists of three indicators such as throughput, efficiency, and utility (Olivier, Citation2012; Paschetta & Martel, Citation2014; Yu, Chen, & Chiang, Citation2017)
3.2. Samples and data collection
After finding a conceptual model and hypothesis, the next step is to construct a 1–5-point Likert scale questionnaire for confirming whether the built model is in line with the theories of previous research. Questionnaires were distributed to gather empirical data and to test the model. In this research, questionnaires were distributed to industrial stakeholders of ports, including the Ministry of Transportation of the Republic of Indonesia, Port Authorities, Port Operator (PT. Pelindo I, II, III, and IV), Freight Forwarder, importer companies, exporter companies, Association of Business Entities of Ports (Assosiasi Badan Usaha Pelabuhan, ABUPI), and Indonesian National Shipping Association (INSA). About 500 questionnaires were distributed to all stakeholders, and 210 valid samples were used. The next step was an estimation of the model parameters. This research used Software LISREL 8.8.
4. Data analysis and results
4.1. Measurement CFA
From the results of structural equation modeling in Table , it can be seen that the standardized loading factor (SLF) value is ≥0.5, this indicates that the data supports the model and the entire indicator/manifest variable is valid. Next, to calculate the reliability of each latent variable can be shown by the value of construct reliability (CR) ≥ 0.7, data diversity indicator capable of conceiving the latent variable can be accepted with Average Variance Extracted value (AVE) ≥ 0.5 (Bahadur, Aziz, Zulfiqar, Wright, & Wright, Citation2018; Woo et al., Citation2013). From the results of the CFA calculation model, it can be seen that the construct reliability (CR) ≥ 0.7, and the value of Average Variance Extracted value (AVE) ≥ 0.5 so it can be concluded that this model is valid, and reliable so that it can proceed to the calculation of Goodness of fit indices (GOFI). There are 10 parameter of GOFI values from the results of SEM calculations, including; Normal value Theory Weighted Least Squares Chi-Square = 422.35 (P = 0.0043) which is then corrected with Satorra-Bentler Scaled Chi-Square = 176.03 (P = 1.00), value of Root Mean Square Error of Approximation (RMSEA) = 0.0 ≤ 0.08 (Good Fit), the value of the Normed Fit Index (NFI) = 0.98 ≥ 0.9 (Good Fit), the value of Non-Normed Fit Index (NNFI) = 1.03 ≥ 0.9 (Good Fit), Comparative Fit Index (CFI) = 1.00 ≥ 0.9 (Good Fit), Incremental Fit Index (IFI) = 1.02 ≥ 0.9 (Good Fit), Relative Fit Index (RFI) = 0.97 ≥ 0.9 (Good Fit), Standardized value of RMR = 0.049 ≤ 0.05, value of Goodness of Fit Index (GFI) = 0.88 ≤ 0.9 (Marginal Fit), Adjusted Goodness of Fit Index (AGFI) value = 0.85 ≤ 0.9 (Marginal Fit). From the results of the GOFI measurement, it can be concluded that the overall value of GOFI’s parameters are Good Fit.
4.2. Measurement second-order SEM
Before continuing on the measurement of the second-order SEM, the latent value of the score variable is first made to facilitate the analysis and measurement of latent variables. So that each latent variable only has one manifest variable that has a latent variable score (SLV) (Pipatprapa, Huang, & Huang, Citation2016; Yamin, Citation2014). After that, it was followed by testing the validity and reliability, and GOFI standards. Furthermore, after all valid, reliable, and good fit, the hypothesis testing is continued. The results of the second-order SEM measurement can be seen in Figure and Table .
Figure 2. The output of the SEM model (standardized loading factor).
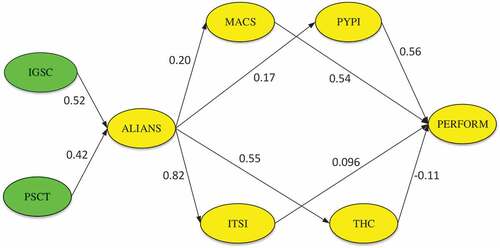
From the results of SEM calculations based on the latent score value, the variable indicates that the value of the Standardized Loading (λ) ≥ 0.50, the value of Construct Reliability (CR) ≥ 0.70, the value of Average Variance Extracted (AVE) ≥ 0.50. These results can be concluded that the second order model is valid and reliable. Furthermore, the overall measuring goodness of fit model shows that the model is fit with normal theory weighted least squares Chi-Square = 15.84 (P = 0.15) ≥ 0.05, RMSEA = 0.041 ≤ 0.08 (Good Fit), Normed Fit Index (NFI) = 0.99 ≥ 0.90 (Good Fit), Non-Normed Fit Index (NNFI) = 0.99 ≥ 0.90 (Good Fit), Comparative Fit Index (CFI) = 1.00 ≥ 0.90 (Good Fit), Incremental Fit Index (IFI) = 1.00 ≥ 0.90 (Good Fit), Relative Fit Index (RFI) = 0.97 ≥ 0.90 (Good Fit), Standardized RMR = 0.033 ≤ 0.05 (Good Fit), Goodness of Fit Index (GFI) = 0.98 ≥ 0.90 (Good Fit), Adjusted Goodness of Fit Index (AGFI) = 0.95 ≥ 0.90 (Good Fit). From the results of the GOFI measurement, it shows that out of the ten standards GOFI has met the requirements, and the model can be concluded to be valid, reliable, and good fit. So that, it can proceed to the testing of the research hypothesis. The research hypothesis is further tested by statistical values and path coefficients. With 95% confidence level, if t statistic ≥ 1.96 then research hypothesis is accepted H1 or rejected H0. As shown in Table
Table 2. CFA result for model: second-order CR and AVE measurement model
Table 3. The result of significance research hypothesis test
5. Analysis and discussion
5.1. Theoretical contributions
Effect of Integrated Global Supply Chain on Strategic Alliance: From the result of the Structural Equations Modeling in Table , it can be observed that the Integrated Global Supply Chain has a line coefficient of 0.52 with a statistic t value of 12.40 ≥ 1.96 then H0 reject which implies that in 95% confidence intervals, there is a significant influence of the IGSC on Strategic Alliance. In a similar manner, from the 4 indicators, Integrated Global Supply Chain also possesses a great influence as a manifest variable of IGSC such as the integration of seaports with terminals, integration of terminals with shipping companies, logistics industry integration, and integration of inland ports (Clott & Hartman, Citation2016; Woo et al., Citation2013; Tan et al., Citation2018). Woo et al. (Citation2013) argued that seaport integration to the supply chain would improve Port performance. This integration was carried out through integrated technology information between seaport and Port terminal. Whereas according to Clott and Hartman (Citation2016), it is not only seaport integration that needs to be considered, but the integration of hinterland network and port accessibility is also important to pay attention to the port workmanship. Alvares et al. (Citation2015) stated that transport chain performance affects efficiency and economic competitiveness. Amidst the current global competition, there has been an increase in cooperation between firms involved in the intermodal transport chain including seaport services. (Álvarez-Sanjaime et al., Citation2015). From the results of these calculations, it can be concluded that the four factors Integrated Global Supply chain have a significant effect on the Strategic Alliance. These four manifest variables are factors that are considered to be carried out in Strategic Alliance, especially in port Strategic Alliance in Indonesia. With this model of Strategic Alliance, it can improve inter-island connectivity and efficient trade connectivity between countries.
Effect Port Characteristics (PSCT) on Strategic Alliance: The results of Structural Equations Modeling in Table indicates that the Port Characteristics (PSCT) has a positive path coefficient of 0.42 with the value of t statistics 10.19 ≥ 1.96, then H0 is rejected, which means that in the confidence interval of 95%, Port Characteristics (PSCT) has a great influence on the Strategic Alliance. Effect of Terminal Characteristic on port performance previously described by V. Caldeirinha et al. (Citation2013), but only limited to characteristic terminals that have not considered the Strategic Alliance variable. Indonesian characters that need to be considered, including limited government budget, container growth, State political conditions, Strategic Alliance policy, regional port location (Chi-Lok & Zhang, Citation2009; V. R. Caldeirinha et al., Citation2013; Cheon et al., Citation2017; D. Yang et al., Citation2014). These five indicators are very important as factors that need to be considered in the Strategic Alliance.
Effect Strategic Alliance on Port Strategy: There are four strategies to improve Port performance that are tested, among them are Maritime Access, physical port infrastructure, integrated technology systems, and terminal handling Charges. The results of SEM measurements in Table show that there is a significant influence of Strategic Alliance on increasing maritime accessibility with path coefficient value 0.20 and t-statistic 3.18 ≥ 1.96, physical port infrastructure with path coefficient values 0.16 and t-statistic 2.63 ≥ 1.96, integration technology system with path coefficient value 0.82 and t-statistic 16.13 ≥ 1.96, and terminal handling Charge with path coefficient values 0.55 and t-statistic 10.66 ≥ 1.96. From the results of SEM measurements, it can be concluded that the hypothesis H3, H4, H5, and H6 is accepted.
These results are in line with the research of World Bank (Citation2007) and Ferrari et al. (Citation2015) which states that Port Concessions have a positive effect on improving the infrastructure of Maritime Access (MACS), and Physical Port Infrastructure including information technology systems. In the mechanism of cooperation with the BOT system, there are several considerations in the concession, namely the concession period, the amount of investment, the projected port tariff and the profit sharing of concessions of at least 2.5% of gross income. At the end of the concession period, the government retakes ownership of the improved assets.
The Port concession mechanism in Indonesia has been implemented and has made concessions to several commercial ports, including the Port of Tanjung Priok, Belawan Port, Makassar Port, and Bitung Port while TUKS Port has become the public port of Krakatau Bandar Samudera. The Last Port which is the Port type for special purposes can be managed with a whole privatization model (Bappenas, & Kemenhub, Citation2015; Pelindo, Citation2016).
Effect of Port Strategy on Port Performance: In this study, there are 4 hypotheses that are directly related to Port Performance, including the influence of maritime accessibility on Port Performance (H7), the influence of Physical port infrastructure on Port performance (H8), the effect of Integrated technology information system on port performance (H9), and the effect of terminal handling charge on Port performance. The results of SEM calculations in Table show that there is a significant effect of MACS on port performance with path coefficient values 0.54 and t-statistics 10.05 ≥ 1.96, and PYPI against port performance with path coefficient values 0.56 and t-statistics 10.81 ≥ 1.96 so it can be concluded that hypotheses H7 and H8 are accepted. The influence of ITSI on Port performance (H9) has not shown a significant effect with the path coefficient value of 0.096 and t-statistic 1.60 ≤ 1.96. So it can be concluded that the hypothesis H9 is rejected. While the influence of THC on port performance is negative with path coefficients −0.11 and t-statistic 2.08 ≥ 1.96 indicating that THC does not significantly influence Port performance, so the hypothesis H10 is accepted.
If the harbor offering competitive costs, lower service charges than competitors, and the cargo handling services at our terminals are cheaper than competitors have a positive impact on vessel calls and cargo throughput (Han, Citation2018), Price levels and price transparency are inputs to the supply chain and the choice of transportation modes. Still related to prices, According to Morimo et al. (Citation2018), impact Standard pricing strategies have a negative impact on business performance. In contrast, standard promotion strategies have a positive effect on business performance (Morimura & Sakagawa, Citation2018). Higher prices lead to lower price satisfaction, but the effect of price satisfaction on customer satisfaction is negative. Increased satisfaction levels lower prices because prices no positive impact on satisfaction with the fulfillment process. (Cao, Gruca, & Klemz, Citation2014).
5.2. Conclusion
The results of structural equation modeling show that the integrated influence of Port supply chain and the port characteristic has a positive effect on the Strategic Alliance policy. Likewise, the Strategic Alliance has a positive effect on the Port’s performance improvement strategies, including maritime accessibility, physical port infrastructure, integrated technology systems, and competitive terminal handling prices. The results of structural modeling also show that strategies that have direct and significant effects on port performance are the maritime accuracy and physical port infrastructure while integrated information systems and terminal handling charge have no significant effect on port performance.
5.3. Implication
The impact of the empirical Strategic Alliance can be seen from the gradual increase in the competitiveness of Indonesian ports among equal’s ports around the world. It can be observed from a comparison of pier depths. Some Ports, by comparison, indicate different pier depth such as Singapore Port (Pasir Panjang Terminal) −18 m; Shanghai Port (Yozan Terminal) −17.5 m; Busan Port (New Port) −18 m; Yokohama Port (South Honmoku) −18 m; Laem Chabang Port (D Terminal) −16 m, and Tanjung Priok Port (North Kalibaru)—18 m (Japan International Cooperation Agency, Citation2017; Pelindo, Citation2016). Currently, Pelindo collaborates with IPC TPK and Sea Terminal Management & Service Pte. Ltd. by sharing holdings about 51% and 49%, respectively. This collaboration is intended to expand Kalibaru Container Terminal that has 32-hectare land and capacity for 1.5 million TEUs per year. The total length of pier about 450 meters for the first phase (850 meters in last 2016) and its depth about −14 meters LWS (will be dredged gradually until exceeds −20 meters LWS). This new terminal is projected to serve container vessels with a capacity between 13,000 and 15,000 TEUS and maximum weight above 150,000 DWT (Pelindo, Citation2016).
Further, the government of Indonesia will develop Patimban Port that is located in Subang Regency, West Java. This port is devised to serve vessels such as Maersk E. Class with capacity specification about 165,000 Ton DWT, 15,500 TEUs, LOA 398 m, B 59 m, D 16 m. The port intended can be safe for vessels according to technical standard from OCDI. The standard required voyage criteria are the width of LA around 400 m, 17 meters of water depth, and bend radius about ten times of the ship’s LOA or about 4 km. The development plan of Patimban Port will start from 2019 to 2028 that consists of four terminals where terminal 1 and two will be finished in the last quarter of 2025 and terminal 3 and 4 in 2028 (Bappenas, & Kemenhub, Citation2015; Japan International Cooperation Agency, Citation2017).
5.4. Limitation and future research
The limitation of this study is that respondents are only business people from Indonesia. It does not include cross-border research so that this assessment can be continued and applied to other ports. Furthermore, this study only discusses the effect of the integrated supply chain on the Strategic Alliance and the strategy of improving Port performance regarding maritime accessibility, physical port infrastructure, integrated information system and terminal handling that is effective towards port performance. This research has not detailed the container flow in the Port so that further research can simulate the impact of the integrated port supply chain on the port performance.
Additional information
Funding
Notes on contributors
Sirajuddin
Sirajuddin is a Ph.D. student of industrial engineering at the University of Indonesia. Now, he is currently a full-time senior lecturer in the industrial engineering department at the University of Sultan Ageng Tirtayasa, Serang, Banten Province, Indonesia. His research interests include industrial management, Governance model, Port Performance, industrial organization, simulation, and modeling.
T. Yuri Zagloel
T. Yuri Zagloel is Professor of Industrial Engineering Department, University of Indonesia. His research includes Introduction to Industrial Engineering, Engineering Ethics, and Total Quality Management. His research interests’ are in Quality Management and Production System field.
Sunaryo
Sunaryo is a professor at the Department of Mechanical Engineering, Faculty of Engineering, University of Indonesia. His research in the field of shipbuilding, including, Engineering Shipyard and Ship Construction.
References
- Álvarez-Sanjaime, Ó., Cantos-Sánchez, P., Moner-Colonques, R., & Sempere-Monerris, J. J. (2015). The impact on port competition of the integration of port and inland transport services. Transportation Research Part B: Methodological, 80, 291–14. doi:10.1016/j.trb.2015.07.011
- Bagchi, K. P., & Paik, S. K. (2001). The role of public‐private partnership in port information systems development. International Journal of Public Sector Management, 14(6), 482–499. doi:10.1108/EUM0000000005965
- Bahadur, W., Aziz, S., Zulfiqar, S., Wright, L. T., & Wright, L. T. (2018). Effect of employee empathy on customer satisfaction and loyalty during employee–customer interactions: The mediating role of customer affective commitment and perceived service quality. Cogent Business & Management, 5(1), 1–21. doi:10.1080/23311975.2018.1491780
- Bappenas, & Kemenhub. (2015). Konsep Tol Laut dan Implementasi 2015–2019. Kementerian Perhubungan, PPN, dan Bappenas.
- Bridgman, B. (2015). Competition, work rules and productivity. Journal of Economic Dynamics and Control, 52, 136–149. doi:10.1016/j.jedc.2014.12.008
- Caldeirinha, V., Augusto Felício, J., & Da Cunha, S. F. (2017). Government policies and Portuguese port governance in the period from 2005 to 2015. Research in Transportation Business & Management, 22, 11–20. doi:10.1016/j.rtbm.2016.11.004
- Caldeirinha, V., Felício, J. A., & Dionísio, A. (2013). Effect of the container terminal characteristics on performance. Maritime Economics & Logistics 17(4): 493–514. doi:10.1057/mel.2014.33
- Caldeirinha, V. R., Felicio, J. A., & Coelho, J. (2013). The influence of characterizing factors on port performance, measured by operational, financial and efficiency indicators. Recent Advances in Environment, Energy Systems and Naval Science.
- Cao, Y., Gruca, T. S., & Klemz, B. R. (2014). Internet pricing, price satisfaction, and customer satisfaction. International Journal of Electronic Commerce, 8(2), 31–50. doi:10.1080/10864415.2003.11044291
- Cepolina, S., & Ghiara, H. (2013). New trends in port strategies. Emerging role for ICT infrastructures. Research in Transportation Business & Management, 8(195–205). doi:10.1016/j.rtbm.2013.07.001
- Cheon, S., Maltz, A., & Dooley, K. (2017). The link between economic and environmental performance of the top 10 U.S. ports. Maritime Policy & Management, 44(2), 227–247. doi:10.1080/03088839.2016.1275860
- Chi-Lok, A. Y., & Zhang, A. (2009). Effects of competition and policy changes on Chinese airport. Journal of Air Transport Management, 15, 166–174. doi:10.1016/j.jairtraman.2008.09.003
- Clott, C., & Hartman, B. C. (2016). Supply chain integration, landside operations and port accessibility in metropolitan Chicago. Journal of Transport Geography, 51, 130–139. doi:10.1016/j.jtrangeo.2015.12.005
- De Borger, B., & Van Dender, K. (2006). Prices, capacities and service levels in a congestible Bertrand duopoly. Journal of Urban Economics, 60(2), 264–283. doi:10.1016/j.jue.2006.03.001
- De Oliveira, G. F., & Cariou, P. (2015). The impact of competition on container port (in)efficienc. Transportation Research Part A, 124–133. doi:10.1016/j.tra.2015.04.034
- Ferrari, C., Parola, F., & Tei, A. (2015). Governance models and port concessions in Europe: Commonalities, critical issues and policy perspectives. Transport Policy, 41, 60–67. doi:10.1016/j.tranpol.2015.03.012
- Han, C.-H. (2018). Assessing the impacts of port supply chain integration on port performance. The Asian Journal of Shipping and Logistics, 34(2), 129–135. doi:10.1016/j.ajsl.2018.06.009
- Jeevan, J., Ghaderi, H., Bandara, Y. M., Saharuddin, A. H., & Othman, M. R. (2015). The implications of the growth of port throughput on the port capacity: The case of Malaysian major container seaports. International Journal of e-Navigation and Maritime Economy, 3, 84–98. doi:10.1016/j.enavi.2015.12.008
- Japan International Cooperation Agency. (2017). The preparatory survey on Patimban port development project. Directorate general of Sea Transportation, the Ministry of Transportation (DGST).
- Kemenhub. (2015). Peraturan Pemerintah Republik Indonesia Nomor 11 Tahun 2015 Tentang Jenis dan Tarif Atas Jenis Penerimaan Negara Bukan Pajak Yang Berlaku Pada Kementerian Perhubungan RI.
- Langen, P. W. D., & Pallis, A. A. (2005). Analysis of the benefits of intra port competition. Germany: University Library of Munich,
- Marine Department Planning, D. a. P. S. B. (2006). Port benchmarking for assessing Hong Kong’s maritime services and associated costs with other major international ports. Marine Department Planning, Development and Port Security Branch .
- Morimura, F., & Sakagawa, Y. (2018). Information technology use in retail chains. Impact on the standardisation of pricing and promotion strategies and performance. Journal of Retailing and Consumer Services, 45, 81–91. doi:10.1016/j.jretconser.2018.08.009
- Morimura, F., & Sakagawa, Y. (2018). Information technology use in retail chains: Impact on the standardisation of pricing and promotion strategies and performance. Journal of Retailing and Consumer Services, 45, 81–91. doi:10.1016/j.jretconser.2018.08.009
- Munim, Z. H., & Schramm, H.-J. (2018). The impacts of port infrastructure and logistics performance on economic growth the mediating role of seaborne trade. Journal of Shipping and Trade. doi:10.1186/s41072-018-0027-0
- Nagurney, A., Saberi, S., Shukla, S., & Floden, J. (2015). Supply chain network competition in price and quality with multiple manufacturers and freight service providers. Transportation Research Part E: Logistics and Transportation Review, Part E, 248–267. doi:10.1016/j.tre.2015.03.001
- Niu, B., & Zhang, J. (2013). Price, capacity and concession period decisions of Pareto-efficient BOT contracts with demand uncertainty. Transportation Research Part E: Logistics and Transportation Review, 53, 1–14. doi:10.1016/j.tre.2013.01.012
- Notteboom, T. (2006). Chapter 19 concession agreements as port governance tools. Research in Transportation Economics 17, 437–455. doi:10.1016/S0739-8859(06)17019-5
- Notteboom, T. E., & Rodrigue, J. -P. (2007). Port regionalization: Towards a new phase in port development. Maritime Policy & Management, 32(3), 297–313. doi:10.1080/03088830500139885
- Notteboom, T. E., Parola, F., Satta, G., & Pallis, A. A. (2017). The relationship between port choice and terminal involvement of alliance members in container shipping. Journal of Transport Geography, 64, 158–173. doi:10.1016/j.jtrangeo.2017.09.002
- Notteboom, T. E., & Rodrigue, J.-P. (2005). Port regionalization: Towards a new phase in port development. Maritime Policy & Management, 32(3), 297–313. doi:10.1080/03088830500139885
- Oghojafor, B. E. A., Kuye, O. L., & Alaneme, G. C. (2012). Concession as a strategic tool for ports efficiency: An assessment of the Nigerian ports. American Journal of Business and Management, 1(4), 214–222. doi:10.11634/216796061706213
- Olivier, T. L. (2012). The efficiency of the container shipping industry and the development of a performance measurement. Thesis presented in partial fulfilment of the requirements for the degree of Master of Science in the Faculty of Industrial Engineering at Stellenbosch University.
- Panayides, P. M., & Song, D. W. (2008), Evaluating the integration of seaport container terminals in supply chains. International Journal of Physical Distribution & Logistics Management, 38, 562–584. doi:10.1108/09600030810900969
- Panayides, P.M. (2006). Maritime logistics and global supply chains: Towards a research agenda. Towards a Research Agenda. Maritime Economics and Logistics, 8, 3–18. doi:10.1057/palgrave.mel.9100147
- Parola, F., Tei, A., & Ferrari, C. (2012). Managing port concessions: Evidence from Italy. Maritime Policy & Management, 39(1), 45–61. doi:10.1080/03088839.2011.642312
- Paschetta, C., & Martel, H. (2014). Container performance indicators. The Le Havre Shipping and Port Confederation HAROPA - Port of Le Havre.
- Pelindo. (2016). Annual Report Pelindo 2 Year 2016.
- Pipatprapa, A., Huang, H.-H., & Huang, C.-H. (2016). A novel environmental performance evaluation of Thailand’s food industry using structural equation modeling and fuzzy analytic hierarchy techniques. Journal Sustainability, 8, 246. doi:10.3390/su8030246
- Quansah, N. E. (2008). Impact of privatization in ports: Measuring efficiency through data envelopment analysis and key performance indicators. World Maritime University dissertations.
- Sambrani, V. N. (2014). PPP from Asia and African perspective towards infrastructure development: A case study of Greenfield Bangalore International Airport, India. Procedia - Social and Behavioral Sciences, 157, 285–295.
- Tan, Z., Meng, Q., Wang, F., & Kuang, H.-B. (2018). Strategic integration of the inland port and shipping service for the ocean carrier. Transportation Research Part E: Logistics and Transportation Review, 110, 90–109. doi:10.1016/j.tre.2017.12.010
- Tongzon, J., Chang, Y. -T., & Lee, S. -Y. (2009). How supply chain oriented is the port sector? International Journal of Production Economics, 122, 21–34. doi:10.1016/j.ijpe.2009.03.017
- Wang, F., Xiong, M., Niu, B., & Zhuo, X. (2018). Impact of government subsidy on BOT contract design: Price, demand, and concession period. Transportation Research Part B: Methodological, 110, 137–159. doi:10.1016/j.trb.2018.02.006
- Wanke, P. F., & Barros, C. P.(2015). Public private partnerships and scale efficiency in brazilian ports: Evidence from two-stage dea analysis. Socio-Economic Planning Sciences. doi:10.1016/j.seps.2015.06.002
- Woo, S., Pettit, S. J., & Beresford, A. K. C. (2013). An assessment of the integration of seaports into supply chains using a structural equation model. Supply Chain Management: An International Journal, 18(3), 235–252. doi:10.1108/SCM-09-2011-0264
- World Bank. (2007). Alternative port management structures and ownership models. The World Bank, and Public-Private Infrastructure Facility. doi:10.1596/978-0-8213-6607-3
- Yamin, S. (2014). Secrets of Lisrel data management. Mitra Wacan Media.
- Yang, D., Chin, A. T. H., & Chen, S. (2014). Impact of politics, economic events and port policies on the evolution of maritime traffic in Chinese ports. Maritime Policy & Management, 41(4), 346–366. doi:10.1080/03088839.2013.784399
- Yang, Y.-C., & Chen, S.-L. (2016). Determinants of global logistics hub ports: Comparison of the port development policies of Taiwan, Korea, and Japan. Transport Policy, 45, 179–189. doi:10.1016/j.tranpol.2015.10.005
- Yu, M.-M., Chen, L.-H., & Chiang, H. (2017). The effects of alliances and size on airlines’ dynamic operational performance. Transportation Research Part A: Policy and Practice, 106, 197–214. doi:10.1016/j.tra.2017.09.015
- Yuen, A. C. -l., Zhang, A., & Cheung, W. (2013). Foreign participation and competition: A way to improve the container port efficiency in China? Transportation Research Part A: Policy and Practice, 49, 220–231. doi:10.1016/j.tra.2013.01.026
- Yuen, C. -l. A., Zhang, A., & Waiman, C. (2012). Port competitiveness from the users’ perspective: An analysis of major container ports in China and its neighboring countries. Research in Transportation Economics, 35: 34–40. doi:10.1016/j.retrec.2011.11.005