
Abstract
Sustainable port KPIs are an important concept to operate in port. This paper, therefore, compiles & attempts to identify the sustainable port KPIs from academic and practice aspects, and test with Thailand ports in the Eastern Economic Corridor (EEC). Exploratory factor analysis and one-way ANOVA are applied to group and classify these KPIs. The findings show that there are two main sustainable port KPI groups, namely, critical and preferable groups. KPI group 1 and group 2 are considered as the critical ones, whereas KPI group 3 and group 4 are classified as the preferable ones. This paper also finds that there are some significant differences in sustainable port KPIs among types of ports, namely, container, non-container, and multi-purpose port for the preferable group, but there is no difference for the critical group one.
PUBLIC INTEREST STATEMENT
In performing the port operation, environmental and social problems have been found, resulting in port operation focuses on improving port sustainability that is to reduce the environmental and social impacts around the ports. Therefore, this research attempts to identify the sustainable port indicators for improving these environmental and social problems. This paper found two main groups of sustainable port indicators that are the critical and preferable groups. The critical group must be applied to sustainable port management, and the preferable group is supported to port sustainability. Three types of ports, namely, container, non-container, and multi-purpose port of critical group is similarly practiced in three types of ports, but the preferable group is indicated as being different management. The benefits of finding are to support the first policy and port practice for developing friendly environment and social responsibility of ports.
1. Introduction
International shipping is strongly associated with global trade and port management that goes along with it have affected the environment and surrounding communities. Therefore, there is a need to develop transportation and port sustainability. Port operation in Thailand aims to increase its efficiency and effectiveness of competitiveness particularly on the sustainable aspects of the environment and social dimensions (Office of the National Economic and Social Development Board, Citation2017). Sustainable management is an important concept to operate in port operation including of the three main pillars of sustainable development, namely, environmental (to reduce the impact on the environment), social (community management), and economic (to help the organization benefit and enhance its economic performance). These three pillars are intersected and have a relationship among the pillars (UNCTAD, Citation2017).
As a result, port sustainability is challenging port authorities around the world to find ways of operating and managing their ports efficiently and effectively in terms of economic, social, as well as environmental development (Chen & Siu Lee Lam, Citation2018; Roh, Thai, & Wong, Citation2016). Therefore, sustainability for Thailand port is essential. This paper, thus, aims to determine and analyze the sustainable port KPIs. In this study, Literature is reviewed to explore the sustainable port KPIs by integrating academic aspect using academic peer-reviewed journals dated back 15 years together with practical aspect using sustainable port annual reports of 12 ports from 40 of the world’s top ports (Review of Maritime Transport, Citation2015; UNCTAD, Citation2016). Exploratory factor analysis is applied to the analysis in order to identify the sustainable port KPIs and sustainable port KPI groups. Three types of ports, namely; container, non-container, and multi-purpose port are surveyed to see the similarity differentiation among port sustainable KPI groups from the three different types of ports.
2. Literature review
2.1. Sustainable port management
Sustainable port is the concept of port operation that is managed with triple bottle line. These three pillars include the environmental, social, and economic pillars which intersect among pillars (Ssilian, Jaegler, & Cariou, Citation2016). Sustainable port is used in business strategy and considers the relationship of three pillars. The aim of this concept is to meet the stakeholder needs while defending the sustainability of social and natural resources (Sakar & Cetin, Citation2012). This is a challenge to the improved port operation and internal standard (Asgari, Hassani, Jones, & Nguye, Citation2015). Therefore, Sustainable port requires the operation of three main pillars and depends on practical of the relationship among these pillars. The aims of the sustainable port are to improve the equilibrium of cost efficiency in port, the environmental port, and societal port. However, there is still more pillars of port sustainability that supports the port operation as well.
2.2. Reviewed literature on sustainable port KPIs
Sustainable port KPIs are reviewed from sustainable port annual reports on the top 40 ports and academic peer-reviewed journals related to port sustainability. In the first goal of the research, the researcher aims to find all sustainable port KPIs which covers all practical and academic aspects. Firstly, after reviewing 12 sustainable port reports from total 40 of the world’s top ports (UNCTAD, Citation2016) it is found that there are 8 ports that present sustainable port KPIs in their annual reports. Four ports further have environmental ports annual reports. Only annual reports of 8 ports from total 40 ports are available in their websites (Long Beach port Citation2010; Busan port Citation2014; Los Angles port Citation2014; Rotterdam port Citation2008; Bremerhaven port Citation2015; Santos port Citation2016; Antwerp port Citation2017; Singapore port Citation2016). The variety of sustainable port KPIs is presented as part of the environment pillar including consumption of energy, water consumption, and air emissions, etc. The social pillar focuses on the quality of life, community development, safety management, and employee profiles, etc. The economic pillar clarifies by capacity review for cargo, financial and non-financial performance, and strengthens positions, etc. In addition, it found that the organizational management pillar is an important aspect in improving port sustainability.
Furthermore, it is found, there are annual reports of 4 more ports that are reviewed. These 4 reports showing in their port websites just present only one pillar, namely, environmental, air quality, noise management, water quality and waste management (Dubai port Citation2016; Kaohsiung port Citation2016; Tanjung Pelepas port, Citation2017; Valencia port Citation2017).
Secondly, the total 163 articles are reviewed from academic peer-reviewed journals published in 2003–2017. Four keywords are “sustainable port”, “environmental port”, “social port”, and “economic port” are searched. It is found that there are 79 articles in sustainable port, 14 articles in environmental port, 4 articles in social port, and 66 articles in economic port. These academic articles are searched from four databases including Science Direct (96 articles), Emerald insight (35 articles), ABI Inform complete (22 articles) and Springer Link (10 articles). The number of articles on the A.D. year basis can be summarized as shown in Figure .
Figure 1. The number of articles in each year.
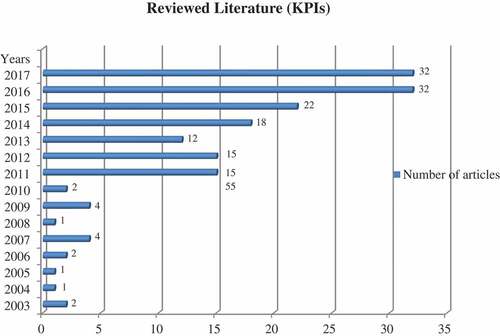
During the period of 2003–2007, there are not so many articles regarding the keywords. Also, the 10 articles on port sustainability are the fewest among the four keywords (Stojanovic, Ormerod Smith, & Wooldridge, Citation2006). There are a total of 37 articles during the period of 2008–2012. This is a significant increase in the number of reviewed papers. Most articles are about environmental sustainability and focused on identifying the main factors of port operation (Burskyte, Belous, & Stasiskiene, Citation2011; Delai & Takahashi, Citation2011; Lopes, Citation2012). A larger number of 116 articles are published from 2013 to 1017, and the concept of port sustainability is applied in practical planning and strategic business. Most articles on port sustainability introduced the concept, key element and various KPIs (Asgari et al., Citation2015; Laxe, Bermúdez, Palmero, & Novo-Corti, Citation2016; Zhang, Kim, Tee, & Lam, Citation2017). These articles are achieved by literature review, conceptual frameworks, and case study (Davarzani, Fahimnia, Bell, & Sarkis, Citation2016; Puig, Wooldridge, & Darbra, Citation2014; Xiao & Lam, Citation2017).
Sustainable port KPIs is analyzed by content analysis that it is found 156 KPIs. Three main pillars are found together with the environmental port, social port, and economic port pillars. Furthermore, organizational management principle is found as one more dimension extended from three main pillars. Therewith, these sustainable port KPIs of three main pillars and one principle are put into the questionnaires survey in order to classify the sustainable port KPI groups from three types of ports.
3. Methodology
This study analyzes the data using mixed methods of both qualitative and quantitative research to identify the sustainable port KPIs from the three types of ports in the Eastern Economic Corridor (EEC) of Thailand. The research design is divided into two phases. Firstly, qualitative approach through content analysis is applied to find the sustainable port KPIs using academic peer-reviewed journals published between 2003 and 2017 which are searched database from Emerald insight, Springer Link, Science Direct and ABI Inform. Together with sustainable port annual reports of 12 ports from the 40 top ports (UNCTAD, Citation2016). Secondly, a quantitative approach by factor analysis is applied to classify these KPIs into main group base on sustainable pillars.
3.1. Framework of statistics analysis
This study is analyzed through four steps as shown in Figure . Step 1, the literature reviewed found 156 sustainable port KPIs by content analysis. Step 2 is questionnaires survey. Step 3, inferential statistics analysis using exploration factor analysis is applied to analysis the sustainable port KPI groups and sustainable port KPIs. These sustainable port KPIs are selected with factor loadings that are above 0.7 (70%) in general which factor loadings are similar to correlation coefficients in that they can vary from −1 to 1 (Gefen, Straub, & Boudreau, Citation2000; MacCallum, Widaman, Preacher, & Hong, Citation2001). This factor analysis is to use a data reduction method designed to explain the correlations between observed variables (Lu, Shang, & Lin, Citation2016a, Citation2016b; Gebauer, Putzr, Fischer, Wang, & Lin, Citation2008). Step 4, one-way analysis of variance (ANOVA) using Scheffe testing is employed to test the difference of the important levels of the KPI group with the three types of ports (Chawla & Joshi, Citation2010; Diaz & Rodriguez, Citation2016). This ANOVA test is a technique using to compare means of two or more samples for determining whether there are any statistically significant differences between the means of three or more independent groups (Howell, Citation2002). Finally, 91 sustainable port KPIs are selected forming to the critical KPI and the preferable KPI group.
Figure 2. Framework of statistics analysis.
3.2. Data population, collection, and questionnaire design
The total populations are 63 managers who directly respond to sustainable port. All of managers are to work in EEC of Thailand ports which 21 terminals are including the 18 terminals of Laem Chabang port controlled by the Port Authority of Thailand (Laem Chabang port, Citation2017) and another 3 private ports in the area. Although the number of criteria (156 KPIs), and the number of respondents (63 managers) are not to the scale proportion. But if we increase the respondent number, it may create more error instead of having a better statistical meaning. Since the direct managers who involved with sustainability are very few in each port.
The instruments are a questionnaire survey which is filled with face to face interview to indicate the level of importance of the sustainable port KPIs with a 10-level scale (Amrina & Vilsi, Citation2015). The importance of sustainable port KPIs ranged from strongly disagree (1-low) to strongly agree (10-high) in regards to sustainable port. The questionnaire has two sections. Section one, the demographic information relates company and personal information about the company name, port/terminal operator, ISO certificate, PSHE-MS member, type of port, position, responsibility, and education. Section two contains two subsections; the question of sustainable port KPIs, the important levels (from 1 to 10), and other indicators of the respondent’s opinion.
The questionnaires regarding 156 KPIs are distributed to the total population; 63 managers in 21 terminals. The completed questionnaires are accounted for 57 managers that are 90.48% of the respondents. Operational manager with 77.19%, middle manager with 12.28%, and top manager with 10.53%. Of this total, 56.14% responded to sustainable development, and 35.09% responded to port management, and 8.77% are others' responsibility. More than a half of managers 52.63% in Master degree, Bachelor’s degree in 47.37%, and there is no one graduate in a Doctoral degree. Moreover, Type of ports in data collection displayed with 57.89% in container port, 21.05% in non-container port, and 21.05% in multi-purpose port.
4. Findings and discussions
The findings of this study are divided into three parts. Firstly, the results of the exploration factor analysis of port sustainable KPI groups and factor loading of sustainable port KPIs. Secondary, the analysis of variance (ANOVA) comparing means of the important levels of KPI among three types of ports. Finally, discussion of the analysis result.
4.1. Results of exploration factor analysis for sustainable port KPI groups
The analysis of Pearson’s correlation measures the correlation coefficient by studying the relationship between variables. The correlation test is significant at the 0.05 level (2-tailed). It seems to be concluded that most of the KPI variables are correlated to each other. This confirms that factor analysis can be used with this data (Iddris, Citation2016; Vanichbuncha, Citation2010). The KPIs are analyzed to classify KPI groups. Table displays the results of variance and cumulative percentage each KPI groups. To achieve an acceptable fit, it found that there are four KPI groups; group 1 and group 2 show the high percentages of variance which are 26.519% and 24.290%, respectively. Then, group 3 and group 4 show a variance of 19.337% and 19.008%, respectively.
Table 1. The results of variance and cumulative percentage of KPI groups
The cumulative percentage is explained by the variance that applies to select an optimal number of KPI group. In this study, we choose four KPI groups as the cumulative variance of 89.153% that present a high percentage to confirm the number of KPI group.
Table presents the factor analysis with principal component method extraction. The varimax rotation is adapted to steps for evaluating the terms of error of indicators that composes the factors. The results show factor loadings being more than 0.7 levels indicating that the KPI is highly important to be represented to the corresponding KPI groups. The sustainable port KPIs are of total 91 KPIs from 156 KPIs. KPI group 1 determines the highest numbers of sustainable port KPIs with economic port manner. KPI group 2 concludes as having the most sustainable port KPIs with environmental port management. KPI group 3 identifies the highest numbers of sustainable port KPIs with impartial port management. KPI group 4 indicates most of sustainable port KPIs with social port management.
Table 2. Results of exploration factor analysis
4.2. The analysis of variance (ANOVA) comparing means of the important level of KPI among three types of ports
This part analyzes the differences in the importance level among four KPI groups from the three types of ports; container ports, non-container port, and multi-purpose port.
Table presents the results of analysis of variance (ANOVA) comparing the important levels within the four KPI groups following the three types of ports. This table shows the Scheffe testing for alpha 0.5 of all KPI groups. This analysis further found that KPI group 1 and group 2 has non-significant differences among the three types of ports. KPI groups 1 and 2 are presented as having a high level of important indicators which show higher than 0.8 important levels. KPI group 1 shows the non-container ports (9.88), multi-purpose ports (8.69), and container ports (8.46). KPI group 2 displays the mean levels of importance indicators by non-container ports (9.82), multi-purpose ports (9.15) and container ports (8.17). Thus, in the three types of ports, the important indicators need to operate to port sustainability has no differentiation.
Table 3. One-way ANOVA of differences among three types of ports
KPI group 3 and group 4 indicate a significant difference in the three types of ports. KPI group 3, for non-container ports, is shown to have the lowest level of indicators of importance (5.12); after that is the multi-purpose port (7.54) and container port (8.83). KPI group 4 for container ports is given to the lowest level of importance indicators (7.19) while the mean level of importance indicators for multi-purpose ports (9.20) and non-container ports (9.53) are shown to have the highest level of importance indicators. Therefore, container ports offer an important level of KPI group 3 more than non-container ports; also, multi-purpose ports provide an important level of KPI group of three more than a non-container port. However, container ports and multi-purpose port are given the important level of KPI group 3 with non-differentiation.
4.3. Discussions
Sustainable port is the greatest challenge in the world of ports (Mora, Orejas, Subirats, Ibanez, & Alvarez, Citation2005; Mori & Best, Citation2017). Ports in Asia have been implementing various green and sustainable activities seeking to reduce the environmental and social impacts of shipping and port activities (Roh et al., Citation2016; Hou & Geerlings, Citation2016). In this paper, it is found that KPI groups are divided into two main groups including the critical KPI groups and the preferable KPI group. KPI group 1 and group 2 are the critical KPI in which the sustainable port must be operated to port management. Additionally, KPI group 3 and group 4 are the preferable KPI groups that port operation need to apply sustainable ports followed by types of ports.
Sustainable port KPIs total 91 KPIs are comprised of the environmental aspect 22 KPIs (24.18%), social aspect 28 KPIs (30.77%), economic aspect 27 KPIs (29.67%), and port organizational management aspect 14 KPIs (15.38%) as shown in Figure . This paper introduces that modern port should apply these sustainable port KPIs in order to improve their sustainable ports performance.
Figure 3. Sustainable port KPIs.
The critical KPIs are shown in the highest explanation of sustainable ports in the 30 KPIs of KPI group 1 and 23 KPIs of KPI group 2. There are a total of 53 KPIs that must be considered for operational planning in ports to achieve port practice towards port sustainability. The KPIs group 1 presents the economic port manner referring to the port management that is achieved by integrating key cost efficiency and cooperate social responsibility in ports. Port operation can achieve KPIs in group 1 with KPIs of G1.1–1.30. The applied practices of sustainable port planning can be considered for the factor loading of sustainable port KPIs. KPIs of G1.1–1.2 explain the management of environmental costs, and G1.3–1.13 indicates the cost of cooperate social responsibility. G1.4–1.30 specifies the economic management which offers the financial and consumption in port. Port operation can achieve KPIs in group 2 with KPIs of G2.1–2.23. The applied operations of sustainable port performance are to consider the factor loading of sustainable port KPIs. KPIs of G2.1–2.13 and G18-23 explain the environmental management in ports and G2.14–1.17 point to the environmental efficiency cost and social responsibility. However, these critical KPIs are presented with non-difference in the level of importance indicators to practice of the three types of ports. These ports will be applicable for operation to develop sustainable KPIs for producing the practical plan and key measurement in port operation.
The preferable KPIs are revealed in the exceptional sustainable port KPIs of sustainable ports in the 19 KPIs of KPI group 3 and 19 KPIs of KPI group 4. There are a total of 38 KPIs needed to reflect on operational planning in ports for achieving better performance in port sustainability. In the KPIs, group 3 presents about the impartial port management referring to the port management that is achieved the superimposed economic and social efficiency in port. Port operation can be achieved with KPIs in group 3 with KPIs of G 3.1–3.19. The port management of sustainable planning is to be considered to factor loading of sustainable port KPIs. KPIs of G3.1–3.3 explain the management of the equitable environment and KPIs of G3.4–1.19 shown for operating the social-economic management of a port. In the KPIs group 4 it indicated that the social port management referring to the port management. Port practice can achieve KPIs in group 4 with KPIs of G 4.1–4.19. The planning of sustainable port operation is to be considered with the factor loading of sustainable port KPIs. KPIs of G4.1–4.4 explain the environmental management to the community surrounding the port and KPIs of G4.5–4.11 identify the social sustainability in port. KPIs of G4.12–4.19 identify the organization and community management to port. The preferable KPIs recommend as an important indicator level of difference implementation followed by three types of ports that are found in KPIs group 3 and group 4 are significant different testings.
In addition, the performance measurement of KPIs group 3 in container ports and multi-purpose ports need to be given a high importance level of practice planning more than non-container ports. The performance measurement of KPIs group 4 in non-container ports and multi-purpose ports need to offer a high important level of operational management more than container ports. In light of the results obtained, container ports and multi-purpose ports require operational integrating financial and social efficiency of KPI group 3 to performance measurement in port. Furthermore, the practice of KPI group 3 in non-container port demands the least importance to manage the performance measurement in ports. For the need of KPI group 4, container ports require operational indication by the least important social and organizational management less than non-container ports and multi-purpose ports; these two types of ports affect the more natural environment and social surroundings. All information support is to direct the development of a sustainable port which explains the sustainable performance measurement and port management.
5. Conclusions
Port operation focuses on improving port sustainability in order to add value to the high profile of international ports and reduce environmental and social impacts. Together with this port operation supports maritime transport and the overall economic system. However, in performing the port operation, environmental and social problems have been found, and are lacking the sustainable port KPIs. This paper finds four sustainable port KPI groups using exploratory factor analysis. The findings also identify that the sustainable port KPIs are formed into groups. The four KPI groups are shown with 91 sustainable port KPIs display factor loadings being higher than a 0.7 level indication. These KPIs are included in the environmental aspect 22 KPIs, social aspect 28 KPIs, economic aspect 27 KPIs, and port organizational management aspect 14 KPIs.
KPI group 1 and group 2 are the critical KPI to explain the high importance of port sustainability. These critical KPIs must be applied to sustainable port management. Whereas the preferable KPI are found in KPI group 3 and group 4 which are supported to port sustainability. Besides, three types of port are tested for the different group using one-way ANOVA with the important levels of the sustainable port KPI groups. As a result, KPI group 1 and group 2 are presented as having significant non-differences, but KPI group 3 and group 4 are indicated as being significantly different between the three types of ports. Figure introduces the sustainable port KPIs that contemporary port should apply these KPIs for improving their sustainable ports performance.
Therefore, port management should be considered with these sustainable port KPIs and sustainable port KPI groups to the first policy and practice for developing sustainability reports towards high performance and creating a good image of environmentally and socially of sustainable ports. Future research can consider these findings in comparison to other stakeholders and in other areas or countries.
Acknowledgements
This research is supported by Rachadapisek Sompote Fund for Postdoctoral Fellowship, Graduate School, Chulalongkorn University.
Additional information
Funding
Notes on contributors
Thanyaphat Muangpan
Thanyaphat Muangpan, Ph.D. has Bachelor’s degree in International Business, Master’s degree in Transport and Logistics Management, Ph.D. in Logistics and Supply Chain, and Postdoctoral Fellowship in sustainable port. Her research experience is sustainable supply chain management. The areas of special research are sustainable supply chain management, sustainable port, logistics and supply chain management, and performance measurement in supply chain. She’s a full lecturer in Faculty of Logistics, Burapha University, Thailand.
Kamonchanok Suthiwartnarueput
Kamonchanok Suthiwartnarueput, Ph.D. has Bachelor’s degree in Management, Master’s degree and Ph.D. in Maritime Studies, University of Wales, UK. She’s a professor at Faculty of Commerce and Accountancy, Chulalongkorn University, Thailand. Her professional research are in the field of shipping and port management as well as logistics and supply chain management. The areas of special research are shipping and port management, logistics and supply chain management.
References
- A Sustainable Port for the Future. (2014). 2014 BPA sustainability report. Retrieved from https://www.unglobalcompact.org/system/attachments/cop_2016/290231/original/BPA_future_eng01.pdf?1464943203
- Amrina, E., & Vilsi, A. L. (2015). Key performance indicators for sustainable manufacturing evaluation in cement industry. Procedia CIRP, 26, 19–18. doi:10.1016/j.procir.2014.07.173
- Asgari, N., Hassani, A., Jones, D., & Nguye, H. H. (2015). Sustainability ranking of the UK major ports: Methodology and case study. Transportation Research Part E, 78, 19–39. doi:10.1016/j.tre.2015.01.014
- Burskyte, V., Belous, O., & Stasiskiene, Z. (2011). Sustainable development of deep-water seaport: The case of Lithuania. Environmental Science and Pollution Research, 18, 716–726. doi:10.1007/s11356-010-0415-y
- Chawla, D., & Joshi, H. (2010). Knowledge management practices in Indian industries -a comparative study. Journal of Knowledge Management, 14, 708–725. doi:10.1108/13673271011074854
- Chen, C., & Siu Lee Lam, J. (2018). Sustainability and interactivity between cities and ports: A two-stage data envelopment analysis (DEA) approach. Maritime Policy & Management, 45(7), 944–961. doi:10.1080/03088839.2018.1450528
- Davarzani, H., Fahimnia, B., Bell, M., & Sarkis, J. (2016). Greening ports and maritime logistics: A review. Transportation Research Part D, 48, 473–487.
- Delai, I., & Takahashi, S. (2011). Sustainability measurement system: A reference model proposal. Social Responsibility Journal, 7, 438–471. doi:10.1108/17471111111154563
- Diaz, M. R., & Rodriguez, T. F. E. (2016). Determining the sustainability factors and performance of a tourism destination from the stakeholders’ perspective. Journal Sustainability, 8. doi:10.3390/su8090951
- Environmental policy Valencia port. (2017). Retrieved from https://www.valenciaport.com/en/
- Gebauer, H., Putzr, F., Fischer, T., Wang, C., & Lin, J. (2008). Exploring maintenance strategies in Chinese product manufacturing companies. Management Research News, 31, 941–950. doi:10.1108/01409170810920648
- Gefen, D., Straub, D., & Boudreau, M. (2000). Structural equation modeling and regression: Guidelines for research practice. Communications of the Association for Information Systems, 4(7), 1–78. doi:10.17705/1CAIS
- Hou, L., & Geerlings, H. (2016). Dynamics in sustainable port and hinterland operations: A conceptual framework and simulation of sustainability measures and their effectivenes s, based on an application to the Port of Shanghai. Journal of Cleaner Production, 135, 449–456. doi:10.1016/j.jclepro.2016.06.134
- Howell, D. (2002). Increasing earnings inequality and unemployment in developed countries: Markets, institutions and the "Unified Theory" (SCEPA Working Paper Series). Schwartz Center for Economic Policy Analysis (SCEPA), The New School.
- Iddris, F. (2016). Measurement of innovation capability in supply chain: An exploratory study. International Journal of Innovation Science, 8, 331–349. doi:10.1108/IJIS-07-2016-0015
- Johor Port authority. (2014). Towards sustainable port operation & development: Green port policy 2014–2020. Retrieved from https://www.ptp.com.my/PTP/]14ce0c57-bce4-44b5-bb59-3c49bf46faf0.pdf
- Laem Chabang port. (2017). Environmental and social. Retrieved from https://www.laemchabangportnew.com
- Laxe, F. G., Bermúdez, F. M., Palmero, F. M., & Novo-Corti, I. (2016). Assessment of port sustainability through synthetic indexes: Application to the Spanish case. Marine Pollution Bulletin, 119, 220–225. doi:10.1016/j.marpolbul.2017.03.064
- Leading the Future Sustainability. (2016). DP World Annual Report and Accounts 2016. Retrieved from https://www.dpworld.com/en/investors/financials-and-Presentations/financial-reports/annual-reports
- Lopes, I. T. (2012). Seeking a sustainable development scoreboard: Beyond the agency theory. Socialinės technologijos/Social Technologies, 2(2), 273–289.
- Lu, C. S., Shang, K. C., & Lin, C. C. (2016a). Examining sustainability performance at ports: Port managers’ perspectives on developing sustainable supply chains. Maritime Policy & Management, 43(8), 909–927. doi:10.1080/03088839.2016.1199918
- Lu, C. S., Shang, K. C., & Lin, C. C. (2016b). Identifying crucial sustainability assessment criteria for container seaports. Maritime Business Review, 1, 90–106. doi:10.1108/MABR-05-2016-0009
- MacCallum, R., Widaman, K., Preacher, K., & Hong, S. (2001). Sample size in factor analysis: The role of model error. Multivariate Behavioral Research, 36(4), 611–637. doi:10.1207/S15327906MBR3604_06
- Mora, E. P., Orejas, J. M., Subirats, A., Ibanez, S., & Alvarez, P. (2005). Development of a system of indicators for sustainable port management. Marine Pollution Bulletin, 50, 1649–1660. doi:10.1016/j.marpolbul.2005.06.048
- Mori, R., Jr, & Best, P. (2017). GRI G4 content index: Does it improve credibility and change the expectation-performance gap of GRI-assured sustainability reports? Sustainability Accounting, Management and Policy Journal, 8, 571–594. doi:10.1108/SAMPJ-12-2015-0115
- Office of the National Economic and Social Development Board. (2017, August 1). The twelfth national economic and social development plan (2017–2021). Retrieved from https://www.nesdb.go.th
- Port of Kaohsiung Environmental Report. (2016). Taiwan International Ports Corporation, Ltd. Retrieved from https://www.twport.com.tw/Upload/A/RelFile/CustomPage/2920/f244a4ab-5d64-4189-9075-cff288eabc6d.pdf
- Port of Long Beach Sustainable Design and Construction Guidelines. (2010).
- Port of Los Angeles. (2014). Sustainability report: July 2013–June 2014.
- Port of Rotterdam Authority. (2008). The sustainable port: Project organization. Maasvlakte 2
- Puig, M., Wooldridge, C., & Darbra, R. M. (2014). Identification and selection of environmental performance indicators for sustainable port development. Marine Pollution Bulletin, 81, 124–130. doi:10.1016/j.marpolbul.2014.02.006
- Review of Maritime Transport 2015. (2015). Retrieved from https://www.unctad.org
- Roh, S., Thai, V. V., & Wong, Y. D. (2016). Towards sustainable ASEAN port development: Challenges and opportunities for Vietnamese Ports. The Asian Journal of Shipping and Logistics, 32(2), 107–118. doi:10.1016/j.ajsl.2016.05.004
- Sakar, G. D., & Cetin, C. K. (2012). Port sustainability and stakeholder management in supply chains: A Framework On Resource Dependence Theory. The Asian Journal of Shipping and Logistics, 28, 301–320. doi:10.1016/j.ajsl.2013.01.002
- Ssilian, L., Jaegler, A., & Cariou, P. (2016). A literature review on port sustainability and ocean’s carrier network problem. Research in Transportation Business & Management, 19, 19–26. doi:10.1016/j.rtbm.2016.03.005
- Stojanovic, T. A., Ormerod Smith, H. D., & Wooldridge, C. F. (2006). The impact of the habitats directive on European port operations and management. Geo Journal, 65, 165–176. doi:10.1007/s10708-006-0004-2
- Sustainability Report 2015. (2015). Bremen ports.
- Sustainability Report 2016. (2016). Annual sustainability report – 2016 Santos Brasil.
- Sustainability Report 2017. (2017). Port of Antwerp.
- Tanjung Pelepas port. (2017). MMC corporation Berhad Annual Report 2017. Retrieved from https://www.mmc.com.my/MMC20Annual%20Report%20201720small%20file%20size.pdf
- The maritime and port authority of Singapore and its subsidiary. (2016). MPA Sustainability/Integrated Report 2016. Singapore. Retrieved from https://www.dpworld.com/en/investors/financials-and-Presentations/financial-reports/annual-reports
- UNCTAD. (2016). Retrieved from https://www.unctad.org
- United Nations. (2017). UN sustainable development. Retrieved from https://www.un.org
- Vanichbuncha, K. (2010). Statistical package for the social science for windows. Bangkok: ChulaPress.
- Xiao, Z., & Lam, J. S. L. (2017). A systems framework for the sustainable development of a Port City: A case study of Singapore‘s policies. Research in Transportation Business & Management, 22, 255–262. doi:10.1016/j.rtbm.2016.10.003
- Zhang, Y., Kim, C. W., Tee, K. F., & Lam, J. S. L. (2017). Optimal sustainable life cycle maintenance strategies for port infrastructures. Journal of Cleaner Production, 142, 1693–1709. doi:10.1016/j.jclepro.2016.11.120
Appendix
(Questionnaire example)
Questionnaire (13 pages)
(Key Performance Indicators-KPIs of Sustainable Port Management)
Instructions
Section one: The demographic information.
For this section, please check (✓) and fill in questions to indicate your company and personal information about Company name, Port/Terminal operator, ISO certificate, PSHE-MS member, Type of port, Position, Responsibility, and Education.
Section two: The influence of sustainable port KPIs to sustainable port management
For this section, please check (✓) in the important levels of sustainable port KPIs to sustainable port management that corresponds to your opinion.
The important levels are estimated with 1−10 levels including:
1–10 = The levels of importance of sustainable port KPIs from Strongly disagree (1-low) to
Strongly agree (10-high) that affect sustainable port management.
Section 1: Please check (✓) and fill in questions to indicate your company and personal information.
1.1 Company information
1.1.1 Company name: ……………………………………………………………….
1.1.2 Port/Terminal operator: …………………..……………………………………
1.1.3 ISO certificate:
() Yes; Specify:…………………………….…………………………………
() No
1.1.4 PSHE-MS member:
() Yes
() No
1.1.5 Type of port:
() Container port
() Non-container port
() Multi-purpose port
() Other; Specify:…………………………….………………………………
1.2 Company information
1.2.1 Position
() Top manager
() Middle manager
() Operation manager
() Administrator
1.2.2 Responsibility
() port management
() Sustainable development
() Other; Specify:…………………………….………………………………
1.2.3 Education
() Doctor’s degree, Major in……………………………..……………………
() Master’s degree, Major in……………………………………………………
() Bachelor’s degree, Major in……….…………………….….………………
() Other: specify,……………..………….………………….…………………
Section 2: Please check (✓) in the important levels of 156 sustainable port KPIs to Sustainable Port
Management
Table 2.1. Environmental–sustainable port KPIs (48 KPIs)
Table 2.2. Social – sustainable port KPIs (45 KPIs)
Table 2.3. Economic – sustainable port KPIs (43 KPIs)
Table 2.4. Organization Management – sustainable port KPIs (20 KPIs)
2.5 Other sustainable port KPIs and the levels of important
……………………………………………………………………………………………………………………………………………………………………
……………………………………………………………………………………………………………………………………………………………………
……………………………………………………………………………………………………………………………………………………………………
……………………………………………………………………………………………………………………………………………………………………
……………………………………………………………………………………………………………………………………………………………………