
Abstract
The main objective of this paper is to develop and validate a methodology to select the most important key performance indicators from the balanced scorecard. The methodology uses and validates the implicit systemic hypothesis in the balanced scorecard model, together with a qualitative and statistical analysis. It helps to determine a small set of indicators that summarizes the company’s performance. The method was tested using actual data of 3 complete years of a multinational manufacturing company’s balanced scorecard. The results showed that the scorecard can be summarized in six metrics, one for each dimension, from an initial scorecard composed of 90 indicators. In addition to reducing complexity, the method tackles the hitherto unresolved issues of the analysis of the trade-offs between different dimensions and the lagged effects between metrics.
PUBLIC INTEREST STATEMENT
The balanced scorecard has been revealed as one of the most used performance management systems for all types of companies. It provides a comprehensive framework to control and manage not only the key indicators of short-term financial performance, but also the long-term. It allows long-term management by adding non-financial indicators to traditional financial ones. This approach, which has proved beneficial for business management, leads to an increase in complexity. This paper provides a methodology to reduce the complexity of the balanced scorecard, so that the evolution of the company can be explained by a few indicators. In the case study, the application of the methodology reduced the complexity of the balanced scorecard from 90 indicators to 6 with minimal loss of information in practical terms.
1. Introduction
Anthony (Citation1965) describes how the systems of an organization work to accomplish effective strategic planning. He remarks on the hierarchical structure being based on three different functional levels: strategic planning, management control, and operational control. He outlines the need of these levels, the differences and the relationship among them. Anthony also claims in his work that strategic planning is based on an estimate of the cause-and-effect relationship between an action and its related result. He also states that due to the complexity of the relationships between the different factors, it turns out to be more an art than a science, which has also been remarked by Kaplan (Citation2009).
The main objective of this work was to reduce the number of key performance indicators (KPIs) at the strategic level by selecting the main ones in order to make periodic performance analyses easier and more effective. The developed methodology helps to select a few KPIs that summarize the whole BSC and, therefore, the company’s performance. The resulting group of selected KPIs includes the “output” metrics (dependent variables), which serves as a starting point to analyze the effectiveness of certain strategies and actions, which are also measured by KPIs, but are “input” KPIs in this case. The analysis and selection of the main output KPIs are not sufficiently addressed in the literature. The posterior analysis and the determination of the effectiveness of the strategies and actions adopted throughout the year are complex and not effective. It was determined at the beginning of the research project that the development of a robust scientific method to reduce the number of KPIs is a vital aspect to improve the use of the BSC.
Apart from reducing the BSC’s complexity at the strategic level by allowing senior management to focus on the main KPIs, the analysis of the potential trade-offs between the KPIs from different perspectives or dimensions (Hoque, Citation2014) is the most cited unresolved problem in the literature on the use of the BSC. Noerreklit (Citation2000) points out that the potential existence of lagged effects between variables remains unsolved, and that the fundamental idea of the cause-and-effect relationships between KPIs from different dimensions is unclear, or is at least controversial. She presents the idea that the different dimensions making up a system are all interconnected, but are on the same level, with no specific and fixed chain of cause-and-effect relationships.
As discussed in the next section, some relevant studies have been conducted on determining the effectiveness of strategies and actions using KPIs from the BSC. These works omit or fail to report important aspects of selecting and analyzing the relationships among the system’s main “output” KPIs. Therefore, the result is not clear in effectiveness terms.
The method proposed herein is based on the fundamental idea of an implicit systemic model in the BSC proposed by Noerreklit (Citation2000), which changes the model of the fixed cause-and-effect relationships proposed by Kaplan and Norton (Citation1992). It allows the potential trade-offs and delayed effects between variables to be analyzed, and takes advantage of them to drastically reduce the number of KPIs and, thus, the BSC’s complexity.
The need to not control only financial factors to run a company has been widely indicated by scholars and practitioners, and confirmed by analytical studies (Banker, Chang, Janakiraman, & Konstans, Citation2004; Hoque, Citation2014).
This research was conducted as part of a collaboration agreement between the Universitat Politècnica de València and the company (a multinational global leader in the automotive industry with hundreds of thousands of workers worldwide) where the methodology was developed and validated. The research work was proposed by the company as part of its strategic initiative for improving management methods. The method was implemented for the balanced scorecard (BSC) of the Spanish subsidiary company and was included in future strategies that were to be globally implemented. Readers of this document should be aware that the collaboration agreement included some terms of confidentiality, which restricted the publication of the details of the KPI data involved in the study and the identity of the company, since the balanced scorecard is considered confidential.
2. Literature review
Anthony’s hierarchical and interrelated view (Anthony, Citation1965) is further developed by Kaplan and Norton (Citation1992). They widely develop and propose a system in which the factors from four different dimensions (each represented by a set of measures) work as a structure with cause-and-effect relationships to enable managers to control the whole organization by setting targets on performance measures, establishing actions, and tracking their evolution and accomplishment. The whole system is based on two main ideas or concepts: 1) the cause-and-effect relationship among the four dimensions of metrics, which are key for the control purpose of Management; 2) an organization’s future success is not based only on financial measures as its capabilities are based more on intangible assets, such as investing in human capabilities and how the organization is doing in relation to both its internal processes and its external relationships with customers and other stakeholders.
Kaplan (Citation2009) recently claimed that it is necessary to set clear thresholds and to establish clear relationships between lagging and leading indicators, which can be understood as input and output factors when using the language from systemic modeling to better serve the management control purpose.
Noerreklit (Citation2000) comes to a similar conclusion by claiming that one of the main problems of today’s BSC is the assumption of the cause-and-effect relationships in the chain established by Robert S. Kaplan:
Measures of organizational learning and growth -> measures of internal business processes -> measures of the customer perspective -> financial measures
and described in more detail by Kaplan (Citation2009) in his concept map.
The company in which the present method was validated has used the BSC and its related processes for policy deployment (PD) and continuous improvement (CI) purposes throughout all its factories and development centers worldwide for years. This company, and most of those from the automotive sector that have implemented lean manufacturing as a CI methodology, uses a version of the BSC with a slightly different classification of dimensions (Dennis, Citation2006) for its manufacturing facilities, but with the same foundations, which thus includes financial and non-financial indicators.
The use of statistical tools for the purpose of this study, as proposed by Rodriguez et al. (Citation2009), is also sufficiently explained by the idea of the availability and internal knowledge of these techniques inside the big companies of the manufacturing industry, which is one of the possible roadblocks presented by Kaplan (Citation2009). Such internal knowledge is needed to continuously adjust models when the company’s context and, therefore, the strategy change, as does the set of metrics chosen to form part of the BSC.
Nevertheless, the available literature on the BSC in the manufacturing environment and works about other techniques were explored as part of the present study (Anand, Sahay, & Saha, Citation2005; Ferenc, Citation2011; Junior, Marqui, & Martins, Citation2008; Malmi, Citation2001).
These works, which focus on the manufacturing environment, are qualitative and descriptive. Only a few suggest using specific alternate techniques to cope with the main BSC issues currently addressed by practitioners and scholars, which are the object of the present work. The conclusions are about the difficulties of discovering the real and understandable relationships and weights inside the BSC which directly affect the sustainability of the system’s management.
Some works (Bansal, Kauffman, & Weitz, Citation1993; Walczak & Cerpa, Citation1999; Zupan, Citation1994) deal with a comparison made between using statistical tools and artificial neuronal networks (ANN) to discover relationships among factors in complex systems. Some state that ANN techniques are preferable for this purpose instead of regression techniques, which are the most widely used as the basics of a statistical set of tools for systemic analyses. After conducting a detailed review of these works, which compared these two types of techniques and the assumptions made to draw this conclusion, the final categorical statement of one tool being more precise in the results obtained than the other is, at least, controversial.
Fuzzy logic, which has been studied by Gurrea, Alfaro-Saiz, Rodriguez-Rodriguez, and Verdecho (Citation2014) and Chytas, Glykas, and Valiris (Citation2011) as a pro-active tool to develop the BSC using expert opinions, does not match the main purpose of the present work as it better serves as a method to design the BSC composition when actual data are still unavailable.
Rodriguez et al. (Citation2009) use a graphical tool based on the principal component analysis (PCA) to first select the main KPIs by ruling out those with no weight in the system. This is followed by partial least squares (PLS) regression to quantify their weight. They take advantage of using these multivariate analysis (MVA) techniques as they can be applied when there are only a few data points available, or when these are even fewer than the number of variables (KPIs). The common problem of the co-linearity between the input variables present in other statistical regression methods is an advantage rather than an issue in PLS. They apply PCA by grouping all the KPIs together, which are the input and output variables (dependent and independent variables). KPIs are ruled out based on the criteria of weight. So output and input variables (by pairs) can be ruled out because these specific actions or strategies are not effective. Hence the selection of the main output variables is not the purpose of the study when it begins, rather the effectiveness of these specific actions (input variables). Moreover, they use two charts that are combinations of the three principal components. The selection of which components and combinations are to be used to select the main KPIs is arbitrary, or is at least not sufficiently explained. PLS as a regression technique is not only used to define the cause-and-effect relationships between actions and results, but it also uses the controversial chain of the cause-and-effect relationships from the BSC model as a fact to establish the regression model without providing a detailed justification of any evidence for the actual existence of such a chain of relationships. There are basically two different PCA methods; one uses the covariance matrix to extract the principal components, and the other employs the correlation matrix. The study does not mention which one is used for the proposed methodology. When dealing with variables with different scales, which is what happens with BSC KPIs, it is necessary to use a correlation matrix, otherwise the results can drastically change. Hence the conclusions that derive from them can be wrong. The systemic approach, which allows the potential trade-offs between different dimensions and the potential lagged effects between variables to be addressed, is not addressed herein.
Morard, Stancu, and Jeannette (Citation2013) also use PCA and PLS to establish the relationships between input and output variables, but the limitations in the work of Rodriguez et al. (Citation2009) are not sufficiently resolved and, once again, the systemic analysis for the potential trade-offs and delayed effects is not addressed.
Boj, Rodriguez-Rodriguez, and Alfaro-Saiz (Citation2014), who apply ANP to establish the causal relationships between intangible resources or assets and strategic outputs in a non-profit organization, actually show the benefits of the method applied to the BSC context, but do not address either the potential trade-offs between the different dimensions or the lagged effects between KPIs.
Grillo, Campuzano-Bolarin, and Mula (Citation2018) use multiple linear regression (MLR), which is a univariate statistical method, instead of MVA regression techniques like PLS. They do not make any assumptions about the structure cause-and-effect relationships, and the study is based on the classification of independent variables (input/actionable KPIs) and dependent ones. However, by using the variance inflation factor (VIF) of the variables included in the regression equations, they confirm that there is no co-linearity between them, and the variables not included in the model can be ruled out by the criteria of having a high VIF value, which is a limitation for the technique already resolved in previous works by using PLS instead of MLR. MLR also needs more data points than MVA techniques. As no systemic analysis between output (dependent) variables is present before applying MLR, the study does not take into account the potential trade-offs and lagged effects.
Ku, Storer, and Georgakis (Citation1995) confirm that the use of PCA with the original variables does not correctly model the behavior of dynamic systems. They use dynamic principal component analysis (DiPCA) instead to model dynamic behavior. They apply a lag shift in the original variables to obtain an augmented data matrix where original variables coexist with the transformed ones (lagged). They point out that, although a second-order transformation (2 lags) is sufficient in most cases, it is important to establish how many delays are necessary to describe the system, since the variables are measured very often in process monitoring and data matrix can increase in size very fast. To solve that problem, they develop and test a 10-step method to establish the order of the dynamic system. Dong and Qin (Citation2018) solve this problem by projecting the original variables into internal latent variables that explain the dynamic behavior of the system, thus reducing the complexity of the algebraic problem to be solved. The DiPCA methods not only solve the problem of modelling the dynamics of the system, but also allow analyzing it in detail by separating the dynamic behavior from the static.
To summarize, our proposed methodology focuses on the limitations of previous methods, and on the critical aspects and unaddressed issues of the BSC model, which are:
Potential trade-offs between KPIs from different dimensions
Potential lagged effects between KPIs
Potential lagged effects between KPIs
Based on a systemic model instead of assuming a fixed chain of cause-and-effect relationships
Reducing complexity due to many KPIs not having well-established relationships
Justified selection of which principal components are based on their statistical significance
Using MVA techniques to address the co-linearity effect and small sample size issues
The result of addressing these limitations and issues is a method followed to select a small set of the main KPIs with clear and weighted interrelationships to explain the whole BSC and, thus, the whole company as a system. Although it is beyond the scope of the present work, the resulting selection of KPIs can be used later to apply regression methods (Sanchez-Marquez, Guillem, Vicens-Salort, & Vivas, Citation2018b) or other statistical methods, such as the statistical system management method (SSMM) developed by Sanchez-Marquez, Guillem, Vicens-Salort, and Vivas (Citation2018a), as part of a more effective comprehensive method.
3. The proposed methodology
In order to deploy the strategy and, more specifically, to adopt it as proposed by several authors (Dennis, Citation2006; Kaplan & Norton, Citation1996a, Citation1996b; Otley, Citation1999; Verdecho, Alfaro-Saiz, & Rodriguez-Rodriguez, Citation2014), it is essential to know the systemic relationships between the different dimensions because they can affect the result.
One of the most extended structures to deploy strategies and objectives in a manufacturing environment, especially in companies that take implemented lean manufacturing as a production system, is that with six or seven Operating Systems (OS). It is a method with dimensions that collect KPIs of the same nature and level, and is a similar approach to the 4-perspective BSC of Kaplan and Norton (Citation1992). This approach is SQDCME, which stands for Safety, Quality, Delivery, Cost, Morale and Environment. The multinational company, which serves as a case study for the present work, adopted this model many years ago. The system is described by Dennis (Citation2006), although some adjustments can be made, such as including one additional OS for maintenance to the typical six, which are Safety, Quality, Delivery, Cost, Morale (or People) and Environment. However, the method that Dennis describes, in relation to the way the company uses the BSC to deploy objectives, strategies and, then, tactics and actions to meet high-level objectives, is that mentioned by other authors (Noerreklit & Schoenfeld, Citation2000). It is a dialog process, normally known as the catch-ball process, between the representatives or the people responsible for the level that deploys the objectives and strategies, and the level that is receiving and setting up its own. Kaplan (Citation2009) claims that this process is more an art than a science.
The method must address those limitations and unresolved issues identified in the literature review in the previous section. Below these issues, and the way our proposed method tackles them, are provided in detail:
Complexity reduction: the way in which the methodology is designed for it aim to reduce the number of KPIs by ensuring that, in the end, at least one KPI remains in each OS to explain each dimension and to, thus, allow the analysis of the entire system, despite the few KPIs
Systemic analysis of the potential trade-offs between dimensions: using the vector view of the loading plot of the principal component (Figure ), complemented by the analytical component analysis (Table ), are the tools for the potential trade-offs analysis
Lagged effect between KPIs and/or dimensions: using DiPCA (lagged time series) allows the potential lagged impact of KPIs on the system to be studied
Cause-and-effect assumption: we avoid making any assumption by using DiPCA, which is based on a correlation matrix. If the coefficients of the variables from different dimensions are similar, this would confirm the hypothesis of Noerreklit (Citation2000), rather than that of Kaplan, which places all the dimensions at the same hierarchical level.
Sample size: the use of DiPCA will allow us to use samples with a small number of data points, even with less variables than observations.
Different scales of KPIs that can bias the study: using the correlation matrix to extract the principal components instead of the covariance matrix.
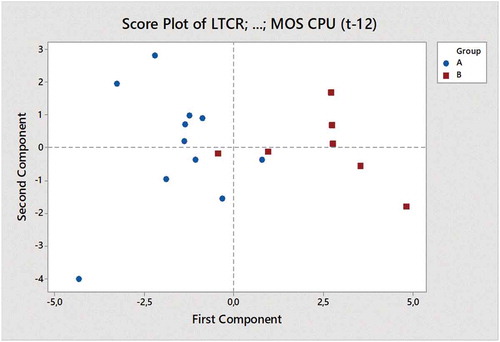
How many and what principal components are to be used to avoid an arbitrary selection: our starting point involves using the number of principal components that explain 80% of total variance (Rencher, Citation2003). Nevertheless, we further simplify the study by verifying if only the two first principals based on the extended Tukey’s Quick Test, as proposed by Gans (Citation1981) and assisted by the dendogram (Figure ) and the score plot of the classified observations (Figure ). This method ensures that the components we use are statistically significant to reach conclusions and to simplify the analysis.
Table 1. KPIs selected from phases 1 to 3
Table 2. The final correlation weights matrix
Table 3. Principal components analysis
This is explained as the outcome of a systematic process involving experts from each OS, which are Safety, Quality, Delivery, Cost, People (aka Morale in some companies), Maintenance and Environment, along with actual data from the metrics of 3 consecutive years, which is used to make up the statistical analysis.
The methodology consists of several well-distinguished phases:
Phase 1: Selection of the potential KPIs that may represent each OS inside the BSC. This first reduction in complexity is based on logical, and even arithmetic, well-known relationships (Noerreklit, Citation2000) between the metrics belonging to the same OS. The first reduction is based on the selection of the output variables of each dimension, and then on well-known relationships
Phase 2: Determination of the potential lagged effects of some variables on the whole system. These variables will be transformed to allow phases 4 and 5 to be analyzed. It is based on the criteria of subject matter experts (SME). These potential lagged impacts will be proved or not when analyzing phases 4 and 5
Phase 3: Use of univariate correlation pairwise relationships (Pearson’s correlation coefficient) to further reduce the model by removing any highly correlated variables (ρ > 0.8) and those that belong to the same OS. Identification and selection of variables that have significant (p-value < 0.05) lagged effects on the system. The principle behind this criterion is that two variables with a high correlation inside the same dimension are different measures of the same concept
Phase 4: Use of a correlation matrix in the reduced remaining model from phase 3 to establish the weights of each KPI within the BSC and to develop the univariate simplified correlation weights matrix (Table ). It includes the potential lagged effects identified in phase 2
Phase 5: Use the DiPCA method to test the reliability of the model discovered in Phase 4. New relationships/weights may also be discovered apart from the confirmation of those discovered in phase 4
Phase 6: Analysis of the results and selection of the main KPIs in the BSC. Considering the possibility of a new iteration going back to Phase 1/3 if any OS/dimension was not well represented by the already explored metrics.
The flow chart shown in Figure schematically summarizes the methodology.
Figure 1. Methodology flow chart
Although it is beyond the scope of this paper, the final selection of the output KPIs, together with the trade-offs between dimensions and lagged effects which result from the present method, provide practitioners with the optimum input to assess the effectiveness of specific actions and strategies in a more effective comprehensive method than those suggested in the literature. At this point, practitioners can choose among regression methods (Sanchez-Marquez et al., Citation2018b), such as PLS, or other statistical methodologies like SSMM (Sanchez-Marquez et al., Citation2018a), depending on what the type of analysis needed.
The starting point of the study conducted in the company was a BSC composed of 90 KPIs. Such a high level of complexity makes the periodic analysis of the whole system very complicated and ineffective. The main purpose of the periodic analysis is to assess if specific actions and strategies, measured by input KPIs, are effective by looking at the evolution of the output KPIs. Here we do not provide a detailed description of all 90 KPIs for confidentiality reasons. The first complexity reduction from phase 1, based on removing the input KPIs, led to a 50% reduction in the number of KPIs. Well-known relationships are also effective to further reduce the number of KPIs. As examples of such, the safety pyramid from Heinrich’s theory (Heinrich, Petersen, Roos, & Hazlett, Citation1980) allows us to leave LTCR as the only output KPI for the Safety OS. The correlation between internal quality metrics (OFF-LINE, ON-LINE) and warranties is also a well-known relationship among practitioners. Nevertheless, in order to confirm that correlation, some metrics were reduced in phase 3, where the high correlation between them is confirmed as being higher than 0.8. The correlation is not only between the internal and external metrics, but also between the different internal ones. Hence the results suggest leaving only one KPI for the Quality OS. In this case, an internal KPI is chosen as the representative indicator for Quality. At first glance, this decision seems contradictory to that made for Safety because internal defects are detected before, so they may cause external ones. Nevertheless, the decision is based on the speed to react and to, thus, improve indicators because indicators of warranties are provided only when enough cars are sold, and internal indicators are immediately available. Similar reductions are made for the other OSs based on the criteria of phases 1 and 3. The result is summarized in Table . This is the set of KPIs that serves as input for phase 4.
Further considerations are provided in detail below as part of the qualitative and quantitative analyses done in phases 1 to 3:
SAFETY: The international agreement of the essential metric in Safety is Lost Time Case Rate (LTCR). Nevertheless, other potential KPIs are also considered
QUALITY: Internal metrics, which are On-Line Repairs (D/1000) and Off-Line Repairs (also measured in Defects per Thousand, D/1000), are our Quality Key Metrics (ON-LINE and OFF-LINE). Internal Quality indicators serve as good indicators of Quality as warranties are somehow a fraction of them. Off-line and On-line have a correlation coefficient higher than 0.8, so only ON-LINE remains as an indicator of Quality
DELIVERY: Production to Schedule (PTS), which includes Volume, Mix compliment, would be our Delivery Key Metric. As PTS affects customer satisfaction, it is considered a strategic KPI
COST: Labor and other Over Head Cost per Unit (L&OH CPU) are our Cost metrics (Financial). It includes all the manufacturing costs and investments, and both fixed and variable ones
PEOPLE: Unplanned absenteeism is our Key Performance Metric for People/Morale
MAINTENANCE: Maintenance performance is well summarized in Throughput to Potential (%) (TTP), which is the amount of production on automated lines in relation to that required, as defined by the capacity of equipment and Maintenance Cost per Unit (MOS CPU), which is the cost per unit of the whole Maintenance OS
ENVIRONMENT: Environment metrics are not within the scope of this study.
The lagged time series technique is used to identify any significant lagged effects between variables. So we can work for 1-month time delays by placing in, for example July, what happened in June, and in terms of safety issues measured, for example, by LTCR. So these defined variables would be named as, for example, LTCR (t-6), which stands for the LTCR value 6 months ago.
4. Discussion of the results
The Minitab software package was used to help with the statistical analysis, but any other statistical package that is widely used worldwide by practitioners and scholars can serve the same purpose (e.g. SPSS, R, Matlab, SAS, Statgraphics, etc.).
To help clarify the interpretation of the results, a summarized and simplified correlation matrix is deployed (see Table ) as part of the methodology.
Pearson’s correlation coefficients and their related p-values are highlighted only in the cases that show some degree of relationship. To help understand and analyze such an extended matrix, we define a new code that assigns weights from 1 to 4 for Pearson’s coefficients with p-values ≤ 0.05 (5% of significance), and with values above 0.4 for Pearson’s coefficient. So the weights are:
0.4 < ρ ≤ 0.6; weight = 1, which shows some degree of relationship
0.6 < ρ ≤ 0.7; weight = 2, which shows a moderate degree of relationship
0.7 < ρ ≤ 0.8; weight = 3, which shows a strong degree of relationship
ρ > 0.8; weight = 4, which shows a very strong degree of relationship
The sign of the relationship is shown as “+”, a symbol that stands for a direct (incremental) relationship of the regression line, and as “-”, a symbol for the inverse relationship of the regression line between both studied variables. The final simplified correlation matrix is found in Table . .
The correlation matrix shown in Table allows us to reach some systemic and some specific conclusions. Five indicators share most of the effect on the complete system as they acquire the majority of the variance explained by the force of the correlation denoted by weight. Those KPIs are: TTP-B, ON-LINE, ABS, L&OH CPU and TTP-A.
The interesting, and even controversial, impact of some variables might be the objective of future research, such as the effect of Absenteeism on the whole BSC, which is the only identified trade-off. An increase in the percentage of absenteeism and, thus, deterioration shows a correlation with the improvement made to other metrics. Although a deeper analysis of this apparent trade-off is necessary, one possible hypothesis mentioned by executives during the study is that a minor deterioration in absenteeism can be beneficial in total cost terms (L&OH CPU) if the maximum threshold is not surpassed. This threshold is calculated as having enough employees to cover all manufacturing operations. Therefore, the most likely explanation for this apparent paradox and trade-off is that the maximum calculated threshold was not surpassed for most of the 3-year period that the study lasted. When looking at the actual variation in the ABS percentage, it is considered a minor variation, which proves positive in this case study. If the variation in the ABS percentage is not considered minor, then the conclusion would have been that the workforce needed to be better adjusted.
The next analysis confirms the previous result, and even reinforces it with new relationships.
The adopted technique is the DiPCA, selected following the criteria that PCA-based techniques can be used to explain the relationships between a set of dependent or independent variables, and can be an end itself; Rencher (Citation2003). This technique is normally used to reduce and simplify a set of variables into a smaller set of latent variables to serve as the starting point for further research using techniques like PLS. The result can be used for future research works about the relationship between inputs or independent variables and KPIs.
We need six principal components (Table ) to reach at least 80% total variance. Note that the cumulative variance explained by the six first principal components is 82.2% (0.822).
We use another multivariate technique, known as observations clustering (Figure ), which classifies observations into groups following similarity correlation criteria (Rencher, Citation2003).
Figure 2. Dendrogram diagram
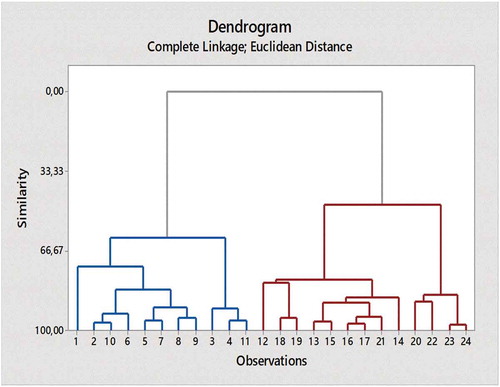
Using a classification based on the two first principal components and the two clusters of observations found in Figure , we confirm the effectiveness of splitting observations into two groups.
When we look at Figure , and apply the extended non parametric Tukey’s Quick Test (Gans, Citation1981), if the count of non-overlapping observations equals or exceeds 14 (15 in our case), we can conclude that the two groups differ, with a confidence level of 99.9% (when N-n = 4, and n = 7). By doing so, we ensure that by using only the two first principal components for the analysis, the conclusions drawn from it have at least a 0.1% significance level, which is much more significant than the typical ones of 5% and 1% recommended by Fisher (Citation1992), and used by research workers since then.
Figure 3. Score plot with principal components grouping
To better interpret the results in Table , Figure shows a concept map that explains the structure of the BSC in terms of the relationships between KPIs and their weights.
Figure 4. Latent structure of the relationships and weights of KPIs
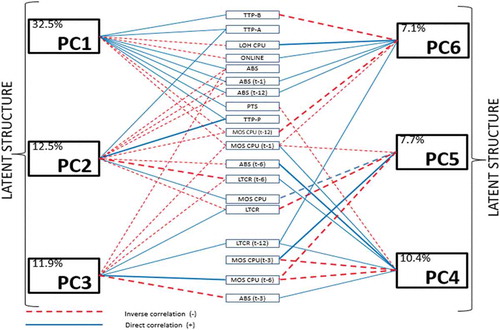
In Figure , the type of line (dashed/continuous) stands for the sign of the coefficient shown in the table on the previous page, while the thickness of the line stands for the contribution of each variable to the principal component (PC) that it belongs to. So the greater thickness is, the more the variable contributes to the PC. The contribution of each principal component is shown inside the box of each PC.
The correlation is positive (+) or direct when the contributions to the latent variable of the observables ones take the same type of line (the same sign in the table on the previous page), and is negative or inverse when the type of line differs.
The correlation between factors of the same dimension, such as those from Quality (ON-LINE) and line performance (TTP-A, B, P), is confirmed, along with their impact on Operating Cost (L&OH CPU), as predicted by Kaplan and Norton (Citation1992).
The present results also confirm the impact of the lagged variables, such as LTCR and ABS shown in phase 4 (Table ). As expected, some new relationships appear when multivariate analysis methods are followed. The results of both techniques can be interpreted in the same sense as no contradictions are present.
As confirmed by the Tukey’s Quick test based on the score plot shown in Figure , the whole system can be explained in practical terms by only two PCs. In Figure , these two PCs summarize the BSC based on a bi-dimensional vector view.
Figure 5. The bi-dimensional vector view
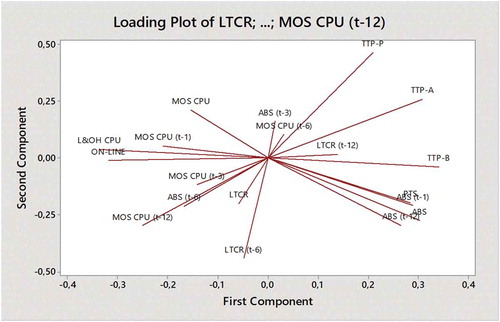
The bi-dimensional vector view, which is much easier to interpret than the complete latent structure in Figure , helps choose the most influent metrics in the system. The similarity between indicators is explained by the angle of the vectors regardless of their sense. So the closer the vectors, the more similar the vectors are to one another. The sense of vectors stands for the sign of the coefficient; so if two vectors have the same sense, their coefficients have the same sign. Vector length stands for the force of the metrics in the BSC; e.g., TTP-B, L&OH CPU and ON-LINE are the three KPIs that most strongly influence the first PC and, therefore, influence the System. ABS and PTS are very similar and come very close to the first PC. LTCR, in its lagged form with a 6-month delay, and TTP-P also strongly influences the system through the second PC.
Based on those findings, and by maintaining the structure of seven OPs, the decision of the executive board based on the analysis of these results for the final set of Key Breakthrough Performance Indicators is that shown in Table .
Table 4. Final selection of KPIs
The Environment OS goes beyond the scope of this study. However, it must be demonstrated that the interest in it guarantees the environmental sustainability of the companies, but its short-term influence on companies’ cost structure may bias the result of the study, which would be meaningless in environmental sustainability terms. Therefore, the Environment OS could be the objective for a future study.
The company’s BSC is driven mainly by only six KPIs, which can be monitored by the Executive Board, and the rest can be analyzed in detail to find the reasons why these six display a certain trend when needed to form part of the process to reach yearly targets. In the end, the proposed method results in a significant reduction in complexity.
5. Conclusions and future research
To summarize, we reach the following conclusions:
BSC complexity can be drastically reduced to a very small set of a vital few KPIs without incurring significant risk of losing important information for an enterprise’s performance analysis at strategic and tactical levels
This paper proposes a methodology to gain knowledge about the relationships among KPIs and their weights in the BSC, by not making any previous assumption about either relationships or their weights/signs, which can bias the results
Based on the similar final weights of the KPIs that explain each OS, we conclude that the systemic model proposed by Noerreklit and Schoenfeld (Citation2000), where all the OSs have the same hierarchical level, better matches the results than that proposed by Kaplan and Norton (Citation1992), based on fixed cause-and-effect relationships between dimensions. Therefore, the use of regression methods only makes sense between input KPIs and the selected set of vital KPIs, and not between the output KPIs from different dimensions
The analysis of the weight and sign between KPIs from the different dimensions included in this methodology helps to identify the trade-offs between them, and not expected relationships, and can reinforce expected ones, which can be used to better set up targets, correct on-going strategies and tactics, and reinforce those that serve to improve the results of the whole system
This methodology confirms the existence of lagged effects between variables from different BSC dimensions, as suggested by Noerreklit (Citation2000). Those effects should be quantified in time, and weight terms by applying the DiPCA method
This method is not only useful for adjusting tactics, but for also changing the nature of the system and the relationships between KPIs to modify any detected undesirable relationships. For instance, the effect between TTP-B and TTP-P is not significant because these two sections of the factory are detached by storage that is not always filled. So stoppages from ahead or behind are buffered. In the past, before this storage was built, these two metrics could have been correlated and shown a stronger interrelationship
In the methodology, enough statistical significance for performing practical analyses and reaching conclusions is ensured as it includes an analysis of the statistical significance of the principal components chosen for the analysis, and thus avoids arbitrary selections
The selected set of KPIs, together with the qualitative analysis of the trade-offs and lagged effects that result from applying this methodology, can be used to perform the analysis of the effectiveness of specific actions, tactics or strategies in future research
This methodology can be considered for generalization to other sectors that differ from the manufacturing one in future research.
Additional information
Funding
Notes on contributors

Rafael Sanchez-Marquez
Rafael Sanchez-Marquez holds a PhD in production management and engineering. He is a lean coach and Six Sigma master black belt at Ford Motor Company. His research interests include systemic and analytic methodologies for using KPIs in manufacturing environments.
José Miguel Albarracín Guillem
José M. Albarracin-Guillem Lecturer in operations management, quantitative methods and logistics at the Faculty of Business Administration and Management, Universitat Politècnica de València, Spain. His key research topics include production planning and scheduling, supply chain management, and quantitative methods.
Eduardo Vicens-Salort
Eduardo Vicens-Salort Lecturer in operations management at the School of Industrial Engineering, Universitat Politècnica de València, Spain. He is the editor-in-chief of the International Journal of Production Management and Engineering. His key research topics include production planning and scheduling, supply chain management, and integration of human resources in high automation contexts.
José Jabaloyes Vivas
Jose Jabaloyes-Vivas A lecturer in statistics and quality management at the School of Industrial Engineering, Universitat Politècnica de València, Spain. His main research contributions are to quality management, quality control, change management, and statistical methodology.
Related Research Data
References
- Anand, M., Sahay, B. S., & Saha, S. (2005). Balanced scorecard in Indian companies. Vikalpa, 30(2), 11–18. doi:10.1177/0256090920050202
- Anthony, R. N. (1965). Planning and control systems: A framework for analysis. Boston: Graduate School of Business Administration. Harvard Business School.
- Banker, R. D., Chang, H., Janakiraman, S. N., & Konstans, C. (2004). A balanced scorecard analysis of performance metrics. European Journal of Operational Research, 154, 423–436. School of Management. The University of Texas at Dallas, USA. Retrieved from http://www.sciencedirect.com
- Bansal, A., Kauffman, R. J., & Weitz, R. R. (1993). Comparing the modeling performance of regression and neural networks as data quality varies: A business value approach. Journal of Management Information Systems., 10(1), 11–32. doi:10.1080/07421222.1993.11517988
- Boj, J. J., Rodriguez-Rodriguez, R., & Alfaro-Saiz, J. J. (2014). An ANP-multi-criteria–based methodology to link intangible assets and organizational performance in a balanced scorecard context. Decision Support Systems, 68, 98–110. Retrieved from www.elsevier.com/locate/dss
- Chytas, P., Glykas, M., & Valiris, G. (2011). A proactive balanced scorecard. International Journal of Information Management, 31, 460–468. Retrieved from www.elsevier.com/locate/ijinfomgt
- Dennis, P. (2006). Getting the right things done: A learner’s guide to planning and execution. Cambridge, MA: The Lean Enterprise Institute.
- Dong, Y., & Qin, S. J. (2018). A novel dynamic PCA algorithm for dynamic data modeling and process monitoring. Journal of Process Control, 67, 1–11. doi:10.1016/j.jprocont.2017.05.002
- Ferenc, A. (2011). Balanced scorecard measurement applications at a car manufacturer supplier company. https://pdfs.semanticscholar.org/f10e/409533c49dd2934ace78405126978302ab96.pdf
- Fisher, R. A. (1992). Statistical methods for research workers. In: Kotz S., Johnson N.L. (eds) Breakthroughs in statistics. Springer Series in Statistics (Perspectives in Statistics). Springer, New York, NY.doi: 10.1007/978-1-4612-4380-9_6
- Gans, D. J. (1981, May). Corrected and extended tables for Tukey’s quick test. Technometrics, 23(2), doi:10.1080/00401706.1981.10486265
- Grillo, H., Campuzano-Bolarin, F., & Mula, J. (2018). Modelling performance management measures through statistics and system dynamics-based simulation. Dirección y Organización, 65, 20–35.
- Gurrea, V., Alfaro-Saiz, J. J., Rodriguez-Rodriguez, R., & Verdecho, M. J. (2014). Application of fuzzy logic in performance management: A literature review. International Journal of Production Management and Engineering, 2(2), 93–100. doi:10.4995/ijpme.2014.1859
- Heinrich, H. W., Petersen, D. C., Roos, N. R., & Hazlett, S. (1980). Industrial accident prevention: A safety management approach 5th ed. New York: McGraw-Hill..
- Hoque, Z. (2014). 20 years of studies on the balanced scorecard: Trends, accomplishments, gaps and opportunities for future research. The British Accounting Review, 46(1), 33–59. doi:10.1016/j.bar.2013.10.003
- Junior, I. C. A., Marqui, A. C., & Martins, R. A. (2008). Multiple case study on balanced scorecard implementation in sugarcane companies. http://citeseerx.ist.psu.edu/viewdoc/download?doi=10.1.1.572.3364&rep=rep1&type=pdf
- Kaplan, R. S. (2009). Conceptual foundations of the balanced scorecard. Handbooks of Management Accounting Research, 3, 1253–1269. doi:10.1016/S1751-3243(07)03003-9
- Kaplan, R. S., & Norton, D. P. (1992). The balanced scorecard – measures that drive performance. Harvard Business Review, 70(1), 71–79.
- Kaplan, R. S., & Norton, D. P. (1996a). Using the balanced scorecard as a strategic management system. Harvard Business Review,86(7/8), 150–161.
- Kaplan, R. S., & Norton, D. P. (1996b). The balanced scorecard: Translating strategy into action. Boston, MA: Harvard Business School Publishing.
- Ku, W., Storer, R. H., & Georgakis, C. (1995). Disturbance detection and isolation by dynamic principal component analysis. Chemometrics and Intelligent Laboratory Systems, 30(1), 179–196. doi:10.1016/0169-7439(95)00076-3
- Malmi, T. (2001). Balanced scorecards in Finnish companies: A research note. Management Accounting Research, 12, 207–220. doi:10.1006/mare.2000.0154
- Morard, B., Stancu, A., & Jeannette, C. (2013). Time evolution analysis and forecast of key performance indicators in a balanced scorecard. Global Journal of Business Research, 7(2), 9–27.
- Noerreklit, H. (2000). The balance on the balanced scorecard- a critical analysis of some of its assumptions. Management Accounting Research, 11, 65–88. doi:10.1006/mare.1999.0121
- Noerreklit, H., & Schoenfeld, H. M. W. (2000). Controlling multinational companies: An attempt to analyse some unresolved issues. The International Journal of Accounting, 35(3), 415–430. doi:10.1016/S0020-7063(00)00064-9
- Otley, D. (1999). Performance management: A framework for management control systems research. Management Accounting Research, 10, 363–382. doi:10.1006/mare.1999.0115
- Rencher, A. C. (2003). Methods of multivariate analysis (Vol. 492). Hoboken, NJ: John Wiley & Sons.
- Rodriguez, R. R., Saiz, J. J. A., & Bas, A. O. (2009). Quantitative relationships between key performance indicators for supporting decision-making processes. Computers in Industry, 60(2), 104–113. doi:10.1016/j.compind.2008.09.002
- Sanchez-Marquez, R., Guillem, J. A., Vicens-Salort, E., & Vivas, J. J. (2018a). A statistical system management method to tackle data uncertainty when using key performance indicators of the balanced scorecard. Journal of Manufacturing Systems, 48, 166–179. doi:10.1016/j.jmsy.2018.07.010
- Sanchez-Marquez, R., Guillem, J. M. A., Vicens-Salort, E., & Vivas, J. J. (2018b). Intellectual capital and balanced scorecard: Impact of learning and development programs using key performance indicators in manufacturing environment. Dirección y Organización, 66, 34–49.
- Verdecho, MJ., Alfaro-Saiz, JJ., & Rodriguez-Rodriguez, R. (2014) A performance management framework for managing sustainable collaborative enterprise networks. In: Camarinha-Matos L.M., Afsarmanesh H. (eds) Collaborative Systems for Smart Networked Environments. PRO-VE 2014. IFIP Advances in Information and Communication Technology,434 Springer, Berlin, Heidelberg DOI: 10.1007/978-3-662-44745-1_54
- Walczak, S., & Cerpa, N. (1999). Heuristic principles for the design of artificial neural network. Information and Software Technology, 41(2), 109–119. doi:10.1016/S0950-5849(98)00116-5
- Zupan, J. (1994). Introduction to artificial neural network (ANN) methods: What they are and how to use them. Acta Chimica Slovenica, 41, 327.