
 ?Mathematical formulae have been encoded as MathML and are displayed in this HTML version using MathJax in order to improve their display. Uncheck the box to turn MathJax off. This feature requires Javascript. Click on a formula to zoom.
Abstract
In the current market economy, alliances play a key role in developing strategies across fields. In order to have a good partner, managers have used both qualitative and quantitative methodologies. This paper proposes a mathematical model to figure out the most suitable strategic partners. With input data from published financial reports, the authors use the data envelopment analysis (DEA) to evaluate the business efficiency of the steel companies in the period of 2011–2019. Then, Grey system theory is applied to predict their performance in the future period. The findings recommend the two leading steel manufactures but having ineffective performance, the Hoa Sen Group, and the Pomina Steel Corporation, as the most feasible beneficial partnership. Managers and the government can take advantages of the model in order to implement and have overall plans of steel enterprise in the future.
PUBLIC INTEREST STATEMENT
This paper proposes a novelty model in selecting alliances among Vietnamese steel manufacturers. The study has a great reference to help that these companies overcome the difficulties due to the Covid-19 virus pandemic. The model uses the input data from financial reports in the period 2011–2019 to evaluate the business efficiency and predict their performance in next three years. Then, the author would select a target firm which is one of the top leading in the sector but having a low efficiency score over the period. Virtual combinations between the target firm and other alliances are supposed to run again the evaluation model. A strategic partner is recommended for the target company if their alliance significantly improves the performance scores of both.
1. Introduction
In any market, steel industry is one of the viral fields contributing in the development of the country and Vietnam is not an exception. According to a report by Grand View research, the global steel market is able to reach USD 1.01 tribillion with 2.6% in CAGR by 2025 (GVR, May, Citation2017). In the next 2022, the amount of crude steel produced from Vietnam is estimated to raise with CAGR over 20% and the Vietnamese steel market is one of the fastest-growing market (Nguyen & Nguyen, Citation2019). Overall, although the economy growth is negatively influenced by many factors such as Covid-19 virus pandemic, the steel production is still potentially growing. In the report of Vietnamese Steel Association, the domestic steel manufacturers cannot meet the demand for steel in various sectors such as construction, automobiles and home appliances with 22.31 million tons in 2019.
One main reason of unsatisfying the market demand is that Vietnamese steel enterprises have less competitive advantages and face many challenges in term of size, production capacity and technology. Moreover, it becomes more difficult if firms operate individually. In order to overcome such issues and improve competitive advantages, especially small and medium manufactures consider building partnership or cooperation as a key efficiency strategy (Wang, Nguyen, & Wang, Citation2016; Nguyen & Tran, Citation2018).
However, companies encountered many challenges to choose a good partner when the information is limited and incomplete (Kawabata, Citation2016). Especially, with unavoidable errors in collecting information, mathematical models are suitable to apply. Data Envelopment Analysis (DEA) is a linear function converting multiple inputs into outputs to measure the efficiency of decision-making units (Charnes et al., Citation1978). In addition, Grey System theory is a modern prediction method introduced by Deng (Citation1982), and it uses uncertain information with available data to estimate future behaviours. In this study, these two techniques are combined into the research model. With critical input and output variables from published financial reports, the DEA model evaluates the performance of steel companies during the period of 2011–2019 and the grey model predicts the future business operation in the period of 2020–2021. From the output of algorithms, the paper suggests potential steel firms to build good strategic alliances.
The paper studies on 17 Vietnamese steel companies with relevant data that fulfil the requirements of DEA and Grey system theory. The sample size of 17 DMUs is sufficient to reflect the characteristics of steel firms in Vietnam. Hoa Sen Group is one of the leading steel manufactures in Vietnam and South Asia (Nguyen & Nguyen, Citation2019). However, the group experienced a significant decline in its market share and net profit during the period of 2018–2019. In addition, the outputs of DEA show that the Hoa Sen Group has the efficiency scores are less than 1 during the period of 2011–2019. Although it is a leader in the field, the group has not performed well. The Hoa Sen Group, hence, is selected as a target firm in this research and the purpose of study is to recommend potential strategic alliances by using optimization algorithms with many thoughtful considerations.
Most of the research on strategy literature focuses on approaches such as “competitor analysis” and the “resource-based view” of the firm; the “cognitive aspects” approach for strategic alliance (Capaldo & Messeni Petruzzelli, Citation2015; Das & Teng, Citation2002). There is a lack of studies applying mathematical optimization models in selecting alliances. This study has more developments and new contributions to fulfil such a research gap.
2. Literature review
2.1. Strategic alliance
Strategic alliance is an “inter-firm collaboration over a give economic space and time for the attainment of mutually defined goals” (Das & Teng, Citation2003; Glaister & Buckley, Citation1996; Nguyen & Tran, Citation2018). It is an efficient pattern to help companies to approach and conserve the resources needed for innovation and share risks in dynamic development (Allelign, Citation2014; Parkhe, Citation1993). There are a wide range of well-known success alliances across fields, for example, Renault-Nissan; Toshiba -Timer Warner; Merck and AB Astra; etc. (Das & Teng, Citation2003; James et al., Citation2003; Wang, Nguyen, & Wang, Citation2016).
Das and Teng (Citation2000b) reported about 60 percent of alliances failed due to unsatisfactory cooperating or conditions of their partner. One of the main reasons is that firms made failures in the “partner selection” stage. The purpose of this study is to propose a model combining the Grey system and DEA for identifying proper candidates for alliances.
2.2. Grey system and DEA models
In 1978, Charnes et al. introduced Data Envelopment Analysis (DEA) as a “data-oriented” approach to measure the efficiency of production and business activities of multiple “decision-making unit” (DMUs). This is a linear mathematical model based on the history business data to construct production boundary lines (T.-M. Le et al., Citation2020). The firms can calculate and evaluate the optimum combinations of inputs and outputs in order to bring the optimal performance.
In 1982, Deng introduced the Grey System Theory to reduce randomness and promote the regular pattern of disorderly and unsystematic data. Despite of basing on small amount of random data, the advantage of the Grey System model is able to forecast with high level of accuracy (T.-M. Le et al., Citation2020).
Recently, there are many studies on the application of DEA in various fields. In 2001, Martín and Roman applied DEA models to assess the technical and operation efficiency in Spanish airport. In 2006, Liang et al. (Citation2006) applied DEA to assess the efficiency in supply chain sectors. In 2015, Wang, Nguyen, Tran et al. (Citation2015) combined Grey model and DEA to evaluate the hi-tech industry in Taiwan. In 2020, Tien et al. apply the optimization algorithms to evaluate the business performance of Vietnamese logistics companies.
3. Research methodology
3.1. Grey forecasting model
Grey model becomes a suitable technique to forecast with limited amount of historical business data. The authors implement the most frequently used DEA model, GM (1,1), to get estimating results because of its computational efficiency (Nguyen & Tran, Citation2018).
The GM(1,1) model constructs a group of various differential equations based on the generated sequence. The model has five main steps described as following:
Step 1: Input original time series data X(0) (Deng, Citation1982)
where : a non-negative sequence; n: the number of data observed
Step 2: Generate time series data X(1)(k) by 1-Accumulating Generation Operator AGO (1-AGO) of X(0) And Generate partial series data Z(1)(k) from X(1)(k)
where
Step 3: Establishing the data matrix by least square method to acquire the value of coefficient a & grey input b
Where
Step 4: Construct GM(1,1) forecasting equation
where: parameters a and b are called the developing coefficient and grey input, respectively. However, these parameters a and b are undetermined from EquationEquation (6)(6)
(6) . Instead, the least square method below can be used:
Where denotes the prediction X at time point k + 1 and the coefficients [a,b]T can be obtained by the Ordinary Least Squares (OLS) method:
And
(B is data matrix, YN is data series, [a,b]T is parameter series)
is acquired from EquationEquation (7)
(7)
(7) . Let
be the GM(1,1) fitted and predicted series:
where
Step 5: Evaluate average residual γ, and calculate forecast values:
3.2. DEA model
One of the important requirements of DEA models is the non-negative data input. In this study, the authors used the Slacks-based measure of efficiency (SBM) developed by Tone in 2001 and run by the program DEA-Solver pro 4.1 Manuel, it supposes that yr0 ≤ 0 and defines and
by
If the output r does not have positive values, then it is defined as .
The value is never changed in the constraints. The term is
will be replaced by
With B = 100.
The estimated score is units’ invariant that is independent to the measuring units (Düzakın & Düzakın, Citation2007)
3.3. Development of research
This study combined GM(1,1) and DEA models as a set of systematic assessment model. The research development is presented in Figure as below.
Figure 1. Research development.
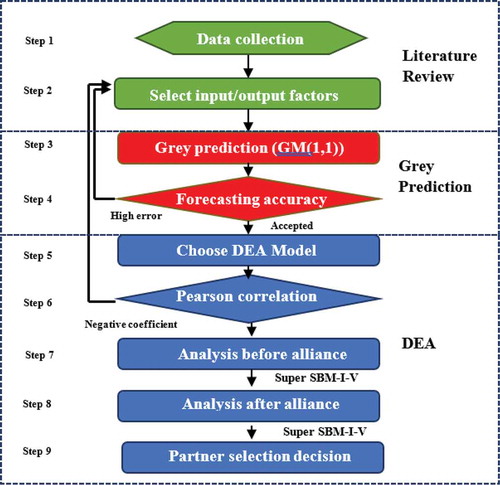
Step1: Data collection
The authors chose 17 appropriate candidates in the Vietnamese steel industry as our DMUs.
Step 2: Inputs/Outputs selection
The authors used three Input factors: (I1) Fixed assets; (I2) Cost of goods sold Capital; (I3) Operating Costs; and two Output factors: (O1) Net sales; (O2) Net profits
Step 3: Grey prediction model
The study applied the GM(1,1) model in Grey system theory to predict the business situation of steel firms during the period of 2020–2021.
Step 4: Forecasting accuracy
Then, the authors implemented the Mean Absolute Percent Error (MAPE) to quantify the forecasting accuracy. If the value of MAPE is too high (more than 20%), the data of inputs and outputs must be recollected.
Step 5: Choosing the DEA model
The Super -SBM-I-V of DEA evaluates efficiency points and rankings of each steel companies.
Step 6: Pearson correlation
The authors used the Pearson correlation coefficient to test the positive correlation between inputs and outputs
Step 7: Analysis before alliance
In this step, the target firm is identified on the predicted value of 2020. Next, the super-SBM is applied in the realistic data of 2019 to rank the efficiency of each DMU
To evaluate efficiency of DMU(x0, y0), the SBM models are established as per (Tone, Citation2001).
Step 8: Analysis after alliance
The authors used the super-SBM model with sum of the forecasted values to analyse all the alliancing between the target DMU and the other DMUs. Then, we compare and analyse the difference in efficiency ranking between “before” and “after” alliance.
Step 9: Summary
Standing on the performance of firms before and after virtual pairing, the study would analysis and suggest possible strategic alliances.
4. Emperical analysis and results
4.1. Collecting the DMUs
There are 17 Vietnamese steel enterprises selected companies as our DMUs in the proposed model. These DMUs must have relevant data and meet the requirements for applying DEA and Grey system. The business historical data of firms are collected from financial reports during 2011–2019, published on different reliable databases of the State Securities Commission of Vietnam (ssc.gov.vn). In addition, the authors double-checked the data with the information reported by Vietnamese Steel Association.
These enterprises with top market shares can represent to the whole Vietnam Steel market. The detailed list as follows in Table .
Table 1. Sample of research
4.2. Input/output variables selection
The authors reviewed the literatures of DEA and refer to steel industry reports in order to decide input and output variables. In term of inputs, three important factors to the sources of steel manufactures are fixed assets, operating cost, and cost of good sold (COGS). In term of outputs, Net sales and Net profits are considered as two output factors because the indicators are good signals to analysis the company’s financial effectiveness.
The example of detailed data are shown in the Table below.
Table 2. Input and output factors of 17 steel companies in 2017
4.3. Variables calculations—Forecast inputs/outputs by GM(1,1)
The authors run GM(1,1) model on the realistic inputs/outputs factors from 2011 to 2019 in order to predict the values of all DMUs in 2020 and 2021. The results are shown in Tables and
Table 3. Forecasted inputs/outputs data for the year of 2020
Table 4. Forecasted inputs/outputs data for the year of 2021
4.4. Accurate checking
The imperfect information are constraints in the prediction. To check accuracy of applying GM(1,1), the authors estimate the MAPE score in percentage and shown as follows (Table )
Table 5. Average MAPE of DMUs (in %)
The prediction is good and qualified if the value of MAPE is less than 10%. In the Table , the average MAPE of 8.93% confirms the results of GM(1,1) are accurate to use in the study.
4.5. DEA model choosing
Nguyen and Tran (Citation2018) considered the necessities of one unit over the others to overcome the issues of negative information. Hence, the authors choose Super-SBM as a DEA model to deal the problem of negative values.
4.6. Pearson correlation
The “homogeneity” and “isotonicity” data of inputs and outputs are two requirements for applying the DEA model. The authors employed the Pearson Correlation to test these two criteria.
In the period 2011–2019, inputs and outputs factors have strong positive correlation, for example, the results of 2011 and 2019 present in the Tables as below
Table 6. Correlation of input and output data in 2011
Table 7. Correlation of input and output data in 2019
4.7. Analysis before alliance
The super-SBM-I-V algorithm based the business performance of all DUMs in 2019 to evaluate the efficiency of 17 firms before alliance.
The Table is an example of performance ranking in 2019, the authors considered all the performance ranking in the period of 2011–2019 to select the target DMU. Then, DMU2 becomes out target firm for alliance due to two reasons. First, the firm is a top leading steel manufacture with a high market share of 31.6% in galvanized steel and 18.1% in steel pipes (VSA report, Citation2018). Second, DMU2 experienced “less 1” in the efficiency scores during from 2011 to 2019. Hence, there are some issues in business strategic of the DMU2 that should consider building alliance strategic to improve their performance in the future.
Table 8. Performance ranking of DMUs 2019
4.8. Analysis after alliance
In this stage, the authors formed 33 virtual DMUs including 17 initial steel firms and 16 supposed alliances. Then, Super-SBM-I-V is repeatedly implemented to estimate and rank the efficiency of these DMUs in 2020 and 2021.
4.9. Alliance selection
There is no doubt about the advantages of alliances, such as increasing performance; improving productivity; enhancing a firm’s market power (Anand & Khanna, Citation2000). The increasing the performance efficiency score becomes one of the main motivations to form collaborations. The study based on the estimation results of performance ranking to indicates potential alliances for the target firm (DMU2). Hence, the authors consider the firms which are able to increase the performance ranking of the DMU2 to make decisions.
Tables and 1 showed that there are 15 potential good alliances improved the DMU2’s efficiency ranking after cooperating. However, the authors separated two groups of these alliances.
Table 9. Performance ranking of virtual alliance 2020
Table 10. Performance ranking of virtual alliance 2021
The group 1 includes the strategic alliances improved the scores of both firms. Having common goals increases the opportunity of forming alliances because the involved companies find their benefits from these strategic collaborations. Group 1, therefore, is the first priority.
There are seven alliances in group 1. Table showed how their position in ranking changed after alliances. The cooperation between DMU2 (i.e the Hoa Sen Group) and DMU4 (i.e. Pomina Steel Corporation) is the highest recommendation, because this alliance improved the position of the DMU2 and DMU4 from the 25th and 23th in, respectively, to the 13th in the ranking score.
Table 11. The first prioritized in alliance strategy
Meanwhile, in Table , group 2 includes the other alliances improved the target firm’s performance but its partners get worst. This group is the second priority recommendation since the chance of forming alliance is less. These firms’ efficiency ranking is influenced after cooperation, meanwhile the target firm’s position gets higher.
Table 12. The second prioritized in alliance strategy
The study eliminated all alliances that reduced the scores of both the target enterprise and its partner.
5. Discussion
The foundation of a strategic alliance is an agreement between two organizations toward a correlating business goals such as developing a more effective process; sharing the resources and risks; etc. (Kogut, Citation1988). Obviously, the firms in the group 1 have a clear motivation to form a strategic alliance. However, the question about how to form such a strategic alliance attracts many studies recently. The different enterprises with different mission and vision would have different kinds of alliance. It could be the simple agreements without exchanging equity; or a formal contract involving equity ownership and shared managerial control over joint activities (Nguyen & Nguyen, Citation2019; Wang, Nguyen, & Wang, Citation2016). For examples, the “group 1” firms could consider various forms such as supplier–buyer partnerships; joint research projects, collaborative technical, shared resources of distribution channels; cross-selling, etc. (Das & Teng, Citation2003; Nguyen & Nguyen, Citation2019; Wang, Nguyen, & Wang, Citation2016).
Although the authors mentioned the low opportunity of forming alliances between the target firm and the companies in the group 2, it is possible to make collaborations. Nguyen and Tran (Citation2018) stated that alliances can be constructed without the same perspective or common objective between partners. For example, Chen and Chen (Citation2002) introduced a definition of “asymmetric alliances”, in which small firms accept to invest more and gain less benefits from alliance with larger ones such as leader firms, but they can have more reputable from such an collaboration. This is also incentives for the market leader to join in an alliance. Hence, the “group 2” is the second priority in our recommendation.
6. Conclusion
Recently, strategic alliances attract many concerns from managers to government officials across different fields. In a dramatic competitive market, any industries have experienced many challenges and the Vietnamese steel market is not an exception. To have a successful strategic, however, firms encounter many difficulties to select a good partner. There are many issues such as lack of information; fluctuated inputs data. The study, therefore, proposed a novel model combining various optimization algorithms namely the GM(1,1) and DEA model to help managers make decision.
All inputs and outputs of the real 17 steel firms and 33 virtual alliances are implemented by the super-SBM model. The findings show that the Pomina Steel Corporation (DMU4) is highly recommended to form a strategic alliance with the target firm, the Hoa Sen Group.
However, this is only a reference in term of improving the business performance in the future between two companies. To have such an association, these two steel enterprises must pay much effort to analyse and evaluate each other as well as choosing the most suitable kind of alliance formation.
There are some advantages of the research model in this paper. Firstly, the estimations in the model are more accurate than the previous study due to using the realistic data updated in nine consecutive years from 2011 to 2019. Secondly, many industries or sectors can use the proposed model for future applications as well as the policymakers can refer it to evaluate the performance of different fields.
Additional information
Funding
Notes on contributors
Phu Nguyen
Phu Nguyen is a lecturer at school of business, HCM International University_Vietnam National university. His research is centred on operation management, forecasting models, strategic management, decision-making models. He can be reached at [email protected]
Nhu Ty Nguyen
Nhu Ty Nguyen is a lecturer at school of business, HCM International University_Vietnam National university. His research is centered on Grey forecasting, DEA models, Linguistics, Operations Management. He can be reached at [email protected]
References
- Allelign, A. (2014). The effects of alliance strategy of ethiopian aviation group on its operation: The case of star alliance. [Doctoral dissertation]. St. Mary’s University.
- Anand, B. N., & Khanna, T. (2000). Do firms learn to create value? The case of alliances. Strategic Management Journal, 21(3), 295–15. https://doi.org/10.1002/(SICI)1097-0266(200003)21:3<295::AID-SMJ91>3.0.CO;2-O
- Capaldo, A. M., & Messeni Petruzzelli, A. (2015). Origins of knowledge an innovation in R&D alliances: A contingency approach. Technology Analysis & Strategic Management, 27(4), 461–483. https://doi.org/10.1080/09537325.2015.1011612
- Charnes, A., Cooper, W., & Rhodes, E. (1978). Measuring the efficiency of decision making units. European Journal of Operational Research, 2(6), 429–444. https://doi.org/10.1016/0377-2217(78)90138-8
- Chen, H., & Chen, T.-J. (2002). Asymmetric strategic alliances: A network view. Journal of Business Research, 55(12), 1007–1013. https://doi.org/10.1016/S0148-2963(02)00284-9
- Das, T. K., & Teng, B. (2000b). Instabilities of strategic alliances: An internal tensions perspective. Organization Science, 11(1), 77–101. https://doi.org/10.1287/orsc.11.1.77.12570
- Das, T. K., & Teng, B. S. (2002). The dynamics of alliance conditions in the alliance development process. Journal of Management Studies, 39(5), 725–746. https://doi.org/10.1111/1467-6486.00006
- Das, T. K., & Teng, B. S. (2003). Partner analysis and alliance performance. Scandinavian Journal of Management, 19(3), 279–308. https://doi.org/10.1016/S0956-5221(03)00003-4
- Deng, J. -L. (1982). Control problems of Grey systems. Systems & Control Letters, 1(5), 288–294. https://doi.org/10.1016/S0167-6911(82)80025-X
- Düzakın, E., & Düzakın, H. (2007). Measuring the performance of manufacturing firms with super slacks based model of data envelopment analysis: An application of 500 major industrial enterprises in Turkey. European Journal of Operational Research, 182(3), 1412–1432. https://doi.org/10.1016/j.ejor.2006.09.036
- Glaister, K., & Buckley, P. (1996). Strategic motives for international alliance formation. Journal of Management Studies, 33(3), 301–332. https://doi.org/10.1111/j.1467-6486.1996.tb00804.x
- Grand View Research, I. (2017, May). Steel market analysis by product (Hot, cold, direct rolled, tubes), by application (Pre-engineered metal buildings, bridges, industrial structures), by PMB, by region, and segment forecasts, 2018-2025. Marketpushiers.
- James, D., Benjamin, G., & Michael, S. (2003). Mastering alliance strategy. John Wiley & Sons, Inc.
- Kawabata, N. (2016). The Vietnamese iron and steel industry in transition to a market economy_ attainments and challenges.
- Kogut, B. (1988). Joint ventures: Theoretical and empirical perspectives. Strategic Management Journal, 9(4), 319–332. https://doi.org/10.1002/smj.4250090403
- Le, T.-M., Wang, C.-N., & Nguyen, H.-K. (2020). Using the optimization algorithm to evaluate and predict the business performance of logistics companies–a case study in Vietnam. Applied Economics, 52(38), 4196–4212. https://doi.org/10.1080/00036846.2020.1733474
- Liang, L., Yang, F., Cook, W. D., & Zhu., J. (2006). DEA models for supply chain efficiency evaluation. Annals of Operations Research, 145(1), 35–49. https://doi.org/10.1007/s10479-006-0026-7
- Nguyen, N.-T., & Tran, -T.-T. (2018). A two-stage study of grey system theory and DEA in strategic alliance: An application in Vietnamese fertilizing industry. International Journal of Advanced and Applied Sciences, 5(9), 73–81. https://doi.org/10.21833/ijaas.2018.09.011
- Nguyen, P., & Nguyen, T. (2019). A two-stage study of Grey system theory and dea in strategic alliance: an application in Vietnamese steel industry. International Journal of Data Envelopment Analysis, 7(2), 45-64.
- Parkhe, A. (1993). Partner nationality and the structure-performance relationship in strategic alliances. Organization Science, 4(2), 301–324. https://doi.org/10.1287/orsc.4.2.301
- Tone, K. (2001). A slacks-based measure of efficiency in data envelopment analysis. European Journal of Operational Research, 130(3), 498–509. https://doi.org/10.1016/S0377-2217(99)00407-5
- VSA. (2018). The Vietnam Steel Industry Review. Vietnamese Steel Association.
- Wang, C. N., Nguyen, N. T., Tran, T. T., & Huong, B. B. (2015). A study of the strategic alliance for EMS industry: The application of a hybrid DEA and GM (1, 1) approach. The Scientific World Journal, 2015, 1–14. https://doi.org/10.1155/2015/948793
- Wang, C.-N., Nguyen, X.-T., & Wang, Y.-H. (2016). Automobile industry strategic alliance partner selection: The application of a hybrid DEA and Grey theory model. Sustainability, 8(2), 173. https://doi.org/10.3390/su8020173