
 ?Mathematical formulae have been encoded as MathML and are displayed in this HTML version using MathJax in order to improve their display. Uncheck the box to turn MathJax off. This feature requires Javascript. Click on a formula to zoom.
Abstract
While innovation affects company efficiency, research into service innovation is scarce and lacks consensus. In retailing, in latest years, innovation has aroused significant interest in corporate and academic world. This research analyses retail experience innovation from the perspective of marketing innovation and technological innovation perspectives to comprehend its effect on satisfaction. The main goal of this research is to explore the relationship between technological and marketing innovation, word-of-mouth and satisfaction through three key constructs: brand store equity, customer value and store image. A total of 315 retail clients from grocery, apparel, furnishings and electronics shops were covered for the study on which multiple regression was used. The study found that technological innovation was important for shaping image, value and satisfaction compared to marketing innovation. Simultaneously, shop image had the biggest effect on customer satisfaction and satisfaction is a very essential ingredient for word-of-mouth behaviour (WOM-Referral and activity).
PUBLIC INTEREST STATEMENT
Research shows that both technical advancement and marketing innovation make it possible to enhance the reputation of the customer. The implementation of innovations also increases market demand and customer loyalty with the shop. Marketing creativity has a major indirect influence on satisfaction by the logo of the shop. (Musso, Citation2010).
The improvement in market satisfaction increases the customer’s view of the brand and the happier the customer is with the perception of the store. The research shows that further recommendations are made to consumers who are more pleased with retail experience.
”Shoppers may have distorted their understanding of marketing innovation with respect to advertisement, fraud or unethical practises. This paper adds to the literature on satisfaction and loyalty in retail through the study of the role of creativity. Marketing and technical advancement increase the degree of satisfaction, both directly and indirectly, through the reputation of the shop.
1. Introduction
One of the cornerstones of the sales industry is considered to be the Customer. It has become increasingly broader and international in context. Retailers are in a developed and competitive environment in which consumer preferences are constantly increasing and changing (Grewal et al., Citation2009). The retail theory originally had focussed on improved grocery purchases and convenience stores as well as shopping centers. Innovation addresses the development of various aspects such as technology, services, products, and ideas of selling, processes, and working methods to improve the company’s financial performance (Townsend, Citation2010). Recent fields of studies investigate the marketing operations and strategies (Gil et al., Citation2014), but little empirical evidence is available relating this creativity to the variables of satisfaction and loyalty (Nemati et al., Citation2010). However, rapid changes in information and communications technology (ICT) has improved business conditions dramatically by providing customers with innovations and better experience (Thiesse et al., Citation2009). The incentives such as price reduction, increased customer loyalty, increased job performance, to name a few are seen through the use of ICT in industries (e.g. Gil et al., Citation2014). Nonetheless, the new area of focus is innovative retail technologies (Renko & Druzijanic, Citation2014).
This study examines recent customer progress in the retail sector by analyzing technological and marketing developments. The study also explores the internal and external impact of innovation on customer satisfaction. Word of mouth (WOM) is the most important aspect of customer satisfaction and has a major impact on loyalty of customers. For this research, three variables were selected: word of mouth, store brand equity (SBE), and customer value (CV), which are strongly linked with loyalty and satisfaction. These have always been particularly important in competitive industries and demonstrate no distinction between tangible or intangible products and services (Cortinas et al., Citation2010). The role of the store image is very critical to strategize for the acquisition of competitive advantage (Delgado et al., Citation2014). In recent years, the customer value has evolved as an important metric for retail experience (Yoon et al., Citation2014). Whilst brand equity is changing in retail sector, it requires further and in-depth research exploring its different avenues (Gil et al., Citation2016; White et al., Citation2013). Therefore, such considerations are known as a stronger and broader framework than traditional models of linear loyalty. In order to enhance the comfort of consumers buying life insurance products and improve the anticipated efficacy of such products, managers should reinforce and apply their service innovation strategies to increase the purpose of consumers. Service innovation customers administered by insurance company operators would help to increase the WOM impact in terms of service definition, customer experience, service delivery system and technology choices. The direct impact of CR on WOM (J. I. Chang & Lee, Citation2020) means that respectable banks get optimistic WOM. That is, the client continues to speak favourably to their friends and relatives about their respectable banks regularly. (Manohar et al., Citation2019)
1.1. Purpose of the study
While innovation has an effect on business results, research into innovation in services is minimal and lacks consensus. Innovation has aroused tremendous scholarly and industry concern in retailing in recent years. This study analyses progress in retail engagement that is a result of innovation strategies of retailer. The objective is further to study the developments from the point of view of marketing innovation and technical innovation to appreciate its effect on loyalty and satisfaction. Our goal is therefore to research the contribution of marketing and technical advancement to satisfaction and WOM through image, customer value and brand equity in retail experience. This research would help us to discern variations in the results of each form of innovation and to better understand the relationship between innovation and consumer satisfaction. Results will help company managers build plans and disperse resources to boost customer loyalty standards and their resulting feedback.
2. Literature review and hypothesis development
Innovation is key to making shopping more pleasant; it enables environments which have a strong impact on consumer inspiration. Innovation has never evolved as quickly as it is now. Customer companies, especially large customer shops (malls and supermarkets), are expected to offer unique customer experience that can contribute to customer loyalty and commitment. Fairness and customer satisfaction are therefore important for every company’s survival, growth, and progress (Davis, Citation2013). For loyal customers, it could be more important to implement technological advancements while making decisions on shopping compared with price. This is because they are generally less responsive to price fluctuations and play a significant role in informal advertising (Martos-Partal, González-Benito, Citation2013). To distributors, consumer satisfaction is the primary focus. It is essentially understood to be the main purpose of retail managers and is also an important notion of interest for marketing researchers (Cooil et al., Citation2007). Loyalty in current literature is defined as a specific/collective technique (Boulding et al., Citation1993) and a cognitive/effective approach (Oliver, Citation2010). A strategy shared by many researchers is an analysis of concrete experience fulfillment (Giese & Cote, Citation2000). However, retail satisfaction refers to a collection of accumulated experiences. Cognitive awareness is a nice level of consumer satisfaction (Oliver, Citation2010). Store satisfaction can be a special evaluation in the sense that the store fulfills or exceeds customer expectations (Helgesen et al., Citation2010). Successful views indicate that satisfaction is a summary of the varying intensity of emotions (Giese & Cote, Citation2000). Some of the studies which can be referred on similar issues. (Khaled et al., Citation2018, p. 2019) A key contribution of current research is that the assessment of the e- constructs of e- in India suggests a smaller, more sophisticated scale. The various dimensions of quality e-service and relationships with customers after purchase have been recognized by customers. This document also leads to linking e-commerce, e-satisfaction with other e-service buildings of quality such as comfort, protection and reactivity. It helps advertisers build a roadmap for enhancing consumer engagement and advocacy services provided by e-tailers. The era of information technology has changed, with the sensitivity that was very critical determinants of customer satisfaction. (Khaled et al., Citation2020)
2.1. Technological and Marketing Innovation (TI-MI)
Innovation studies concentrate on the marketing and technological innovation in two significant aspects (Musso, Citation2010). Service innovation, along with services from distributors, is a continuing issue and very hard to identify and assess (Tether, Citation2005). Technological change is generally connected with innovation. In recent years, technological innovation has become consolidated through the implementation and growth of ICTs in terms of policy investments that run in the long term which has the potential to bring benefits competitively by adding a surplus of value to the end customer (Thiesse et al., Citation2009). Despite this, there are ample possibilities for companies to improve in retailing because the distribution in the retail businesses is at a premature stage of growth and access to sophisticated ICTs. There are various technologies such as radio frequency (RFID), self-payment/product self-scanning, and thousands of other applications in mobile phones that are the real thrust of revolution in technology that is becoming a prime requirement to enhance the retailing experience competitively. (Gil et al., Citation2014 and A. Kumar et al., Citation2014). The literature explores various approaches to explain the role of innovation in customer satisfaction, as outlined in . The effect of technology could be seen from both consumer and corporate performance indicators (e.g. market share, efficiency, revenue) perspectives. Technology undeniably plays an important role in improving the fruitful experience that improves customer satisfaction.
Table 1. Review of literature on innovation role
As mentioned earlier, the growth of ICTs offers benefits not only for customers in the form of value (Thiesse et al., Citation2009), but also by enhancing competitiveness through companies (Gil et al., Citation2014). This enhanced competitiveness could be also transmitted to clients through improved brand image of consumers (Yeh, Citation2015) and lower product prices. Regarding all such contributions, one believes that the innovation experienced by clients can have a beneficial impact on picture and perceived value with the techniques implemented in the shop. Some studies indicate that these impacts result from the implementation of ICTs resulting in enhanced client satisfaction (Gil et al., Citation2014; Ochoa & Pimiento, Citation2014). Renko and Druzijanic (Citation2014) noted that, technological innovation (TI) allows retail businesses to better comprehend client requirements and create strategies to enhance their satisfaction. This finding also indicates a beneficial effect on satisfaction from perceived technological innovation. Hence, the first of hypotheses framed were:
H1a:Technological innovation (TI) has a significant and positive influence on store image (SI).
H1b:Technological innovation (TI) has a significant and positive influence on consumer value (CV).
H1c:Technological innovation (TI) has a significant and positive influence on satisfaction (S).
The contribution of marketing innovation (MI) to image storage and other related constructs, such as satisfaction and value, is one area of innovation that keeps calling for further research. Research on the relationship between image and innovation, such as (Weerawardena et al., Citation2006), emphasizing the significance of innovation in enhancing the picture of the company is an area of ongoing investigation. Various writers agree that there is a positive relationship between value and innovation and that the primary goal of Technology is designed to generate profit to clients otherwise technology wouldn’t be cost-effective. (Beckeman & Olsson, Citation2011; Jensen et al., Citation2013). Empirical proof as cited in (Ganesan et al., Citation2009 and Sekhon et al., Citation2015) indicate that service innovation or change in even some elements of the shop has a favourable value effect as it helps enhance the supply and lower prices. Moreover, from a marketing view, the core of innovation is to offer clients something distinct that meets their requirements (Simon & Honore, Citation2012). Marketing innovation could help to develop marketing tools and techniques to better target buyers (Christofi et al., Citation2015, p. 360) and should therefore be focused on enticing adequate clients (Nemati et al., Citation2010). Gil et al. (Citation2014)found an important direct connection in the shop between fulfillment and innovation, it shows that the views of customers about innovation in the marketing procedures of the store will have a beneficial impact on judgments of picture, value and satisfaction. The second sets of hypotheses framed were:
H2a:Marketing innovation (MI) has a significant and positive influence on store image (SI).
H2b:Marketing innovation (MI) has a significant and positive influence on consumer value (CV).
H2c:Marketing innovation (MI) has a significant and positive influence on Satisfaction (S).
2.2. Store image
Managing Store Image is the main strategic instrument used to achieve competitive benefit (Delgado et al., Citation2014 and Bolton et al., Citation2000) and therefore, it is currently receiving great attention in academic as well as corporate world (A. Kumar et al., Citation2014). The concept of store image is basically the customer’s perspective about the retailer (Morschett et al., Citation2005 and Rust & Oliver, Citation2000). In terms of physical features, it has a distinct combination of marketing and its own set of psychological characteristics. (C.H. Chang & Tu, Citation2005). There have been various studies on this concept recently which has resulted in the integration of pictures perception, beliefs and information on specific categories of stores (Hartman & Spiro, Citation2005 and Szymanski & Henard, Citation2001). In this perspective, the image of the store is described as “consumer’s perceptions of the activities that is primarily concerned with the marketing of the store” (JJinfeng & Zhilong, Citation2009, p. 488). Therefore, image presents the perception and identity of store in customers mind by previous tangible and intangible experience of stores component (Ailawadi & Keller, Citation2004; Hartman & Spiro, Citation2005). Now, the researchers have agreed that image can be framed subjectively, can be context-dependent and can be totally a customer-centred concept (Burt et al., Citation2007). As a result, a range of factors or characteristics have been acknowledged that contribute to image formation and, in specific, too, the atmosphere, quality, display of products, assortment, comfort, prices and services (Shen, 2010a).
Concerning the potential impact on the satisfaction of shop pictures, previous studies acknowledge that this picture plays a significant role in these judgments (e.g. Thomas, Citation2013; Yoon et al., Citation2014). Currently, Thomas (Citation2013) proves that the connexion between loyalty and image is mediated by satisfaction. Furthermore, customers decide to choose and evaluate a shop by relying on perception or picture of it from their past experience for a reason (Blackwell et al., Citation2006), store image decreases the perceived danger associated with the purchase (Ailawadi & Keller, Citation2004; Delgado et al., Citation2014). This finding implies that store image can make a substantial contribution to the shopping experiences of customers. Therefore, the belief is that the store’s image among customers will have a beneficial and direct effect on satisfaction.
H3:Store image (SI) has a statistically significant influence on satisfaction (S).
2.3. Consumer value
There has been much valuable research that has focussed on the product but less emphasis has been on the scope of the retails that includes a concentration on a range of viewpoints like the value of experiences directly linked with the store that a customer gets while shopping (Terblanche & Boshoff, Citation2004; Parasuraman & Grewal, Citation2000 and Sweeney et al., Citation1999), the value regarding the process of shopping (Mathwick et al., Citation2002) and those experience which are gathered while shopping that is general in nature (Babin et al., Citation1994; Parasuraman & Grewal, Citation2000; Woodruff, Citation1997). Previous studies have discussed the importance of utilitarian vs. hedonistic and connected it in the light of economic as well as non-economic approaches of the significance of the study (Sweeney & Soutar, Citation2001; Babin et al., Citation1994). The utilitarian value of shopping contains factors like an assortment of merchandise, location, promotion of sales and price (Sullivan et al., Citation2012), and is positively linked to customer’s WOM and satisfaction (Laroche et al., Citation2005). A usual practice in service literature works is to choose certain dimensions for value study (Leroi-Werelds et al., Citation2014; Mathwick et al., Citation2002). Besides, the primary element of consumer perceived value has traditionally been financial value (Gallarza et al., Citation2016; Sullivan et al., Citation2012).
Another relationship to assess is the impact of customer value on store brand equity. Different studies consider quality as one of its facets (Arnett et al., Citation2003; Gil et al., Citation2013). However, several studies confirmed the effect on store equity of value or distinct value dimensions, such as cost or perceived quality (Bigne et al., Citation2013; Gil et al., Citation2013; JJinfeng & Zhilong, Citation2009), because the value is a cost-benefit analysis (Zeithaml, Citation1988), it can be the main measure of a brand’s evaluation (Teas & Agarwal, Citation2000; Woodruff, Citation1997) that generates preferential and positive attitudes, thus influencing brand equity. This theory is supported by some empirical studies (Hellier et al., Citation2003; Johnson et al., Citation2006). Following this strategy and taking into consideration the above proof, it is assumed that if customers perceive a shop as value-added by investing in advertising behaviour (e.g. price reductions); they will demonstrate higher preference and thus enhance their view of brand equity. The following hypothesis was suggested:
H4:Consumer value (CV) has a positive influence on store brand equity (SBE).
2.4. Store brand equity
In retail distribution’s literature, brand equity is an evolving idea (Beristain & Zorrilla, Citation2011; Pappu & Quester, Citation2006; White et al., Citation2013). A broad range of phrases like “equity based on the customer” (Hartman & Spiro, Citation2005), “equity based on the retailer” (Pappu & Quester, Citation2006 and Arnett et al., Citation2003) or “store value”‘ are often used interchangeably (Bigne et al., Citation2013). The overall equity of the brand relates to additional value acquired from the presence of the brand (Yoo et al., Citation2000), based on traditional brand ideas concentrating on the product (Rust & Oliver, Citation2000). Store brand equity is observed when customers create powerful connections with a brand that is familiar to them (Keller, Citation1993). Aaker and Equity (Citation1991, p. 15), this contributes immensely particularly in the field of brand equity and described as “difference of value that a company and/or its clients are offered by a product or service from the summation of all assets and liabilities that are related to the brand including its name and symbol”.
Besides picture impact, store brand equity also has a significant role in attaining customer satisfaction. Brand equity satisfaction from various perspectives has been defined in the literature (e.g. Aaker & Equity, Citation1991; Huang et al., Citation2014; Schreuer, Citation2000). Satisfaction is an antecedent, according to some research studies, because findings indicate brand equity increases with satisfaction rates (e.g. Pappu & Quester, Citation2006; Rambocas et al., Citation2014; Yoo et al., Citation2000). However, empirical evidence is scanty for the reverse impact. Qualitative studies (Glynn et al., Citation2012; Huang et al., Citation2014; Yoo et al., Citation2000), have shown that brand equity can play a major role in satisfying customers (Huang et al., Citation2014; Yoo et al., Citation2000). Research confirms that the level of satisfaction is the same as brand equity rises. Hence, this study considers brand equity to be an antecedent of satisfaction along with shop picture.
H5:Brand Store equity (BSE) has a statistically significant influence on satisfaction(S).
2.5. Word of mouth behaviour
Word of Mouth behaviour or suggestions is one of the greatest important symptoms of satisfaction identified in the literature of loyalty (Janda et al., Citation2002). Even though WOM is not a new concept and was originally studied and conceptualized in the 1960s, recent years have also seen a significant increase in research on this topic. The notion of WOM had been defined differently by different authors (Litvin et al., Citation2008; Nooteboom et al., Citation1997). There is a classic definition of WOM given by Westbrook (Citation1987, p. 261) and defined it as all casual communications about the possession, use or features of certain products and services or their vendors to other customers. Important facets of WOM comprise the hypothesis that it is simple, personal and involves true and reliable independent company message than marketing or promotion (Litvin et al., Citation2008 and Zeithaml et al., Citation1996). WOM therefore, excludes standard customer–company interaction (complaints or suggestions) and between businesses and clients (advertising activities) (Mazzarol et al., Citation2007; Zeithaml et al., Citation1996). Individuals are looking for data for the strategies that can reduce the risks in the pre-purchase stage, and customers are using WOM in the post-purchase stage to vengeance, assist or decrease cognitive dissonance (RCD) (Halstead et al., Citation2002; Verhoef et al., Citation2002). WOM is usually defined as having a two-dimensional existence with such an interpretative element (valence or degree of accurate information)
Finally, there are a few conflicting outcomes for the connection between happiness and allegiance in the satisfaction–WOM relationship (Kumar et al., Citation2013; Litvin et al., Citation2008; Seiders et al., Citation2005; Verhoef, Citation2003; Vesel & Zabkar, Citation2009). However, the immediate impact of satisfaction on WOM behavior or intention is confirmed by many latest retail research,) (Binninger, Citation2008; Citation2008; Fuentes et al., Citation2014; Nesset et al., Citation2011; Walsh et al., Citation2008), studies which suggested that satisfaction can have a beneficial impact on WOM’s intentions. On the basis of these findings, one assumes that happiness received from the use of a product or service has a positive effect on word of mouth () and proposes the final hypothesis:
H6:Satisfaction has a significant effect on WOM.
3. Conceptual framework and proposed model
The contribution of satisfaction towards loyalty has been studied. (Agustin & Singh, Citation2005) and the relation have been established with factors such as expectations, quality of service and perceived value (e.g. Payne & Holt, Citation2001), among others. Although the relationship between happiness and allegiance appears evident, several latest studies have identified the need to go deeply in the background and establish the relationship between the two concepts (e.g. Pomirleanu et al., Citation2016). Although, few studies had already disclosed nonlinear and/or asymmetrical effect (e.g. Cooil et al., 2007), another verify that satisfaction impacts are dependent on various moderator and mediator variables (e.g. Eisenbeiss et al., Citation2014; Kumar et al., Citation2013). On a practical level, this complicated connection is particularly crucial as companies need to evaluate the extent to which and where it is appropriate to spend on satisfaction to create loyalty (Kumar et al., Citation2013). Loyalty still poses significant problems that need further inquiry. The advancement of technology has resulted into important modifications in customer requirements and behaviours (Grewal et al., Citation2017). Recent work on retail loyalty in this digital era highlights the constraints of assessing customer satisfaction as final consequence and insists about the need to assess each customer touch point with the distributor, integrating techniques (e.g. mobile wallets) into loyalty programs (Kumar et al., Citation2017). Given these problems, the study on innovation at retailer level is essential in defining which elements contribute to customer satisfaction directly and indirectly and bring loyalty to store.
In relation to innovation, there is a substantial presence in the loyalty system of factors such as shop picture, customer value and brand equity. Store picture relates to the perception of marketing operations (e.g. merchandising, promotion, etc.) (JJinfeng & Zhilong, Citation2009), Value is generally connected with hedonic and utilitarian elements such a price (Sweeney & Soutar, Citation2001) and brand value is the added value connected with consumer-perceived product (Yoo et al., Citation2000). Consequently, these factors are strongly related to various touch-points between the client as well as the store and make important contribution to loyalty and satisfaction. In view of the increasing interest in customer suggestions and remarks (Leppaniemi et al., Citation2017; Jayawardhena et al., Citation2016), particularly online (King et al., Citation2014), the current research approaches allegiance based on word-of-mouth behavior (Leppaniemi et al., Citation2017 and Jayawardhena et al., Citation2016). Service innovation is far less tangible and tends to require continuous evaluation and is harder to describe (Tether, Citation2005).
In particular, the literature on innovation in this context is comparatively new and fragmented in retailing (e.g. Djellal et al., Citation2013; Musso, Citation2010) and provides two study lines: innovation in marketing innovation (MI) and technological innovation (TI). There are still very few researchers to identify and classify retail marketing innovation. Among the most significant contributions are from Homburg et al. (Citation2002), who think it relates to the degree to which fresh concepts about services or merchandising are adopted. Merchandising innovation focuses on integrating new ways of displaying, organizing and distributing services and products in the shop, while service innovation focuses on providing fresh services related to the shopping experience. From this point of view, innovation implies incorporating fresh sales improvement methods and instruments. Thus, the OECD (Citation2005) definition concentrates on defining the marketing innovation (MI) as the application of fresh techniques of marketing. Most contributions to marketing development literature are purely conceptual (Musso, Citation2010; Ganesan et al., Citation2009 and Hristov & Reynolds, Citation2015). Some studies have focussed on qualitative aspects (e.g. Anselmsson & Johansson, Citation2009 and Hristov & Reynolds, 2015) while others focus on quantitative aspects. However, the academic marketing sector has hardly made any contribution (Naidoo, Citation2010).
Figure 1. Conceptual model for the study
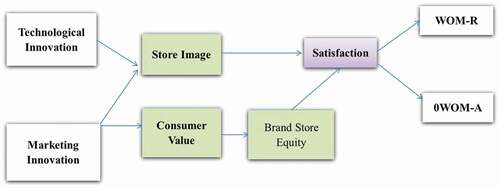
3.1. Model specification
Where in
SI = Store Image
CV = Consumer Value
MI = Marketing Innovation
TI = Technological Innovation
S = Satisfaction
WOM-R = WOM- Referral
WOM-R = WOM- Activity
4. Research methodology
4.1. Measures and development of survey instrument
In recent literature, the study was created with a product of carefully selected measurements, checked and adapted to the retail context. Wu et al. (Citation2006) took technological innovation scale (4 items) and measured customer insight into distributor use and growth of ICTs. The picture scale consists of four items created by Chowdhury et al. (Citation1998), maintaining accessibility characteristics, organization, convenience and equipment. Marketing innovation scale has three items to calculate retail innovation. The idea has found new progress related to services or merchandise sales, incorporating a factor with the number of technologies implemented, the pace of adoption and the consistency of innovation over time. Because marketing innovation is related to the use of fresh marketing techniques (OECD, Citation2005), the idea was focused on commitment (Homburg et al., Citation2002). Assuming new concepts relate to the shop’s creative marketing activities in merchandising such as good assortment, product positioning, in-store, animation, promotions and setting at the point of purchase and facilities such as fresh (services, experiences) (Kotler & Keller, 2012). Regarding the shop brand equity scale (4 items), few writers claim that this structure could be measured against a fictitious shop buying intention or preference for a particular shop (Hartman & Spiro, Citation2005; Yoo et al., Citation2000), using worldwide product-adapted brand equity measures. Worldwide store equity appraisal products are based on this methodology (Shen, Citation2010b), which adapted the measure originally created for commodity equity (Yoo et al., Citation2000) to the shop environment.
This study uses the financial context to measure customer value (4 items) using the economic value metric suggested by Sweeney and Soutar (Citation2001). It’s dimension is related to the utility of rising expected long-term and short-term expenses. Oliver (Citation2010). Finally, based on the new Gelbrich (Citation2011) guideline, which distinguishes WOM referral and procedure (Harrison-Walker, Citation2001; Swan & Oliver, Citation1989), WOM intervention (6 items) was assessed. The work was created with carefully selected collection indicators, reviewed in recent literature, customized to retail context. A five-point Likert scale was used to evaluate all variables. 35 statement-based instruments were used to collect data from respondents on a five-point likert scale covering these seven variables. The table below shows the variables used in this study.
4.2. Sample
Population for the study consisted of the customers of various retail outlets. The sample frame for the study was taken from Delhi, Aligarh and NCR region as it was more financially feasible for the researcher. Since the data were collected from these three cities which are an educational hub so the maximum number of respondent are students. The questionnaires were circulated to respondents at multiple retail outlets in Delhi, Aligarh and NCR. Participants were randomly selected at retail centres. Three hundred and forty-one (341) questionnaires were delivered. The questionnaires were 41 online and 276 (offline), meaning 307 questionnaires were obtained. The study covered interactions of clothes, electronic goods, grocers and furniture. Information was collected using an advanced study-based questionnaire method. The questionnaire administered had an open-ended question encouraging feedback on technology and marketing progress that respondents desired. SPSS version 22.00 for study.
4.3. Scope of study
The scope of study is defined in terms of sector, geography and variables of study. The study is limited retail industry and undertaken in India. The retail centres covered are garments, electronic, goods, furniture and grocery. The scope of the study is limited to Aligarh NCR. It is limited to study four variables they being store equity word of mouth, and store image.
4.4. Respondents profile
The demographics data of the 307 respondents are shown in with interpretations for each item.
Table 2. Study variables
Table 3. Respondents profile
In the study, 185 participants were male, while 122 participants were female. 131 participants were 15–25 years of age, 126 were 25–35 years of age, 43 were 35–45 years of age, 7 were over 45 years of age. The majority of participants were graduates, 126 were post graduates, 85 were high school students, and 45 were PhD students. The majority of participants were pupils, 100 of whom were unemployed, 49 of whom were on duty and 8 of whom were housewives. 38% of participants choose fabric stores, 32% select food stores and 19% choose digital and household stores, respectively.
5. Data analysis and discussion
5.1. Kaiser-Meyer-Olkin (KMO)
To perform data analysis initially Kaiser-Meyer-Olkin (KMO) test was done to check the sampling adequacy of data. The measurement value of KMO = 0.899 was higher than 0.6 (Hair et al., Citation2010) and also the correlation of elements within the variables was created by Bartlett’s sphericity test (BTS), which was of complete significance at P < 0.01 (P = 0.000). So, the sample of 315 participants is sufficient and satisfactory (Hair et al., Citation2010) for further analysis. The results of KMO and Bartlett’s test are presented below in .
Table 4. KMO and Bartlett’s Test
5.2. Reliability analysis
After finding that data is suitable for sample adequacy, reliability of the constructs were measured. Reliability of the constructs was assessed to check the internal consistency; thus, Cronbach’s Alpha was used to check the numerical coefficient of reliability (Cronbach, Citation1951). Reliability value for each construct and whole scale were found to be greater than 0.80. The result of reliability analysis for each factor and the overall reliability of scale is shown below in .
Table 5. Reliability analysis
5.3. Confirmatory Factor Analysis (CFA)
CFA was performed to test the how well the measured variables represents the number of constructs. CFA was used instead of considering fit for individual constructs to determine the model fit of the overall model. Confirmatory analysis was carried out using maximum likelihood method and those factors with more than three (3) items were retained for the analysis. It was possible to set the total fit of the template values: chi-square = 1167.754, freedom level = 634, CHIMIN/DF = 1.842, GFI = 1.833, AGFI = .788, CFI = .891, RMSEA = .069 All results were found to be good for the model fit values (Hair et al., Citation2010). A validity and reliabilities of all constructs were assessed in conjunction with composite reliability (CR). Convergent validity and discriminant validity were calculated to test the validity of the constructions. The validity of convergence has been checked: i) all components must have statistically significant loads of factor (ii), standardized loads should exceed 0.6, while iii) average extracted variance (AVE) should exceed 0.5. The unequal validity of two buildings by AVE was calculated above a square connection between the buildings and the AVE (Fornell & Larcher, Citation1981). shows the composite estimates of reliability and validity.

5.4. Correlation analysis
presents’ correlation matrix and multicollinearity diagnostics. As presented in panel Y there is a positive mid-level of correlation among MI, TI, SI, CV, BSE, S, WOM-R and WOM-A. The variables (MI, TI, SI, CV, BSE, S, WOM-R and WOM-A) have correlation between the range of 0.20–0.70. As shown in panel Y there is a positive correlation among variables MI, TI, SI, CV, BSE, S, WOM-R and WOM-A. Furthermore, as shown in panel X, VIF for all variables MI, TI, SI, CV, BSE, S, WOM-R and WOM-A are less than 3 and the tolerance is less than 0.20 which is considered to be good values and indicates the absence of multicollinearity problem.
Table 6. Correlation matrix
5.5. Hypothesis testing and path analysis using regression
It was found that the impact of marketing innovation on store image exists and that the model (1) is significant (P. value0.002). Further, the adjusted R square is 0.56, which means that the independent variable marketing innovation contribute only 0.56 to the total variation in the dependent variable. Moreover, the model reveals that marketing innovation positively and significantly impacts store image; the coefficient is 0.22 which indicates that when marketing innovation increase by one unit, store image would increase by 0.22 units. Thus hypothesis H1a is accepted. Similarly, the model demonstrates that technological innovation has a positive and significant impact on store image (P. value 0.00). The coefficient values suggest that an increase in technological innovation by one unit results in 0.507 increase in store image. Thus, hypothesis H2a accepted. Concerning the impact of technological innovation on customer value in model 2, shows that the adjusted R square is 0.41, which means the technological innovation contributed only 0.41 to the total variation in the consumer value. Furthermore, the model reveals that technological innovation has a positive and significant impact on consumer value (P. value 0.00). The coefficient is 0.32 which indicate that when technological innovation increases by one unite consumer value will increase by 0.32 units. Thus, the hypothesis H2b is accepted. Moreover, the model demonstrates that marketing innovation positively and significantly impacts on consumer value (P. value 0.00). The coefficient values suggest that an increase in technological innovation by one unit results in 0.32 increasing in consumer value. Thus the hypothesis H1b accepted.
Concerning the impact of store image on satisfaction in model 3, shows that the adjusted R square is 0.41, which means the technological innovation contributed only 0.38 to the total variation in the consumer value. Furthermore, the model reveals that store image has a positive and significant impact on satisfaction (P. value 0.00). The coefficient is 0.61which indicate that when store image increases by one unit satisfaction will increase by 0.61 units. Thus the hypothesis H3 is accepted. Regarding model (4) which examines the impact of consumer value on brand store equity, it is clear from that the model is significant (P. value0.000). Further, the adjusted R square is 0.44, which means that the independent variable consumer value contributes only 0.44 to the total variation in the dependent variable. Moreover, the model reveals that consumer value positively and significantly impacts brand store equity. Furthermore, the hypothesis H4 is accepted.
Table 7. Regression analysis
Regarding model (5) demonstrates that brand store equity has a positive and significant impact on satisfaction (P. value 0.00). The coefficient values suggest that an increase in satisfaction by one unit results in 0.44 increase in satisfaction. Therefore, the hypothesis H5 is accepted.
Regarding model (6) demonstrates that satisfaction has a positive and significant impact on WOM-referral (P. value 0.00). The coefficient values suggest that an increase in satisfaction by one unit results in 0.28 increase in WOM-referral. Furthermore, the hypothesis H6 is accepted. Concerning the impact of satisfaction on WOM-activity in model 7, shows that the adjusted R square is 0.33, which means the satisfaction contributed only 0.33 to the total variation in the WOM-activity. Furthermore, the model reveals that satisfaction has a positive and significant impact on WOM-activity (P. value 0.00). Furthermore, the hypothesis H7 is accepted.
6. Conclusion & implication
The key purpose of the work was the study of retail advancement in marketing and technology and their direct impact on loyalty and eventual recommendations. It is a recent field of research, still scattered and with no scientific data (e.g. Christofi et al., Citation2015; Djellal et al., Citation2013; Musso, Citation2010). In view of this void, this work introduces, after a theoretical analysis of the variables, an observational model evaluated on a group of 341 consumers in various types of stores.
The major conclusion of the study indicates that both marketing innovation and technological innovation have significant impact on store image and consumer value. Further, the study reveals that store image and brand store equity has impact on satisfaction while consumer value has impact on WOM-R & WOM- A and brand store equity.
The study indicates that retailers should invest on innovation in marketing so this would increase the reputation of the store and its image in the eyes of the consumers. Also, the perception and the value the consumer has about the store is enhanced. The study further suggests that technology plays a significant role in increasing innovation in retail set up. However, finance being scarce, retailers should make investment intelligently to enhance experience and engagement of consumers and thus improve their level of satisfaction at the retail store.
This study adds to the literature on satisfaction and loyalty in retail. It is observed that marketing and technical advancement increase the degree of satisfaction, both directly and indirectly, through the reputation of the shop, customer value and brand equity, and that satisfaction encourages referrals to other customers. From a theoretical viewpoint, these findings offer a wider approach by adding new antecedents to the mechanism of loyalty.
7. Limitation and direction for future research
This research has several limitations that offer significant opportunities for future studies. The size is standardized for marketing innovation (MI), so future assessments would use a scale representing the various aspects of this method. A distinction could be established between technical innovation, customer collaborations, and practical or structural innovations. In further study, the picture scale for (Shen, 2010a), which has four aspects: object, service, facilities and atmosphere to better represent the nature of the system could be used. The value scale can also be expanded to represent certain parameters known in the literature in relation to cash value (e.g. Gallarza et al., Citation2016; Holbrook, Citation1999). The impact of technological innovation and marketing on new product offerings or private labels could also be explored. The study to other states in India to generalize the results to the Indian market. Further, the study could be conducted on a pan of India basis to generalize the results.
Additional information
Funding
Notes on contributors

Amgad S. D. Khaled
Dr. Amgad S. D. Khaled has done his Ph.D from the department of business administration, Aligarh Muslim University. He has authored and co-authored numerous articles in different prestigious Scopus journals including Inderscience, Taylor & Francis and some other publishers. [email protected], https://orcid.org/0000-0003-0040-3849, Affiliation : Department of Management Information System Al- Rowad University, Taiz, Yemen
Prof. Dr. Salma Ahmed is PhD and MBA. Her research interests include Supply Chain Management, Knowledge Management and Information System. She has published over seventy papers, and attended and presented papers in more than fifty conferences both at the national and international platform. Affiliation : Professor, Department of Business AdministrationAligarh Muslim University, Aligarh, India
Mohd. Azmi Khan is an Assistant Professor in Institute of Technology & Management, Aligarh, India.
Eissa A. Al-Homaidi is a PhD research scholar at the Department of Commerce, Aligarh Muslim University. He has published several papers in high- level journals indexed in Scopus and SCI publishers. https://orcid.org/0000-0002-6230-8276
Ahmad Moh’d Mansour is an Assistant Professor, Business Department, Faculty of business, Al-Balqa Applied University
References
- Aaker, D. A., & Equity, M. B. (1991). Capitalizing on the value of a brand name. New York, 28(1), 35–21. https://ideas.repec.org/a/eee/jbrese/v29y1994i3p247-248.html
- Agustin, C., & Singh, J. (2005). Curvilinear effects of consumer loyalty. Journal of Marketing Research, 43(1), 96–108. https://doi.org/https://doi.org/10.1509/jmkr.42.1.96.56961
- Ailawadi, K. L., & Keller, K. L. (2004). Understanding retail branding: Conceptual insights and research priorities. Journal of Retailing, 80(4), 331–342.https://www.sciencedirect.com/science/article/abs/pii/S0022435904000648 doi:https://doi.org/10.1016/j.jretai.2004.10.008
- Anselmsson, J., & Johansson, U. (2009). Retailer brands and the impact on innovativeness in the grocery market.Journal of Marketing Management, 25(1–2), 75–95. https://doi.org/https://doi.org/10.1362/026725709X410043
- Arnett, D. B., German, S. D., & Hunt, S. D. (2003). The identity salience model of relationship marketing success: The case of nonprofit marketing. Journal of Marketing, 67(2), 89–105. https://doi.org/https://doi.org/10.1509/jmkg.67.2.89.18614
- Babin, B. J., Darden, W. R., & Griffin, M. (1994). Work and/or fun: Measuring hedonic and utilitarian shopping value. Journal of Consumer Research, 20(4), 644–656. https://doi.org/https://doi.org/10.1086/209376
- Beckeman, M., & Olsson, A.. (2011). The role of Swedish retailers in food innovations. International Review of Retail, Distribution and Consumer Research, 21(1), 51–70. https://doi.org/https://doi.org/10.1080108021/09593969.2011 doi:https://doi.org/10.1080/09593969.2011.537819
- Beristain, J. J., & Zorrilla, P. (2011). The relationship between store image and store brand equity: A conceptual framework and evidence from hypermarkets. Journal of Retailing and Consumer Services, 18(6), 562–574. https://doi.org/https://doi.org/10.1016/j.jretconser.2011.08.005
- Bigne, E., Borreda, A., & Miquel, M. J. (2013). El valor del establecimiento y su relacion con la imagen de marca privada: Efecto moderador del conocimiento de la marca privada como oferta propia del establecimiento. Revista Europea de Dirección y Economía de la Empresa, 22(4), 1–10. https://doi.org/https://doi.org/10.1016/j.redee.2011.11.001
- Binninger, A. S. (2008). Exploring the relationships between retail brands and consumer store loyalty. International Journal of Retail & Distribution Management, 36(2), 94–110. https://doi.org/https://doi.org/10.1108/09590550810853057
- Blackwell, R. D., Miniard, P. W., & Engel, J. E. (2006). Consumer Behaviour (10th ed.). Thompson, South-Western, SW. https://www.nlb.gov.sg/biblio/12983228
- Bolton, R. N., Kannan, P. K., & Bramlett, M. D. (2000). Implications of loyalty program membership and service experiences for customer retention and value. Journal of the Academy of Marketing Science, 28(1), 95–108. https://doi.org/https://doi.org/10.1177/0092070300281009
- Boulding, W., Kalra, A., Staelin, R., & Zeithaml, V. A. (1993). A Dynamic Process Model of Service Quality: From Expectations to Behavioral Intentions. Journal of marketing research, 30(1), 7–27. https://doi.org/https://doi.org/10.1177/002224379303000102
- Brown, T. (2008). Design thinking. Harvard Business Review, 86(6), 84–96. https://hbr.org/2008/06/design-thinking
- Burt, S., Johansson, U., & Thelander, Å.. (2007). Retail Image as Seen through Consumers' Eyes: Studying International Retail Image through Consumer Photographs of Stores. The International Review of Retail, Distribution and Consumer Research10 10 17.1080/09593960701631516 5 doi:https://doi.org/10.1080/09593960701631516
- Chang, C. H., & Tu, C. Y. (2005). Exploring store image, customer satisfaction and customer loyalty relationship: Evidence from Taiwanese hypermarket industry. Journal of American Academy of Business, 7(2), 197–202. https://doi.org/10.4236/ojbm.2015.31006
- Chang, J. I., & Lee, C. Y. (2020). The effect of service innovation on customer behavioral intention in the Taiwanese insurance sector: The role of word of mouth and corporate social responsibility. Journal of Asia Business Studies, 14(3), 341–360. https://doi.org/https://doi.org/10.1108/JABS-06-2018-0168
- Chowdhury, J., Reardon, J., & Srivastava, R. (1998). Alternative modes of measuring store image: An empirical assessment of structured versus unstructured measures. Journal of Marketing Theory and Practice, 6(2), 72–86. https://doi.org/https://doi.org/10.1080/10696679.1998.11501797
- Christofi, M., Leonidou, E., Vrontis, D., Kitchen, P., & Papasolomou, I. (2015). Innovation and cause-related marketing success: A conceptual framework and propositions. Journal of Services Marketing, 29(5), 354–366. https://doi.org/https://doi.org/10.1108/JSM-04-2014-0114
- Cooil, B., Keiningham, T. L., Aksoy, L., & Hsu, M. (2007). A longitudinal analysis of customer satisfaction and share of wallet: investigating the moderating effect of customer characteristics. Journal of marketing, 71(1), 67–83. doi:https://doi.org/10.1509/jmkg.71.1.67
- Cortinas, M., Chocarro, R., & Villanueva, M. L. (2010). La heterogeneidad de los consumidores en la valoracion de la gestion minorista. Un analisis de segmentacion post-hoc en modelos de ecuaciones estructurales. Revista Española De Investigación De Marketing ESIC, 14(1), 91–113. https://www.esic.edu/editorial/editorial_revista_investigacion_contenidos.php?anterior=297&tematica=777
- Cronbach, L. J. (1951). Coefficient alpha and the internal structure of tests. psychometrika, 16(3), 297–334. doi:https://doi.org/10.1007/BF02310555
- Davis, A. (2013). Promotional cultures: The rise and spread of advertising, public relations, marketing and branding. Polity. https://books.google.co.in/books?hl=en&lr=&id=u9vOcZJUSqkC&oi=fnd&pg=PR3&dq=Davis,+2013+marketing&ots=0Q0OOMisLO&sig=lJbv8dhMKVl7wiVf8R2Cc3xJ0bo#v=onepage&q=Davis%2C%202013%20marketing&f=false
- Delgado, E., Hernandez, M., & Rodriguez, A. (2014). Store image influences in consumers’ perceptions of store brands: The moderating role of value consciousness. European Journal of Marketing, 48(9/10), 1850–1869. https://doi.org/https://doi.org/10.1108/EJM-02-2012-0087
- Djellal, F., Gallouj, F., & Miles, I. (2013). Two decades of research on innovation in services: Which place for public services? Structural Change and Economic Dynamics, 27, 98–117. https://doi.org/https://doi.org/10.1016/j.strueco.2013.06.005
- Eisenbeiss, M., Cornelissen, M., Backhaus, K., & Hoyer, W. D. (2014). Nonlinear and asymmetric returns on customer satisfaction: Do they vary across situations and consumers? Journal of the Academy of Marketing Science, 42(3), 242–263. https://doi.org/https://doi.org/10.1007/s11747-013-0366-1
- Fornell, C., & Larcker, D. F. (1981). Structural Equation Models with Unobservable Variables and Measurement Error: Algebra and Statistics. Journal of Marketing Research, 18(3). doi:https://doi.org/10.2307/3150980
- Fuentes, M., Moliner, B., & Gil, I. (2014). Effect of customer heterogeneity on the relationship satisfactionloyalty. Revista Española De Investigación De Marketing ESIC, 18(4), 78–92. https://doi.org/https://doi.org/10.1016/j.reimke.2014.06.002
- Gallarza, M. G., Ruiz, M. E., & Gil, I. (2016). Stretching the value satisfaction-loyalty chain by adding value dimensions and cognitive and affective satisfactions. Management Decision, 54(4), 981–1003. https://doi.org/https://doi.org/10.1108/MD-07-2015-0323
- Ganesan, S., George, M., Jap, S., Palmatier, R. W., & Weitz, B. (2009). Supply chain management and retailer performance: Emerging trends, issues, and implications for research and practice. Journal of Retailing, 85(1), 84–94. https://doi.org/https://doi.org/10.1016/j.jretai.2008.12.001
- Gelbrich, K. (2011). I have paid less than you! The emotional and behavioral consequences of advantaged price inequality. Journal of Retailing, 87(2), 207–224. https://doi.org/https://doi.org/10.1016/j.jretai.2011.03.003
- Giese, J. L., & Cote, J. A. (2000). Defining customer satisfaction. Academy of Marketing Science Review, (2000)(1), 1–34. https://www.proserv.nu/b/Docs/Defining%20Customer%20Satisfaction.pdf
- Gil, I., Ruiz, M. E., & Berenguer, G. (2014). Retail innovativeness: Importance of ICT and impact on consumer behaviour. In F. Musso & E. Druica (Eds.), Handbook of research on retailer-consumer relationship development (pp. 384–403). IGI Global. https://www.semanticscholar.org/paper/Retail-Innovativeness%3A-Importance-of-ICT-and-Impact-Saura-Molina/d2607aed1e7134033a7d6cb6ee4465a9f7e11a96
- Gil, I., Ruiz, M. E., & Berenguer, G. (2016). Store equity and behavioral intentions: The moderating role of the retailer’s technology. Journal of Product & Brand Management, 25(7), 642–650. https://doi.org/https://doi.org/10.1108/JPBM-11-2015-1035
- Gil, I., Ruiz, M. E., Michel, G., & Corraliza, A. (2013). Retail brand equity: A model based on its dimensions and effects. International Review of Retail, Distribution and Consumer Research, 23(2), 111–136.
- Glynn, M. S., Brodie, R. J., & Motion, J. (2012). The benefits of manufacturer brands to retailers. European Journal of Marketing, 46(9), 1127–1149. https://doi.org/https://doi.org/10.1108/03090561211247856
- Grewal, D., Levy, M., & Kumar, V. (2009). Customer Experience Management in Retailing: An Organizing Framework.Journal of Retailing.85(01). doi:https://doi.org/10.1016/j.jretai.2009.01.001
- Grewal, D., Roggeveen, A. L., & Nordfält, J. (2017). The future of retailing. Journal of Retailing, 93(1), 1–6. https://doi.org/https://doi.org/10.1016/j.jretai.2016.12.008
- Hair, J. F., Jr., Black, W. C., Babin, B. J., Anderson, R. E., & Tatham, R. L. (2006). Multivariate data analysis (6th ed.). Pearson Prentice Hall. https://www.scirp.org/(S(lz5mqp453edsnp55rrgjct55))/reference/ReferencesPapers.aspx?ReferenceID=1747215
- Hair, J. F., Black, W. C., Babin, B. Y. A., Anderson, R., & Tatham, R. (2010). Multivariate data. https://www.pearson.com/uk/educators/higher-education-educators/program/Hair-Multivariate-Data-Analysis-Global-Edition-7th-Edition/PGM916641.html
- Halstead, P., Collins, P., & Isaakidou, V. (2002). Sorting the sheep from the goats: Morphological distinctions between the mandibles and mandibular teeth of AdultOvis and Capra. Journal of Archaeological Science, 29(5), 545–553. https://doi.org/https://doi.org/10.1006/jasc.2001.0777
- Harrison-Walker, L. J. (2001). The measurement of word-of-mouth communication and an investigation of service quality and customer commitment as potential antecedents. Journal of Service Research, 4(1), 60–75. https://doi.org/https://doi.org/10.1177/109467050141006
- Hartman, K. B., & Spiro, R. S. (2005). Recapturing store image in consumer-based store equity: A construct conceptualization. Journal of Business Research, 58(8), 1112–1120. https://doi.org/https://doi.org/10.1016/j.jbusres.2004.01.008
- Helgesen, O., Havold, J. I., & Nesset, E. (2010). Impacts of store and chain images on the “quality– Satisfaction–loyalty process” in petrol retailing. Journal of Retailing and Consumer Services, 17(2), 109–118. https://doi.org/https://doi.org/10.1016/j.jretconser.2009.11.001
- Hellier, P. K., Geursen, G. M., Carr, R. A., & Rickard, J. A. (2003). Customer repurchase intention: A genera structural equation model. European Journal of Marketing, 37(11/12), 1762–1800. https://doi.org/https://doi.org/10.1108/03090560310495456
- Holbrook, M. B. (1999). Consumer value. A framework for analysis and research. Routledge.
- Homburg, C., Hoyer, W. D., & Fassnacht, M. (2002). Service orientation of a retailer’s business strategy: Dimensions, antecedents, and performance outcomes. Journal of Marketing, 66(4), 86–101. https://doi.org/https://doi.org/10.1509/jmkg.66.4.86.18511
- Hristov, L., & Reynolds, J. (2015). Perceptions and practices of innovation in retailing. International Journal of Retail & Distribution Management. https://www.emerald.com/insight/content/doi/10.1108/IJRDM-09-2012-0079/full/html
- Hu, B. (2014). Linking business models with technological innovation performance through organizational learning. European Management Journal, 32(4), 587–595.https://doi.org/10.1016/j.emj.2013.10.009
- Huang, C. C., Yen, S. W., Liu, C. Y., & Chang, T. P. (2014). The relationship among brand equity, customersatisfaction, and brand resonance to repurchase intention of cultural and creative industries in Taiwan. The International Journal of Organizational Innovation, 6(3), 106–120. http://cejsh.icm.edu.pl/cejsh/element/bwmeta1.element.cejsh-7075a168-3b6d-4b37-8202-32d311403fa6
- Jacobs, B. (2013). The manipulation of fear in carjacking. Journal of Contemporary Ethnography, 42(5), 523–544. doi:https://doi.org/10.1177/0891241612474934
- Janda, S., Trocchia, P. J., & Gwinner, K. P. (2002). Consumer perceptions of Internet retail service quality. International Journal of Service Industry Management, 13(5), 412–431. https://doi.org/https://doi.org/10.1108/09564230210447913
- Jayawardhena, C., Morrell, K., & Stride, C. (2016). Ethical consumption behaviours in supermarket shoppers: Determinants and marketing implications. Journal of Marketing Management, 32(7–8), 775–805. https://doi.org/https://doi.org/10.1080/0267257X.2015.1134627
- Jensen, J. K., Munksgaard, K. B., & Arlbjorn, J. S. (2013). Chasing value offerings through green supply chain innovation. European Business Review, 25(2), 124–146. https://doi.org/https://doi.org/10.1108/09555341311302657
- JJinfeng, W., & Zhilong, T. (2009). The impact of selected store image dimensions on retailer equity: Evidence from 10 Chinese hypermarkets. Journal of Retailing and Consumer Services, 16(6), 486–494. https://doi.org/https://doi.org/10.1016/j.jretconser.2009.08.002
- Johnson, M. D., Herrmann, A., & Huber, F. (2006). The evolution of loyalty-intentions. Journal of Marketing, 70(2), 122–132. https://doi.org/https://doi.org/10.1509/jmkg.70.2.122
- Keller, K. L. (1993). Conceptualizing, measuring, and managing customer-based brand equity. Journal of Marketing, 57(1), 1–22. https://doi.org/https://doi.org/10.1177/002224299305700101
- Khaled, A. S. D., Ahmed, D. S., & Sunduschisti. (2018). The implementation of rid technology in retail industry in India analysis: A global perspective (Revised ed.). Pearson.
- Khaled, A. S. D., Sharma, D. A., Almugari, F. A. M., & Ahmed, D. S. (2020). REBUILDING E-TAILERS’ SERVICES: A STUDY ON DEFEND PURCHASE at retail store. International Journal of Advanced Science and Technology, 29(12s), 1664–1674. http://sersc.org/journals/index.php/IJAST/article/view/23904
- King, R. A., Racherla, P., & Bush, V. D. (2014). What we know and don’t know about online word-of- mouth: A review and synthesis of the literature. Journal of Interactive Marketing, 28(3), 167–183. https://doi.org/https://doi.org/10.1016/j.intmar.2014.02.001
- Kumar, A., Gupta, S. L., & Kishore, N. (2014). Measuring retailer store image: A scale development study. International Journal of Business and Economics, 13(1), 25–38. https://econpapers.repec.org/article/ijbjournl/v_3a11_3ay_3a2014_3ai_3a1_3ap_3a25-38.htm
- Kumar, V., Ananda, A., & Song, H. (2017). Future of retailer profitability: An organizing framework. Journal of Retailing, 93(1), 96–119. https://doi.org/https://doi.org/10.1016/j.jretai.2016.11.003
- Kumar, V., Pozza, I. D., & Ganesh, J. (2013). Revisiting the satisfaction-loyalty relationship: Empirical generalizations and directions for future research. Journal of Retailing, 89(3), 246–262. https://doi.org/https://doi.org/10.1016/j.jretai.2013.02.001
- Laroche, M., Babin, B. J., Lee, Y. K., Kim, E. J., & Griffin, M. (2005). Modeling consumer satisfaction and word‐of‐mouth: restaurant patronage in Korea. Journal of Services Marketing. https://www.emerald.com/insight/content/doi/10.1108/08876040510596803/full/html
- Leppaniemi, M., Jayawardhena, C., Karjaluoto, H., & Harness, D. (2017). Unlocking behaviors of long-term service consumers: The role of action inertia. Journal of Service Theory and Practice, 27(1), 270–291. https://doi.org/https://doi.org/10.1108/JSTP-06-2015-0127
- Leroi-Werelds, S., Streukens, S., Brady, M. K., & Swinnen, G. (2014). Assessing the value of commonly used methods for measuring customer value: A multi-setting empirical study. Journal of Academy of Marketing Science, 42(4), 430–451. https://doi.org/https://doi.org/10.1007/s11747-013-0363-4
- Litvin, S. W., Goldsmith, R. E., & Pan, B. (2008). Electronic word-of-mouth in hospitality and tourism management. Tourism Management, 29(3), 458 468. https://doi.org/https://doi.org/10.1016/j.tourman.2007.05.011
- Manohar, S., Mittal, A., & Marwah, S. (2019). Service innovation, corporate reputation and word-of-mouth in the banking sector. Benchmarking: An International Journal, 27(1), 406–429. https://doi.org/https://doi.org/10.1108/BIJ-05-2019-0217
- Martos-Partal, M., & González-Benito, Ó. (2013). Studying motivations of store-loyal buyers across alternative measures of behavioural loyalty. European Management Journal, 31(4), 348–358. doi:https://doi.org/10.1016/j.emj.2013.01.010
- Mathwick, C., Malhotra, N. K., & Rigdon, E. (2002). The effect of dynamic retail experiences on experiential perceptions of value: An internet and catalog comparison☆ ☆Charla Mathwick is Assistant Professor of Marketing at Portland State University. Naresh Malhotra is Regents’ Professor at Georgia Institute of Technology. Edward Rigdon is Associate Professor of Marketing at Georgia State University. This article is based on the first author’s doctoral dissertation at Georgia Institute of Technology. 1 1We want to thank three anonymous reviewers and the special issue editors for their many helpful suggestions. Journal of Retailing, 78(1), 51–60. https://doi.org/https://doi.org/10.1016/S0022-4359(01)00066-5
- Mazzarol, T., Sweeney, J. C., & Soutar, G. N. (2007). Conceptualizing word-of-mouth activity, triggers and conditions: An exploratory study. European Journal of Marketing, 41(11/12), 1475–1494. https://doi.org/https://doi.org/10.1108/03090560710821260
- Meyer, C., & Schwager, A. (2007). Understanding customer experience. Harvard business review, 85(2), 116. https://d1wqtxts1xzle7.cloudfront.net/35132402/FINAL_HBR_Understanding_Customer_Experience.pdf?1413332186=&response-content-disposition=inline%3B+filename%3DUnderstanding_Customer_Experience.pdf&Expires=1609816607&Signature=D-3gdwQd6coigMMKvMUqyzmpLXGaCgyi5D~fdLyny4WUfBO-WVBaifVQwBnYGT803BJpfMwWVRxZQUFtZEnr369-hNh9Jktpc1yORXa0mmMR9SGEF6JkJd1Be4JRlrDV6z0w~boieUEaJ-jpvJT~rN04Wl3FsW2x0yz6zn6JWbx1bCbGs1fxJZpes~HOSLmBdQhGY3nFw7qazb7SyMv5iU-a8yH1p1TPVg0sGbKXwsPh2E5iYKhwulCe2tkUdaDasPnuSYMhePkEt8tbwqgBsk4H~irOlCFj7CEl~oNMhvtrb4iFRjIt2Jp2ct0WQaSEoAhcbFbtMxt6HyrjFoWhAA__&Key-Pair-Id=APKAJLOHF5GGSLRBV4ZA
- Moon, H., Miller, D. R., & Kim, S. H. (2013). Product Design Innovation and Customer Value: Cross-Cultural Research in the United States and Korea. Journal of Product Innovation Management, 30(1), 31–43. https://doi.org/https://doi.org/10.1111/j.1540-5885.2012.00984.x
- Morschett, D., Swoboda, B., & Foscht, T. (2005). Perception of store attributes and overall attitude towards grocery retailers: The role of shopping motives. The International Review of Retail, Distribution and Consumer Research, 15(4), 423–447. arketing practices”, Management Communication Quarterly, Vol. 19 No. 4, pp. 601-634. https://doi.org/https://doi.org/10.1080/09593960500197552
- Musso, F. (2010). Innovation in marketing channels. SYMPHONYA Emerging Issues in Management, (1), 23–41. https://core.ac.uk/download/pdf/6330711.pdf 1 doi:https://doi.org/10.4468/2010.1.04musso
- Naidoo, V. (2010). Firm survival through a crisis: The influence of market orientation, marketing innovation and business strategy.Industrial Marketing Management, 39(8), 005. doi:https://doi.org/10.1016/j.indmarman.2010.02.005
- Nemati, A., Khan, K., & Iftikhar, M. (2010). Impact of innovation on customer satisfaction and brand loyalty: A study of mobile phones users in Pakistan. European Journal of Social Sciences, 16(2), 299–306. https://www.semanticscholar.org/paper/Impact-of-Innovation-on-Customer-Satisfaction-and-%2C-Nemati/6038f3b1184ff66c27a17dd850e38c1b0cdbb173
- Nesset, E., Nervik, B., & Helgesen, Ø. (2011). Satisfaction and image as mediators of store loyalty drivers in grocery retailing. The International Review of Retail. Distribution and Consumer Research, 21(3), 267–292. https://doi.org/https://doi.org/10.1080/09593969.2011.588716
- Nooteboom, B., Berger, H., & Noorderhaven, N. G. (1997). Effects of trust and governance on relational risk. Academy of Management Journal, 40(2), 308–338. https://doi.org/https://doi.org/10.2307/256885 2 doi:https://doi.org/10.2307/256885
- Ochoa, M. A. M., & Pimiento, E. O. (2014). Impacto de las tic en la calidad de servicio y satisfacción de los clientes como herramienta de competitividad en el sector financiero (Caso De Estudio: Banco Sofitasa-Venezuela. La productividad, competitividad y capital humano en las organizaciones). p. 439.
- OECD. (2005). The measurement of scientific and technological activities Oslo Manual. Guidelines for collecting and interpreting innovation data (3rd ed.). https://www.oecd-ilibrary.org/science-and-technology/oslo-manual_9789264013100-en
- Oliver, R.L. (2010). Satisfaction: A Behavioral Perspective on the Consumer: A Behavioral Perspective on the Consumer (2nd ed.). Routledge. https://doi.org/https://doi.org/10.4324/9781315700892
- Palacios-Marqués, D., Soto-Acosta, P., & Merigó, J. M. (2015). Analyzing the effects of technological, organizational and competition factors on Web knowledge exchange in SMEs. Telematics and Informatics, 32(1), 23-32. https://doi.org/10.1016/j
- Pappu, R., & Quester, P. (2006). A consumer-based method for retailer equity measurement: Results of an empirical study. Journal of Retailing and Consumer Services, 13(4), 317–329. https://doi.org/https://doi.org/10.1016/j.jretconser.2005.10.002
- Parasuraman, A., & Grewal, D. (2000). The impact of technology on the quality-value-loyalty chain: A research agenda. Journal of the Academy of Marketing Science, 28(1), 168–174. https://doi.org/https://doi.org/10.1177/0092070300281015
- Payne, A., & Holt, S. (2001). Diagnosing customer value: Integrating the value process and relationship marketing. British Journal of Management, 12(2), 159–182. https://doi.org/https://doi.org/10.1111/1467–8551.00192
- Pere, E., Rodríguez–Salvador, M., & Maspons–Moch, R. (1999). Mapas tecnológicos y oportunidades de mercado. In Proceedings of the VIII Seminario bianual latinoamericano de gestión tecnológica ALTEC (pp. 318–325). Valencia, Spain. https://www.econstor.eu/bitstream/10419/210542/1/foresight-sti-gov-2016.3.018.028.pdf
- Pomirleanu, N., Chennamaneni, P. R., & Krishen, A. S. (2016). Easy to please or hard to impress: Elucidating consumers’ innate satisfaction. Journal of Business Research, 69(5), 1914–1918. https://doi.org/https://doi.org/10.1016/j.jbusres.2015.10.079
- Rambocas, M., Kirpalani, V. M., & Simms, E. (2014). Building brand equity in retail banks: The case o Trinidad and Tobago. International Journal of Bank Marketing, 32(4), 300–320. https://doi.org/https://doi.org/10.1108/IJBM-11-2013-0136
- Renko, S., & Druzijanic, M. (2014). Perceived usefulness of innovative technology in retailing: Consumers ׳and retailers ׳ point of view. Journal of Retailing and Consumer Services, 21(5), 836–843. https://doi.org/https://doi.org/10.1016/j.jretconser.2014.02.015
- Rust, R. T., & Oliver, R. L. (2000). Should we delight the customer? Journal of the Academy of Marketing Science, 28(1), 86. https://doi.org/https://doi.org/10.1177/0092070300281008
- Schneider, J., & Stickdorn, M. (2011). This is service design thinking. John Wiley and Sons Publishers.https://www.wiley.com/en-us/This+is+Service+Design+Thinking%3A+Basics%2C+Tools%2C+Cases-p–9781118156308
- Schreuer, R. (2000). To build brand equity, marketing alone is not enough. Strategy and Leadership, 28(4), 16–20. https://doi.org/https://doi.org/10.1108/10878570010378663
- Seiders, K., Voss, G. B., Grewal, D., & Godfrey, A. L. (2005). Do satisfied customers buy more? Examining moderating influences in a retailing context. Journal of Marketing, 69(4), 26–43. https://doi.org/https://doi.org/10.1509/jmkg.2005.69.4.26
- Sekhon, H. S., Al-Eisawi, D., Roy, S. K., & Pritchard, A. (2015). Service excellence in UK retail banking: Customers’ perspectives of the important antecedents. International Journal of Bank Marketing, 33(7), 904–921. https://doi.org/https://doi.org/10.1108/IJBM-10-2014-0136
- Shankar, V., Inman, J. J., Mantrala, M., Kelley, E., & Rizley, R. (2011). Innovations in Shopper Marketing: Current Insights and Future Research Issues.Journal of Retailing, 87(04), 007 doi:https://doi.org/10.1016/j.jretai.2011.04.007
- Sharma, M., & Chaubey, D. S. (2014). An Empirical Study of Customer Experience and its Relationship with Customer Satisfaction towards the Services of Banking Sector. Journal of Marketing & Communication, 9(3). https://d1wqtxts1xzle7.cloudfront.net/34191259/An_Empirical_Study_of_Customer_satisfaction_in_banking_industry.pdf?1405293056=&response-content-disposition=inline%3B+filename%3DAn_Empirical_Study_of_Customer_Experienc.pdf&Expires=1609816565&Signature=acw1AdbttJZwqaxLGafJz56lxlLC8jwN3EydLe6m~nEoQSHLft3s5qtz5~NUZWNx5CSnZSWpeMrSci3xRyPlN765XdoV0Kp9VxC6m-HLjvj61PR8Z8Qe8OUujZYXx8aGWPowEcICsg7wzNZWSqgcMrAS~kPWjdTEmcNRgNOrQZ5hWv-AyIQ~IQnpsa2cF3olxUBSq3dkSKGYTa-SXcGsCMSc1bz21sbT1mn4qRZcoX0whn7db9Y836QU6eTvSTS55xpmLcfXnODmzeTcoIydyglpXqbYQTLYXiyswzmeWHzRYx6pWY~SOxnO38PfhPhlVL07U79av-wlhuT2xaEvtA__&Key-Pair-Id=APKAJLOHF5GGSLRBV4ZA
- Shen, P. (2010b). A study on the multi-dimensional relationship between consumer shopping value and retailer brand equity. In Marketing science innovations and economic development- Proceedings of 2010 Summit International Marketing Science and Management Technology Conference (pp. 128–132).
- Simon, A., & Yaya, L. H. P. (2012). Improving innovation and customer satisfaction through systems integration. Industrial Management & Data Systems. https://www.emerald.com/insight/content/doi/10.1108/02635571211255005/full/html
- Sullivan, P., Kang, J., & Heitmeyer, J. (2012). Fashion involvement and experiential value: Gen Y retail apparel patronage. The International Review of Retail. Distribution and Consumer Research, 22(5), 459–483. https://doi.org/https://doi.org/10.1080/09593969.2012.711252
- Swan, J. E., & Oliver, R. L. (1989). Postpurchase communications by consumers. Journal of Retailing, 65(4), 516–533.https://psycnet.apa.org/record/1990-18625-001
- Sweeney, J. C., & Soutar, G. N. (2001). Consumer perceived value: The development of a multiple item scale. Journal of Retailing, 77(2), 203–220. https://doi.org/10.1016/S0022-4359(01)00041-0 2 doi: https://doi.org/10.1016/S0022-4359(01)00041-0
- Sweeney, J. C., Soutar, G. N., & Johnson, L. W. (1999). The role of perceived risk in the quality-value relationship: A study in a retail environment. Journal of retailing, 75(1), 77–105. https://doi.org/https://doi.org/10.1016/S0022-4359(99)80005-0
- Szymanski, D. M., & Henard, D. H. (2001). Customer satisfaction: A meta-analysis of the empirical evidence. Journal of the Academy of Marketing Science, 29(1), 16. https://doi.org/https://doi.org/10.1177/0092070301291002
- Teas, R. K., & Agarwal, S. (2000). The effects of extrinsic product cues on consumers’ perceptions of quality, sacrifice, and value. Journal of the Academy of Marketing Science, 28(2), 278–290. https://doi.org/https://doi.org/10.1177/0092070300282008
- Terblanche, N. S., & Boshoff, C. (2004). The in-store shopping experience: A comparative study of supermarket and clothing store customers. South African Journal of Business Management, 35(4), 1–10. https://doi.org/https://doi.org/10.4102/sajbm.v35i4.663
- Tether, B. (2005). Do services innovate (differently)? Insights from the European innobarometer. Industry and Innovation, 12(2), 153–184. https://doi.org/https://doi.org/10.1080/13662710500087891
- Thiesse, F., Al-Kassab, J., & Fleisch, E. (2009). Understanding the value of integrated RFID systems: A case study from apparel retail. European Journal of Information Systems, 18(6), 592–614. https://doi.org/https://doi.org/10.1057/ejis.2009.33
- Thomas, S. (2013). Linking customer loyalty to customer satisfaction and store image: A structural model for retail stores. Decision, 40(1–2), 15–25. https://doi.org/https://doi.org/10.1007/s40622-013-0007-z
- Townsend, W. (2010). Innovation and the value of failure. International Journal of Management and Marketing Research, 3(1), 75–84.https://papers.ssrn.com/sol3/papers.cfm?abstract_id=1668874
- Verganti, R. (2008). Design, meanings, and radical innovation: A metamodel and a research agenda. Journal of product innovation management, 25(5), 436–456. doi:https://doi.org/10.1111/jpim.2008.25.issue-5
- Verhoef, P. C. (2003). Understanding the effect of customer relationship management efforts on customer retention and customer share development. Journal of Marketing, 67(4), 30–45. https://doi.org/https://doi.org/10.1509/jmkg.67.4.30.18685
- Verhoef, P. C., Frances, P. H., Franses, P. H., & Hoekstra, J. C. (2002). The effect of relational constructs on customer referrals and number of services purchased from a multiservice provider: does age of relationship matter? Journal of the Academy of Marketing Science, 30(3), 202–216. https://doi.org/https://doi.org/10.1177/0092070302303002
- Verhoef, P. C., Lemon, K. N., Parasuraman, A., Roggeveen, A., Tsiros, M., & Schlesinger, L. A. (2009). Customer Experience Creation: Determinants, Dynamics and Management Strategies.Journal of Retailing, 85. doi:https://doi.org/10.1016/j.jretai.2008.11.001
- Vesel, P., & Zabkar, V. (2009). Managing customer loyalty through the mediating role of satisfaction in the DIY retail loyalty program. Journal of Retailing and Consumer Services, 16(5), 396–406. https://ideas.repec.org/a/eee/joreco/v16y2009i5p396-406.html 5 doi:https://doi.org/10.1016/j.jretconser.2009.05.002
- Vianna, M., Vianna, Y., Adler, I., Lucena, B., & Russo, B. (2011). Design thinking: Business innovation. MJV Press.https://www.ibo.org/contentassets/019c8bebf2a84f2c8493ae56de3c8c34/131-andrewmayesdesignignitingmindsandimpactinglives.pdf
- Walsh, G., Evanschitzky, H., & Wunderlich, M. (2008). Identification and analysis of moderator variables.Investigating the customer satisfaction-loyalty link. European Journal of Marketing, 42(9/10), 977–1004. https://doi.org/https://doi.org/10.1108/03090560810891109
- Weerawardena, J., O’Cass, A., & Julian, C. (2006). Does industry matter? Examining the role of industry structure and organizational learning in innovation and brand performance. Journal of Business Research, 59(1), 37–45. https://doi.org/https://doi.org/10.1016/j.jbusres.2005.02.004
- Westbrook, R. A. (1987). Product/consumption-based affective responses and postpurchase processes. Journal of marketing research, 24(3), 258–270. https://doi.org/https://doi.org/10.1177/002224378702400302
- White, R. C., Joseph-Mathews, S., & Voorhees, C. M. (2013). The effects of service on multichannel retailers’ brand equity. Journal of Services Marketing, 27(4), 259–270. https://doi.org/https://doi.org/10.1108/08876041311330744
- Woodruff, R. B. (1997). Customer value: The next source for competitive advantage. Journal of the Academy of Marketing Science, 25(2), 139–153. https://doi.org/https://doi.org/10.1007/BF02894350
- Wu, F., Yeniyurt, S., Kim, D., & Cavusgil, S. T. (2006). The impact of information technology on supply chain capabilities and firm performance: A resource-based view.Industrial Marketing Management, 35(4), 003. doi:https://doi.org/10.1016/j.indmarman.2005.05.003
- Yeh, H. (2015). Effects of ICT’s innovative applications on brand image and customer’s purchase intention. The International Journal of Organizational Innovation, 7(4), 31–47.
- Yoo, B., Donthu, N., & Lee, S. (2000). An examination of selected marketing mix elements and brand equity. Journal of the Academy of Marketing Science, 28(2), 195–211. https://doi.org/https://doi.org/10.1177/0092070300282002
- Yoon, S., Oh, S., Song, S., Kim, K. K., & Kime, Y. (2014). Higher quality or lower price? How value increasing promotions affect retailer reputation via perceived value. Journal of Business Research, 67(10), 2088–2096. https://doi.org/https://doi.org/10.1016/j.jbusres.2014.04.017
- Zeithaml, V. A. (1988). Consumer perceptions of price, quality, and value: A means-end model and synthesis of evidence. Journal of Marketing, 52(3), 2–22. https://doi.org/https://doi.org/10.1177/002224298805200302
- Zeithaml, V. A., Berry, L. L., & Parasuraman, A. (1996). The behavioral consequences of service quality. Journal of Marketing, 60(2), 31–46. https://doi.org/https://doi.org/10.1177/002224299606000203