
Abstract
This article investigates the impact of traceability of the quality of the information system on humanitarian logistics performance. There are four variables studied, namely electronic data interchange (EDI) adoption, blockchain (BC) adoption, radio frequency identification (RFID) adoption, traceability of humanitarian logistics, and humanitarian logistics performance. This research was conducted to assess disaster logistics services in the implementation of service principles in humanitarian logistics. The conceptual model is modeled by introducing three information technologies as independent variables and the humanitarian traceability and logistics performance as dependent variables. The questionnaire was distributed to 96 respondents, and the data was processed using PLS-SEM 2.0. The results show that EDI adoption has no significant effect on the traceability of humanitarian logistics. In contrast, BC and RFID adoption has a significant effect on the traceability of humanitarian logistics. In addition, this study also shows that humanitarian logistics traceability has a significant impact on humanitarian logistics performance.
PUBLIC INTEREST STATEMENT
In humanitarian logistics, the providers are rare to notice the fundamental thing in delivering logistics, namely traceability. Unlike commercial logistics services that pay more attention to the traceability factor in their information systems for customers, it does not receive much attention in the logistics relief system. This is because the majority of customers who donate goods to humanitarian logistical services do not care about the tracking process. Therefore, this study intends to figure out what are the factors that affected the traceability in implementing humanitarian logistics. The purpose of this study is to determine whether traceability in humanitarian logistics affects humanitarian performance that can be measured through customer satisfaction.
1. Introduction
Logistics is closely relatable to the process of planning, controlling material flow, and information. Logistics has the purpose of organizing goods to the shipment and deliver quickly in the precise amount to the customers (Casado-Vara et al., Citation2018; Shah et al., Citation2020). The total number of logistic needs in Indonesia is likely constant and could be predicted every year (BPS, Citation2019). There are two types of logistics, namely commercial logistics, Specialized Logistics, i.e., Humanitarian Logistics. Humanitarian Logistics works as one of the strategies to handle natural disasters, such as sending the goods or necessary materials to the disaster victims, which is this request is unpredictable. Humanitarian logistics is the supply chain that works rapidly, and it is expected to adjust either with climate change or the time by utilizing an available resource (Li et al., Citation2008; Zhang et al., Citation2019).
Traceability is crucial as one of the information that the customers must receive. Communication and information are essential to hook up the providers, especially in commercial logistics. The existence of traceability becomes one of the consideration factors from logistics performance. The average performance of logistics providers can be seen from customer satisfaction. In this regard, accurate information in logistics is essentially important for traceability to function. For example, An et al. (Citation2010) stated that technical services such as the quality system, reporting, and logistics structure make the customer feels satisfied and willing to use that service again. Asad et al. (Citation2016) analyzed that online service quality also affected the customer’s satisfaction. Souad Djelassia and Stephan (Citation2020) agreed that technology as an information medium is very important for service providers. This is because of the considerable influence of useful information on the performance of humanitarian logistics service providers. Effectiveness in the form of the quality of traceability, services, information systems, and operational effectiveness has a significant effect on customer satisfaction. This customer satisfaction becomes a parameter to measure the performance of logistics service providers. Hult et al. (Citation2019) explained that service providers, who cannot manage information well, will not last long. This shows the importance of quality information and quality reporting systems owned by every service provider. Processes that run systematically according to the service provider schedule and procedures can make customers feel satisfied (Usman et al., Citation2019). Compliance with the plan and procedures means the service provider can account for what has been promised to the customer. This will trigger feelings of satisfaction from customers. The variables above are believed to increase customer satisfaction and quality improvement (Gharaei, Hoseini Shekarabi et al., Citation2019; Santa et al., Citation2019). Manuel et al. (Citation2018) states that a system that is fast, systematic, accurate, and traceable in all respects can increase customer satisfaction reflects the performance of logistics service providers.
On the contrary, traceability is not the norm in humanitarian logistics, unlike commercial logistics. This is because most customers who donate to humanitarian logistical services do not care about the tracking process. This, in turn, creates a loophole for their logistical performance objective (Giri & Masanta, Citation2020; Tomasini et al., Citation2009). Moreover, there has been little research that addressed the quality of service in Indonesian humanitarian logistics in traceability technology, even though the traceability services are essential based on Masudin et al. (Citation2020) and Restuputri et al. (Citation2020). Therefore, this study intends to figure out the factors that affected the traceability of humanitarian logistics in Indonesia. The purpose of this research is to determine whether traceability in humanitarian logistics affects humanitarian performance that can be measured through customer satisfaction.
The rest of the article is organized as follows: section 1 (introduction) discusses this study’s background and fills the gap of previous studies. Section 2 discusses the related studies that contributed to developing the framework. Then, the research methodology is discussed in the next section, followed by section 4, which discussed the analysis of the results. The later section of this article will be the discussion and managerial implications. Then, the final section of this article is the conclusion
2. Literature review
2.1. Humanitarian logistics
Humanitarian logistics is all activities related to planning, implementing, and controlling the flow to help disaster victims handle natural disaster victims. Humanitarian logistics has an unpredictable and sudden number of requests. Humanitarian Logistics is a supply chain that must be agile and can be placed towards the destination or time to change the environment using existing resources (Li et al., Citation2008; Zhang et al., Citation2019). Providers of humanitarian logistics services must hold a variety of existing disasters. Among natural disasters, wars, also massive disasters (EM-DAT, Citation2010). This disaster can provide material losses and damage to the environment (Breckner et al., Citation2016). Under these circumstances, the number of requests is unpredictable, and customer needs include water services, food, medicine, clothing, and blood (Christopher & Towill, Citation2001; Nagurney et al., Citation2019).
According to Vega et al. (Citation2015), humanitarian logistics must be able to take prompt and appropriate action in accordance with the time needed to send relief items required by the victims. Staff must respond to disasters (Anderson et al., Citation2018; Juga et al., Citation2010). If it is not responsive, it will result in more severe victims of natural disasters recover.
2.2. The Process of humanitarian logistics
According to Masudin and Fernanda (Citation2019), many journals discuss earthquakes and post-disaster physical renewal in humanitarian logistics. Economic revitalization is the least discussed, while long-term renewal is the most discussed in around 2010 up to 2012. From 2016 up to 2017, most journal articles have discussed renewal management, and most researchers were researched long-term reconstruction in 2010–2012. This finding has shown that the management disaster process in humanitarian logistics still needs to be developed. Humanitarian logistics work in the field of humanity, especially in the process of natural disaster management. Humanitarian Logistics must adapt to environmental change by applying the resource (Kazemi et al., Citation2018; Li et al., Citation2008; Zhang et al., Citation2019).
The processes that occur in logistics are related to procurement activities, demand management, customer service, and customer relations that all aim to meet customer demand well (Casado-Vara et al., Citation2018; Douglas & Lambert, Citation2000; Gharaei, Hoseini Shekarabi et al., Citation2020; Hoseini Shekarabi et al., Citation2019). Activities in logistics focus on responding to customer requests. Meanwhile, in the humanitarian logistics operation, several studies were conducted to measure performance. Gharaei, Karimi et al. (Citation2019) believe the importance of the warehouse location and allocation for the implementation of humanitarian logistics. These studies show that the supply chain of humanitarian logistics provides the main warehouse supply (usually located near the airport or port). Then the inventory is placed in a permanent warehouse (generally close to the city). At this stage, the same logistics activities as storage, sorting, and shipping activities are completed before the next process is carried out. Humanitarian logistics’ permanent warehouse is named a hub before being sent to the local distribution center. Inventories for Humanitarian Logistics are then distributed to smaller tertiary warehouses before being distributed to recipients. The length of the supply chain process in Humanitarian logistics is different from the distribution of products for commercial purposes, where it is as much as possible to make a short supply chain. Consequently, the longer the supply chain, the customer’s level of service is lower (Gharaei, Karimi et al., Citation2019).
2.3. Humanitarian logistic performance
One of the index performance measurements from a product or service is customer satisfaction (M.-C. Chen et al., Citation2011; Sarkar & Giri, Citation2020). The level of satisfaction is the different function between performance and expectations. The relationship between service quality levels is proportional to customer satisfaction. The better the quality of the services provided, the higher the customer satisfaction. This shows that there is a close relationship between service quality and customer satisfaction. Thus, customer expectations for the fulfillment of good service quality from service providers are behind the different responses in the same business.
In humanitarian logistics, research on satisfaction is vital to discuss. What can trigger satisfaction is the time to send logistical assistance to victims quickly and on target (M.-C. Chen et al., Citation2015). This is because humanitarian logistics sends emergency goods to victims of natural disasters. The fatal consequences if the LSPs are late in sending items because their bets are the lives of disaster victims. Goods shipped to natural disaster victims include medicines, water, clothing, food, and other basic needs (Gharaei, Karimi et al., Citation2020; Nagurney et al., Citation2019). Safaei et al. (Citation2018) and Giri and Bardhan (Citation2014) also mentioned that humanitarian logistics with uncertainty in the parameters of demand and supply need to consider optimizing the costs of aid operations and penalties for victim dissatisfaction with the services provided. This serves to increase customer satisfaction.
2.4. Traceability Humanitarian Logistics
According to humanitarian logistics perceptions, the information system has the responsibility to supply a business user in a management disaster. The information system is developed in the logistics business for the last customer. Therefore, the information structure is easily constructed based on the logistical supply chain hierarchy from the previous customer to the supplier (Yin et al., Citation2016). In humanitarian logistics, the number of requests is based not only on customers’ needs but also on external service providers and aid providers, both government and non-government organizations that support natural disaster management. They are the decision-makers to prioritize what kind of conditions will be assisted by logistics service providers. This cannot be predicted as easily as a conventional logistics system. The structure of information in the disaster management process is fundamental to providing timely and accurate information about what is needed, what items are required, and where the location is (Gharaei, Karimi et al., Citation2020; Howden, Citation2009; Silva et al., Citation2019).
The information system is crucial for all humanitarian logistics operations, both in shipping, warehousing, and all other logistics activities. Promoting this information system is technical support and connects all logistics users, including government, donors, NGOs, logistics service providers, disaster management communities, and natural disaster victims (Maiers et al., Citation2005; Silva et al., Citation2019).
2.5. Electronic data interchange (EDI) adoption
Electronic Data Interchange (EDI) is the transmission of information or electronic documents such as invoices, bills of lading, or purchase orders between computer systems in various organizations based on format, structured, and recoverable (J.-C. Chen & Williams, Citation1998). EDI is the main application that strengthens e-business; nearly 200,000 companies worldwide use EDI as part of their e-business initiatives.
There are many benefits to implementing EDI. First, customers and suppliers can interact in the same time environment, thereby reducing procurement time. The suppliers linked by EDI can create a reasonable exchange of information between customers, suppliers, distributors, and other trading partners (Rabbani et al., Citation2019; Rebecca Angelesa et al., Citation2001). This arrangement allows all parties to be more reactive to market conditions and consequently gain a competitive advantage. Second, the EDI system adoption allows quick access to relevant information, resulting in improved service to customers (Murphy & Daley, Citation1996). Third, EDI is known to improve transaction accuracy, speed up payments, as a form of compliance with customs requirements, and simplify the intricacies of global trade (Murphy & Daley, Citation1996). It is essential to have electronic data in humanitarian logistics to facilitate communication between humanitarian logistics service providers and customers. However, there is no previous research that discusses EDI adoption in the implementation of humanitarian logistics.
2.6. Blockchain adoption
Blockchain is a system of recording transactions in many databases that are widespread on many computers, each containing identical records. With this decentralized transaction record, it is almost impossible to hack or change unilaterally without controlling most databases or computers. The blockchain is shared, distributed, and synchronized to facilitate recording transactions and tracking business network assets. Assets can be tangible, such as houses, cars, money, land, or intangible, such as intellectual property, energy, patents, or copyrights. Virtually everything about value can be tracked and traded on a blockchain network (Chung et al., Citation2019). Blockchain consists of data that cannot be changed and recorded digitally in blocks. These blocks are stored in a chain and spread across several servers on a public or private peer-to-peer network to eliminate manipulation. Database synchronization, content agreements, and transactions in the ledger require a validated consensus protocol between all parties (Brakeville & Perepa, Citation2018). Protocols effectively manage risks associated with entries on the blockchain, for example, multiple or permitted expenditures, which allow only certain parties to send and validate transactions, or public and undeliverable, allowing anyone to send transactions and participate in validating networks. There is also a hybrid version. These alternatives present various challenges regarding risk management.
Risks in the adoption of blockchain include loss of Return of Investment (ROI) and lost business value (Drljevic et al., Citation2020), and unsustainable usage scenarios (Drljevic et al., Citation2020; Kim & Kang, Citation2017). It is also causing a lack of understanding about the potential of technology that is directly linked to missing standards and requirements and the need for engineering practices in any existing problem (Drljevic et al., Citation2020; Sayyadi & Awasthi, Citation2020). In its development in humanitarian logistics, research on the use of blockchain is still not widely found. The use of blockchain is only limited to conventional logistics.
2.7. Radio frequency identification (RFID) adoption
Radio Frequency Identification (RFID) is a technology that uses communication via electromagnetic waves to change data between terminals and objects such as products of goods, animals, or humans for identification and trace tracking through the use of a device called an RFID tag. The adoption of RFID offers an unprecedented display of assets and inventory across the entire supply chain. This can lead to significant changes in several industries, such as manufacturing, retail, distribution, and transportation (Hao et al., Citation2018; Sayyadi & Awasthi, Citation2018; Tsao, Citation2015). RFID discussions currently focus on the technical and management aspects of RFID implementation (Waters, Citation2013).
However, research shows an imbalance of research that supports aspects of technology (Rundh, Citation2008) explicitly. A recent literature review on RFID found a comprehensive source of information about RFID adoption technical aspects. Still, it lacked RFID adoption in the context of the supply chain (Waters, Citation2013). The use of RFID will be necessary for these companies (Vijayaraman & Osyk, Citation2006). Research on the use of RFID as one of the variables that influence the ease of tracking goods in humanitarian logistics is still not much done.
3. Research method
3.1. Methodology
This study uses a structural model analysis to determine whether all factors are interrelated and affect humanitarian logistics performance. Knowing the relationship of all variables will identify the key driver of the construct. The scores for each latent variable were used in the analysis. Based on this research goal, researchers used the PLS-SEM method as recommended by Joseph F Hair et al. (Citation2019).
The research object is the user of a humanitarian logistics service that has sent natural disaster assistance through a commercial service provider at least once, which is an unknown population in this study. There are several methods to determine a sample when the population is not known with certainty. According to Gay et al. (Citation2011), descriptive research requires a minimum of 10% of a large population or 20% for a smaller community. Whereas for correlation research, a sample of 30 respondents is needed. For experimental and comparative study, an example of 30 respondents is required for each group to be compared. According to Alkahtani (Citation2013), specifically for experimental research and comparatively, the sample is taken from 15–30 participants for each group. According to James and Creiber (Citation2011), all are taken for populations below 100; if the community is 500, then 50 percent is taken. If the population is 5,000, then 375 are taken, and if the population is 100,000, then the total sample is 384. Given the sample size disagreement with the PLS-SEM analysis, a minimum target sample of 10 x the number of variables was created (Dubey et al., Citation2015; Ilyas Masudin et al., Citation2018). So the number of responses was 10 × 5 = 50 respondents.
The method of data collection is done by using a questionnaire on Google Form. Online data collection is conducted due to social interaction restrictions due to the Covid-19 pandemic that started in March 2020. The number of questions asked to respondents was 19. These questions are indicators of all variables used in this study. These indicators were obtained from previous studies conducted by researchers. The questionnaire results will be processed using SPSS software to process data descriptively and Smart-PLS 2.0 software to evaluate the relationship between variables. In this study, a list of questions was asked to respondents with Likert-five scale measurements of attitude intervals, namely strongly agree, agree, neutral, disagree, strongly disagree consecutively with scores of 5, 4, 3, 2, and 1.
3.2. Conceptual model
A conceptual model is a model that will be used to characterize the relation between the variables that have been obtained from previous studies. A conceptual model is also used to identify the indicators which have the most dominant effect on each variable.
From the conceptual model (), several hypotheses are obtained, such as in .:
Figure 1. Conceptual model
Table 1. Research hypotheses
3.3. Operational variable
Operational variables are the aspect to contribute information about the measurement variables in the research study by considering the process that occurs in the variables (Plumier & Maier, Citation2018). Therefore, the researcher can determine the measurement procedures that will be conducted in the research. The measurement variable can be seen in .
Table 2. Measurement variable
4. Results and discussion
4.1. Respondent’s profile
The questionnaires were distributed for six months, starting from March to August 2020. A total of 96 responses were received, more than the minimum sample set previously in the methodology section (50 respondents), so the data is sufficient to represent respondent experiences on traceability in humanitarian logistics performance. The respondent profile analysis results showed that most of the respondents were women, with a total percentage of 61.5% (see ). It shows an average age between 18 and 25 years of old. The majority of the last education is high school, and most types of work are students.
4.2. Descriptive Statistic
This section described each variable indicator’s data as determined by the average value, the standard deviation value, the minimum value, and the maximum value.
The descriptive test described in indicates the respondent’s tendency to assess each variable on average through indicators. The maximum mean value obtained from the blockchain adoption statistics is 4.76, with a standard deviation value of 0.49.
Table 3. Respondent’s profile
Table 4. Descriptive statistical results
4.3. PLS-SEM (Partial Least Square–Structural Equation Modelling)
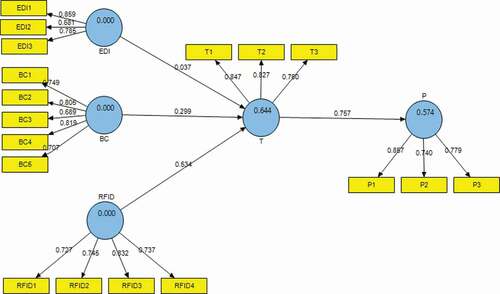
The arrows drawn between the latent variables in the diagram show the hypothesis relationship (see ). The path value of the loading factor, the R-square, and the path coefficient are shown in the chart output.
Figure 2. Information system quality output at humanitarian logistics
4.4. Validity test
The reflective model validity evaluation shall be carried out by calculating the convergent and discriminant variable validity to know the valid absence of indicators in the measurement variables. The validity test included the validity of the loading factor value, the average variance extracted, and the cross-loading values in this analysis. All of these analyses are performed gradually.
4.5. Loading Factor
The validity of the convergence is known throughout the loading factor. An instrument passes the converging validity test when the loading factor is above 0.6. The results of the convergent validity testing are listed in .
Table 5. Recapitulation of the loading factor value
4.6. Average Variance Extracted
Further than can be seen through the loading factor, it also can be known through the Average Variance Extracted (AVE). AVE is a “grand mean value of the squared loading of the indicators associated with the construct” (Hair et al., Citation2016). It can be assumed that the AVE’s value has a similar meaning to the value of the loading factor, where the construct should be equal to or greater than 0.5. It means that the construct can be explained in a variant by 50 percent or more indicators. In addition, the average variant taken less than 0.5 shows the frequency of errors found in the variant describing the construct. The results of the convergent validity testing are listed in .
Table 6. The recapitulation of AVE value
4.7. Cross Loading
Aside from being able to be seen by loading factor and AVE value, validation tests can also be known by cross-loading. The instrument passes the validity test when the latent variable’s cross-loading value with its indicator must be higher than the other indicators. The results of the convergent validity testing are listed in .
Table 7. Value of cross-loading
4.8. Model Fit Measures
The criteria proposed in measuring the fit of the PLS-SEM model are still in the early stages of research, so researchers must be very careful in reporting and using the fit model index (Hair et al., Citation2016). Some of the criteria offered by the SmartPLS software include standardized root mean square residual (SRMR), normed fit index (NFI), and root mean squared residual covariance matrix (RMS_theta).
Standardized Root Mean Square Residual (SRMR) was introduced as a goodness of fit measure for PLS-SEM, which avoids model specification errors (Joe F Hair et al., Citation2014). SRMR is a measure of the mean absolute value of covariance residuals, explaining the difference between the observed correlation and the implied correlation matrix model (expected) as the absolute measure of the fit criterion. The SRMR assessment is when a value less than 0.10 or 0.08 (in more conservative versions) of the model is deemed suitable (Hu & Bentler, Citation1998). This research model’s SRMR value is 0.081, which meets the criteria for accepting the PLS path model fit.
An additional fit measure, the normed fit index (NFI) can be used as the fit measure. The NFI is the value of the chi-square model proposed and divided by the zero model’s chi-square value (Bentler & Bonett, Citation1980). The fit criterion in NFI is that if the value is close to 1, the better the match will be. The NFI value in this research model is 0.923 or 92%, which means that the model’s fit is acceptable.
The RMS_theta suitability measure was used to assess how the outer model residuals were correlated and used only for reflective models. A good correlation must have a value close to zero, which implies that the correlation between the outer model residuals is very small. The RMS_theta value less than 0.12 indicates a fit or fit model, whereas the opposite indicates a lack of conformity (Joe F Hair et al., Citation2014). The RMS_theta value obtained in this study is 0.099, which indicates the right model.
4.9. Reliability Test
Composite reliability is the calculation that can be used to check the reliability of the construction. The test criterion stated that if the composite reliability was higher than 0.7, the construct was reliable. The results of the composite reliability measurement can be seen in the description given in .
Table 8. Recapitulation of model fit
Table 9. Recapitulation of composite reliability value
shows that the composite reliability value of each variable is higher than 0.7. The highest composite reliability is the blockchain adoption metric, 0.8688. Accordingly, all indicators that calculate each variable are reliable based on the composite reliability calculation.
4.10. Structural Model Evaluation
In this study, the evaluation of inner models involves analyzing the coefficient of determination (R-square) and the path. All of these analyses are performed gradually.
4.11. Coefficient of determination (R-square)
The coefficient of determination or R2 value is commonly used for the evaluation of structural models. The coefficient of determination is determined by employing the PLS-algorithm, which explains the exogenous effect of exogenous on endogenous variables.
demonstrated the R-square traceability of the humanitarian logistic variable (T) with a value of 0.6443. It is reported that the quality of the information service is capable of explaining variable T by 64.43 %, and the remaining 35.57 % is another variable contribution that is not discussed in this study.
Table 10. Recapitulation of R-square value
4.12. Path Coefficient
This analysis also uses a coefficient pathway besides using R-square for the evaluation of structural models. The value of the path coefficient is obtained via the bootstrap procedure. The value of the coefficient of the path varies from −1.0 to +1.0. The coefficient path is used to determine the relationship between the latent variables defined by the value’s standard coefficient unit (Hair et al., Citation2016). The value criterion for the line coefficient is 3, i.e., 1) if the value is less than 0,15, it is considered to be weak; 2) the values between 0,15 and 0,45 are deemed to be moderate; and 3) the value of more than 0,45 is considered to be strong (Cohen, Citation1992). The value of the coefficient of the recapitulation path is summarized in .
Table 11. Recapitulation of path coefficient value
4.13. Hypothesis testing
Significance testing is used to determine the effect of exogenous variable control over endogenous variables. Test criteria state that the T-statistics ≥ T-table (Joseph F Hair et al., Citation2008, Citation2016). This study using the 5% significance, so T-table = 1.96; the aim is to learn the significant influence of exogenous variables on endogenous variables. Test results can be found in .
Table 12. Recapitulation of hypothesis testing
The findings of the direct influence test hypotheses can be summarized as follows:
H1: Electronic data interchange adoption has a significant impact on the traceability of humanitarian logistics.
Based on the results of the statistical values generated in , the Electronic Data Interchange (EDI) adoption variable on Humanitarian Logistics Traceability yields a statistical T-value of 0.393, wherein the T-statistic < T-table (1.96). This shows that the Electronic Data Exchange (EDI) information system quality is not significant to the humanitarian logistics traceability. There are several studies conducted on EDI by researchers. Liang et al. (Citation2004) citing EDI use is very helpful in the process of data collection and communication between parties owned. Steve Scala (Citation1993) explains the use of EDI has many advantages and disadvantages. EDI has some benefits, such as increasing the accuracy of the information and reducing errors and data re-input. EDI completes promotions from service providers, increases productivity, reduces paper usage, reduces the number of staff needed, and increases the costs of using related parties, namely customers. However, the drawback is the complexity of using EDI. It can help EDI staff and customers do not have a good understanding of EDI. This is related to the interest of service providers to use EDI. In logistics humanitarian service providers, EDI is not used, so the customers never felt the service using an EDI system.
The reason for the differences in the results of this study with some previous studies is customer experience. According to Srivastava and Kaul (Citation2014), experience affects customer responses about something. Because services using the EDI system have never been run across all service providers, customers respond negatively to the EDI questionnaire. From the interviews conducted with staff of humanitarian logistics service providers, it was explained that all this time was manually inputting data, customers could not check and track relief items that were previously sent. There is also the unavailability of a particular website for humanitarian logistics services as a forum for communication between service providers and customers. During this time, the customer does not get an excellent information system service from the service provider because it is not obtained, causing a lack of customer knowledge about EDI. In the end, humanitarian logistics service customers said that the EDI adoption variable does not affect humanitarian logistics’ traceability.
H2: Blockchain adoption significantly influences humanity logistics traceability
Based on the results of the statistical values generated in , the blockchain adoption variable on traceability of humanitarian logistics produces a statistical T-value of 2.716, where T-statistics > T-table (1.96). This shows that blockchain information systems quality responded positively and significantly influenced the traceability of humanitarian logistics. So the better the blockchain information system, the better the traceability of humanitarian logistics. The results of this study are in accordance with some previous studies. Liu and Li (Citation2020) mention that using blockchain technology can help track an item or product in many companies and service providers. Blockchain could solve many issues regarding data collection and tracking. In the field of food logistics, blockchain technology is needed. This is because the traceability of food ingredients is required and is considered necessary by all parties involved. In particular, traceability from food is essential but not dangerous to detect substances, bacteria, or viruses that endanger health. The Blockchain function in food logistics is to verify the authenticity of food, for example, the origin of the food manufacturing area and the varieties used (Creydt & Fischer, Citation2019).
Blockchain offers a variety of benefits that lead to continuous improvement in supply chain performance. Traceability of an item or product can be easily obtained when using blockchain technology. However, blockchain has many obstacles to get a high benefit: the ability to track. The obstacles are technical, regulatory, infrastructure, and institutional barriers. Another hurdle is enormous computing power and high bandwidth internet connections, which require considerable effort from implementing organizations to get them quickly. Therefore it needs to be updated in blockchain technology every time (Kamble et al., Citation2020).
Additionally, blockchain, combined with other social media, also significantly influences the information and communication system with customers. This is because most humanitarian logistics service customers are at a young age of 18–25 years. Blockchain can be on several social media platforms. Youtube is for conducting information in videos to customers, Instagram for copying photos; there are also Twitter, LinkedIn, and Facebook to inform all customers (Choi et al., Citation2020).
H3: Radio frequency identification (RFID) adoption significantly influences humanitarian logistics traceability
Based on the results of the statistical value generated in , the Radio Frequency Identification (RFID) adoption variable on traceability of humanitarian logistics produces a statistical T-value of 4.429, where T-statistics > T-table (1.96). This shows that RFID information systems’ quality responded positively and significantly influenced the traceability of humanitarian logistics. So the better the RFID information system, the better the traceability of humanitarian logistics.
The results of this study are in accordance with some previous studies. Alfian et al. (Citation2020) explain the current RFID development and track and improve traceability of a product. RFID technology adoption is significantly able to help monitor a product. RFID technology can know the direction of the product, whether the goods have reached the recipient or not, and the quality of the goods in the shipping process. Agree with Alfian et al. (Citation2020), Gautam et al. (Citation2017) explained that RFID technology could support traceability as critical in the supply chain. The use of RFID technology can minimize the risk that a supply chain manager must take in delivering goods and reduce the risk costs.
In the field of industry, the adoption of RFID technology has been widely used. By using RFID, tracking can be done about a product. The use of barcodes in RFID technology is not only able to track the direction of motion in the shipping process, but still, it can track the temperature, humidity, and lighting of a product or item (Bibi et al., Citation2017). By using RFID technology to track the entire process or activity, accurate scheduling can be carried out on each procedure or service activity, especially shipping. Scheduling obtained using RFID technology is agreed to be better than using other technologies or methods (Chongwatpol & Sharda, Citation2013).
H4: Traceability of humanitarian logistics significantly influences humanitarian logistics performance
Based on the results of the statistical values generated in , the traceability of humanitarian logistics variable to humanitarian logistics performance produces a statistical T-value of 15.184, where T-statistics > T-table (1.96). This shows that the Traceability of Humanitarian logistics responded positively and significantly influenced the humanitarian logistics performance. According to respondents, the better the humanitarian logistics information system’s traceability, the better the humanitarian logistics performance.
Several studies are relevant to the results of this study. Hult et al. (Citation2019) explained that service providers who cannot manage information well would not last long. This shows the importance of quality information and quality tracking reporting systems owned by every existing service provider. Souad Souad Djelassia and Stephan (Citation2020) agreed that technology as an information medium is crucial for service providers. This is because of the considerable influence of the right information on customer satisfaction. Effectiveness in system quality, service quality, information quality, and operational efficiency significantly affect customer satisfaction. Some of the above are believed to increase customer satisfaction as an indicator of how well Humanitarian Logistics performance is in line with the improvement of the quality of the information system provided (Santa et al., Citation2019). The process that runs systematically according to the service provider schedule and procedures can make customers feel good about humanitarian logistics services (Duan et al., Citation2018; Usman et al., Citation2019). Compliance with the program and procedures means the service provider can account for what has been promised to the customer. This will trigger feelings of satisfaction from customers. Manuel et al. (Citation2018) states that a fast, systematic, accurate system in every way can increase customer satisfaction. By fulfilling some of the criteria above, service providers can make customers feel satisfied with the quality of the information system they provide.
4.14. Analysis of the effect of indicators on information system quality
In determining the most significant indicator, it can be seen from the loading factor value. The higher the loading factor, the more critical the indicator is.
Electronic Data Interchange (EDI): EDI 1. There must be a communication system between disaster logistics service providers and mature and reliable customers
Blockchain (BC): BC 4. The system must be reliable (must not lose data and be durable)
Radio Frequency Identification (RFID): RFID 3. The data collection process must be in accordance with applicable operational standards.
4.15. Managerial implication
This section consists of the analysis results and managerial implications for the quality of information systems in humanitarian logistics. Managerial implications for developing organizational policies are expected to contribute to management policies. This study asks companies to install information system indicators with each variable’s loading factor value obtained from data processing. The goal is that the information system indicators can be a positive influence on the service provider. Here are the things that researchers recommend for service providers:
1. Created a communication system between service providers and customers of humanitarian logistics services. During this time, the service providers have not made a particular humanitarian logistics information system. Customers cannot have good conversations that provide providers with the relief items they are sending. At the same time, customer experience will affect customers who are among the indicators of humanitarian logistics (Srivastava & Kaul, Citation2014). Therefore, according to Steve Scala (Citation1993), it is necessary to adopt Electronic Data Interchange (EDI), improving good relations between parties related to customers. Associated with the use of EDI in humanitarian logistics service providers can be an option to be applied.
2. Improving the ability of information systems explicitly created for humanitarian logistics continuously. This increase can be obtained from all social media for providing information and communication platforms with customers. The majority of customers are still young people who can at least use one or more social media platforms (Choi et al., Citation2020). So that communication with customers can increase. In addition, the adoption of blockchain technology as an information system for humanitarian logistics service providers can be recommended. This is because blockchain technology, which is a reliable system, could hold a lot of data and store data for a long time. This capability is accompanied by a good tracking ability from blockchain technology that can know the direction of movement of an item or product and track what content is contained in an article (Creydt & Fischer, Citation2019).
3. The adoption of barcode systems for the data collection on humanitarian logistics assistance goods. So far, data collection has been done manually by humanitarian logistics service providers. The use of barcode systems will facilitate data collection (Bibi et al., Citation2017). In addition to simplifying data collection, barcodes in humanitarian logistics information systems can make it easier to track all activities carried out on relief goods sent by customers to natural disaster victims. In the end, the use of barcodes and the benefits of traceability can minimize the risk of lost or not delivered items to the destination to be achieved (Gautam et al., Citation2017).
5. Conclusion
From this study, it can be concluded that there is an influence between the information system quality on traceability in humanitarian logistics. It indicates that traceability has a significant effect on humanitarian logistics performance. Providers of humanitarian logistics services in Indonesia can take satisfaction measurements to determine humanitarian logistics performance. This research has several limitations and needs to be addressed in future studies. First, this study uses customers in Indonesia, especially customers of humanitarian logistics service providers, as respondents; thus, the results may not fully represent humanitarian logistics in other countries. Future research can investigate whether the findings of this study apply to different regions and respondents. Second, future research can use other quality services or other types of logistics as research objects.
Acknowledgements
We thank the Indonesian Higher Education Ministry – Kemdikbud for the WCP-B program 2020 (101.13/E4.3/KU/2020), the Department of Industrial Engineering - the University of Muhammadiyah Malang for the labs facility supports, and the University of Malaysia Sarawak (UNIMAS) for the excellent collaboration.
Additional information
Funding
Notes on contributors
Ilyas Masudin
Ilyas Masudin is the Professor of logistics and supply chain at Industrial Engineering department, University of Muhammadiyah Malang, Indonesia. His research interests include logistics and supply chain (E-mail: [email protected], tel: +62-341464318).
Evan Lau is the Associate Professor and Managing Editor for International Journal of Business and Society in Faculty of Economics and Business, Universiti Malaysia Sarawak (E-mail: [email protected], tel: +6082584368).
Nika Tampi Safitri is a researcher at Industrial Engineering department, University of Muhammadiyah Malang, Indonesia. Her research interest is operations management (E-mail: [email protected], tel: +62-341464318).
Dian Palupi Restuputri is a senior lecturer at Industrial Engineering department at the University of Muhammadiyah Malang. Her research interests are ergonomics and human factor engineering (Email: [email protected], tel: +62-341464318).
Dwi Iryaning Handayani is a lecturer at Industrial Engineering department, University of Panca Marga, Indonesia. Her research interests are supply chain and optimization (E-mail: [email protected], tel: +62-335422715).
References
- Alfian, G., Syafrudin, M., Farooq, U., Ma’arif, M. R., Syaekhoni, M. A., Fitriyani, N. L., & Rhee, J. (2020). Improving efficiency of RFID-based traceability system for perishable food by utilizing IoT sensors and machine learning model. Food Control, 110(1), 107016. https://doi.org/https://doi.org/10.1016/j.foodcont.2019.107016
- Alkahtani, K. D. F. (2013). Teachers’ knowledge and misconceptions of attention deficit/hyperactivity disorder. Psychology, 04(12), 963–21. https://doi.org/https://doi.org/10.4236/psych.2013.412139
- An, M., Lee, C., & Noh, Y. (2010). Risk factors at the travel destination: Their impact on air travel satisfaction and repurchase intention. Service Business, 4(2), 155–166. https://doi.org/https://doi.org/10.1007/s11628-010-0094-2
- Anderson, N. E., Gott, M., & Slark, J. (2018). Grey areas: New Zealand ambulance personnel’s experiences of challenging resuscitation decision-making. International Emergency Nursing, 39(July 2018), 62–67. https://doi.org/https://doi.org/10.1016/j.ienj.2017.08.002
- Asad, M. M., Mohajerani, N. S., & Nourseresh, M. (2016). Prioritizing factors affecting customer satisfaction in the internet banking system based on cause and effect relationships. Procedia Economics and Finance, 36(2016), 210–219. https://doi.org/https://doi.org/10.1016/s2212-5671(16)30032-6
- Bentler, P. M., & Bonett, D. G. (1980). Significance tests and goodness of fit in the analysis of covariance structures. Psychological Bulletin, 88(3), 588. https://doi.org/https://doi.org/10.1037/0033-2909.88.3.588
- Bibi, F., Guillaume, C., Gontard, N., & Sorli, B. (2017). A review: RFID technology having sensing aptitudes for food industry and their contribution to tracking and monitoring of food products. Trends in Food Science & Technology, 62(April 2017), 91–103. https://doi.org/https://doi.org/10.1016/j.tifs.2017.01.013
- BPS. (2019). Rata-rata konsumsi per kapita seminggu beberapa macam bahan makanan penting, 2007-2018.
- Brakeville, S., & Perepa, B. (2018). Blockchain basics: Introduction to distributed ledgers IBM developer: IBM.
- Breckner, M., Englmaier, F., Stowasser, T., & Sunde, U. (2016). Resilience to natural disasters — Insurance penetration, institutions, and disaster types. Economics Letters, 148(2016), 106–110. https://doi.org/https://doi.org/10.1016/j.econlet.2016.09.023
- Casado-Vara, R., González-Briones, A., Prieto, J., & Corchado, J. M. (2018). Smart contract for monitoring and control of logistics activities: Pharmaceutical utilities case study. Paper presented at the The 13th International Conference on Soft Computing Models in Industrial and Environmental Applications. 509–517. San Sebastian - Spain.
- Chen, J.-C., & Williams, B. C. (1998). The impact of electronic data interchange (EDI) on SMEs: Summary of eight British case studies. Journal of Small Business Management, 36(4), 68. https://search.proquest.com/scholarly-journals/impact-data-electronic-interchange-edi-on-smes/docview/220955360/se-2?accountid=201395.
- Chen, M.-C., Chang, K.-C., Hsu, C.-L., & Xiao, J.-H. (2015). Applying a Kansei engineering-based logistics service design approach to developing international express services. International Journal of Physical Distribution & Logistics Management, 45(6), 618–646. https://doi.org/https://doi.org/10.1108/ijpdlm-10-2013-0251
- Chen, M.-C., Chang, K.-C., Hsu, C.-L., & Yang, I.-C. (2011). Understanding the relationship between service convenience and customer satisfaction in home delivery by Kano model. Asia Pacific Journal of Marketing and Logistics, 23(3), 386–410. https://doi.org/https://doi.org/10.1108/13555851111143277
- Choi, T.-M., Guo, S., & Luo, S. (2020). When blockchain meets social-media: Will the result benefit social media analytics for supply chain operations management? Transportation Research Part E, 135(March 2020), 101860. https://doi.org/https://doi.org/10.1016/j.tre.2020.101860
- Chongwatpol, J., & Sharda, R. (2013). RFID-enabled track and traceability in job-shop scheduling environment. European Journal of Operational Research, 227(3), 453–463. https://doi.org/https://doi.org/10.1016/j.ejor.2013.01.009
- Christopher, M., & Towill, D. (2001). An integrated model for the design of agile supply chains. International Journal of Physical Distribution & Logistics Management, 31(4), 235–246. https://doi.org/https://doi.org/10.1108/09600030110394914
- Chung, G., Desrosiers, L., Gupta, M., Sutton, A., Venkatadri, K., Wong, O., & Zugic, G. (2019). Performance tuning and scaling enterprise blockchain applications.
- Cohen, J. (1992). A power primer. Psychological Bulletin, 112(1), 155. https://doi.org/https://doi.org/10.1037/0033-2909.112.1.155
- Creydt, M., & Fischer, M. (2019). Blockchain and more - Algorithm driven food traceability. Food Control, 105(November 2019), 45–51. https://doi.org/https://doi.org/10.1016/j.foodcont.2019.05.019
- Douglas, M., & Lambert, M. C. C. (2000). Issues in supply chain management.
- Drljevic, N., Aranda, D. A., & Stantchev, V. (2020). Perspectives on risks and standards that affect the requirements engineering of blockchain technology. Computer Standards & Interfaces, 69(March 2020), 103409. https://doi.org/https://doi.org/10.1016/j.csi.2019.103409
- Duan, C., Deng, C., Gharaei, A., Wu, J., & Wang, B. (2018). Selective maintenance scheduling under stochastic maintenance quality with multiple maintenance actions. International Journal of Production Research, 56(23), 7160–7178. https://doi.org/https://doi.org/10.1080/00207543.2018.1436789
- Dubey, R., Gunasekaran, A., Sushil,, & Singh, T. (2015). Building theory of sustainable manufacturing using total interpretive structural modelling. International Journal of Systems Science, 2(4), 231–247. https://doi.org/https://doi.org/10.1080/23302674.2015.1025890
- EM-DAT. (2010). Disaster Statistics 1990-May 2010: Centre for research on the epidemiology of disasters (CRED), Université.
- Gautam, R., Singh, A., Karthik, K., Pandey, S., Scrimgeour, F., & Tiwari, M. K. (2017). Traceability using RFID and its formulation for a kiwifruit supply chain. Computers & Industrial Engineering, 103(1), 46–58. https://doi.org/https://doi.org/10.1016/j.cie.2016.09.007
- Gay, L. R., Geoffrey, G. E. M., & Mills, E. (2011). Educational research: Competencies for analysis and applications.
- Gharaei, A., Hoseini Shekarabi, S. A., & Karimi, M. (2020). Modelling and optimal lot-sizing of the replenishments in constrained, multi-product and bi-objective EPQ models with defective products: Generalised cross decomposition. International Journal of Systems Science, 7(3), 262–274. https://doi.org/https://doi.org/10.1080/23302674.2019.1574364
- Gharaei, A., Hoseini Shekarabi, S. A., Karimi, M., Pourjavad, E., & Amjadian, A. (2019). An integrated stochastic EPQ model under quality and green policies: Generalised cross decomposition under the separability approach. International Journal of Systems Science, 7(3), 1–13. https://doi.org/https://doi.org/10.1080/23302674.2019.1656296
- Gharaei, A., Karimi, M., & Hoseini Shekarabi, S. A. (2019). An integrated multi-product, multi-buyer supply chain under penalty, green, and quality control polices and a vendor managed inventory with consignment stock agreement: The outer approximation with equality relaxation and augmented penalty algorithm. Applied Mathematical Modelling, 69(May 2019), 223–254. https://doi.org/https://doi.org/10.1016/j.apm.2018.11.035
- Gharaei, A., Karimi, M., & Hoseini Shekarabi, S. A. (2020). Joint economic lot-sizing in multi-product multi-level integrated supply chains: Generalized benders decomposition. International Journal of Systems Science, 7(4), 309–325. https://doi.org/https://doi.org/10.1080/23302674.2019.1585595
- Giri, B. C., & Bardhan, S. (2014). Coordinating a supply chain with backup supplier through buyback contract under supply disruption and uncertain demand. International Journal of Systems Science, 1(4), 193–204. https://doi.org/https://doi.org/10.1080/23302674.2014.951714
- Giri, B. C., & Masanta, M. (2020). Developing a closed-loop supply chain model with price and quality dependent demand and learning in production in a stochastic environment. International Journal of Systems Science, 7(2), 147–163. https://doi.org/https://doi.org/10.1080/23302674.2018.1542042
- Hair, J. F., Celsi, M., Ortinau, D. J., & Bush, R. P. (2008). Essentials of marketing research. McGraw-Hill/Higher Education.
- Hair, J. F., Henseler, J., Dijkstra, T. K., & Sarstedt, M. (2014). Common beliefs and reality about partial least squares: Comments on Rönkkö and Evermann.
- Hair, J. F., Jr, Hult, G. T. M., Ringle, C., & Sarstedt, M. (2016). A primer on partial least squares structural equation modeling (PLS-SEM). Sage publications.
- Hair, J. F., Risher, J. J., Sarstedt, M., & Ringle, C. M. (2019). When to use and how to report the results of PLS-SEM. European Business Review, 31(1), 2–24. https://doi.org/https://doi.org/10.1108/EBR-11-2018-0203
- Hao, Y., Helo, P., & Shamsuzzoha, A. (2018). Virtual factory system design and implementation: Integrated sustainable manufacturing. International Journal of Systems Science, 5(2), 116–132. https://doi.org/https://doi.org/10.1080/23302674.2016.1242819
- Hoseini Shekarabi, S. A., Gharaei, A., & Karimi, M. (2019). Modelling and optimal lot-sizing of integrated multi-level multi-wholesaler supply chains under the shortage and limited warehouse space: Generalised outer approximation. International Journal of Systems Science, 6(3), 237–257. https://doi.org/https://doi.org/10.1080/23302674.2018.1435835
- Howden, M. (2009). How humanitarian logistics information systems can improve humanitarian supply chains: A view from the field.
- Hu, L. T., & Bentler, P. M. (1998). Fit indices in covariance structure modeling: Sensitivity to underparameterized model misspecification.. Psychological Methods, 3(4), 424. https://doi.org/https://doi.org/10.1037/1082-989X.3.4.424
- Hult, G. T. M., Sharma, P. N., Morgeson, F. V., & Zhang, Y. (2019). Antecedents and consequences of customer satisfaction: Do they differ across online and offline purchases? Journal of Retailing, 95(1), 10–23. https://doi.org/https://doi.org/10.1016/j.jretai.2018.10.003
- James, B., & Creiber, K. A.-S. (2011). Educational research.
- Juga, J., Juntunen, J., & Grant, D. B. (2010). Service quality and its relation to satisfaction and loyalty in logistics outsourcing relationships. Managing Service Quality, 20(6), 496–510. https://doi.org/https://doi.org/10.1108/09604521011092857
- Kamble, S. S., Gunasekaran, A., & Sharma, R. (2020). Modeling the blockchain enabled traceability in agriculture supply chain. International Journal of Information Management, 52(June 2020), 101967. https://doi.org/https://doi.org/10.1016/j.ijinfomgt.2019.05.023
- Kazemi, N., Abdul-Rashid, S. H., Ghazilla, R. A. R., Shekarian, E., & Zanoni, S. (2018). Economic order quantity models for items with imperfect quality and emission considerations. International Journal of Systems Science, 5(2), 99–115. https://doi.org/https://doi.org/10.1080/23302674.2016.1240254
- Kim, K., & Kang, T. (2017). Does technology against corruption always lead to benefit? The potential risks and challenges of the blockchain technology. Paper presented at the Paper submitted to OECD’s Anti-Corruption and Integrity Forum. Paris-France. https://www.oecd.org/cleangovbiz/Integrity-Forum-2017-Kim-Kang-blockchain-technology.pdf
- Li, X., Chung, C., Goldsby, T. J., & Holsapple, C. W. (2008). A unified model of supply chain agility: The work-design perspective. The International Journal of Logistics Management, 19(3), 408–435. https://doi.org/https://doi.org/10.1108/09574090810919224
- Liang, H., Xue, Y., Byrd, T. A., & Rainer, R. K. (2004). Electronic data interchange usage in China’s healthcare organizations: The case of Beijing’s hospitals. International Journal of Information Management, 24(6), 507–522. https://doi.org/https://doi.org/10.1016/j.ijinfomgt.2004.08.001
- Liu, Z., & Li, Z. (2020). A blockchain-based framework of cross-border e-commerce supply chain. International Journal of Information Management, 52(June 2020), 102059. https://doi.org/https://doi.org/10.1016/j.ijinfomgt.2019.102059
- Maiers, C., Reynolds, M., & Haselkorn, M. (2005). Challenges to effective information and communication systems in humanitarian relief organizations. Paper presented at the IPCC 2005. Proceedings International Professional Communication Conference, 2005. Lamerick-Ireland.
- Manuel, J., Sánchez-Franco, A. N.-G., & Francisco Javier, R.-C. (2018). A naive bayes strategy for classifying customer satisfaction: A study based on online reviews of hospitality services. Journal of Business Research, 101(August 2018), 499–506. https://doi.org/https://doi.org/10.1016/j.jbusres.2018.12.051
- Masudin, I., & Fernanda, F. W. (2019). A review of literature on types, stages of recovery and humanitarian logistics operations in the tsunami and earthquake disaster in Indonesia. IOP Conference Series: Materials Science and Engineering, 674(2019), 012043. https://doi.org/https://doi.org/10.1088/1757-899x/674/1/012043
- Masudin, I., Safitri, N. T., Restuputri, D. P., Wardana, R. W., & Amallynda, I. (2020). The effect of humanitarian logistics service quality to customer loyalty using Kansei engineering: Evidence from Indonesian logistics service providers. Cogent Business & Management, 7(1), 1826718. https://doi.org/https://doi.org/10.1080/23311975.2020.1826718
- Masudin, I., Wastono, T., Zulfikarijah, F., & Liu, S. (2018). The effect of managerial intention and initiative on green supply chain management adoption in Indonesian manufacturing performance. Cogent Business & Management, 5(1), 1485212. https://doi.org/https://doi.org/10.1080/23311975.2018.1485212
- Murphy, P. R., & Daley, J. M. (1996). International freight forwarder perspectives on electronic data interchange and information management issues. Journal of Business Logistics, 17(1), 63. https://search.proquest.com/openview/87881b820a4846cccbb45c92681b8d02/1?pq-origsite=gscholar&cbl=36584
- Nagurney, A., Salarpour, M., & Daniele, P. (2019). An integrated financial and logistical game theory model for humanitarian organizations with purchasing costs, multiple freight service providers, and budget, capacity, and demand constraints. International Journal of Production Economics, 212(June 2019), 212–226. https://doi.org/https://doi.org/10.1016/j.ijpe.2019.02.006
- Plumier, B. M., & Maier, D. E. (2018). Sensitivity analysis of a fumigant movement and loss model for bulk stored grain to predict effects of environmental conditions and operational variables on fumigation efficacy. Journal of Stored Products Research, 78(September 2018), 18–26. https://doi.org/https://doi.org/10.1016/j.jspr.2018.05.012
- Rabbani, M., Foroozesh, N., Mousavi, S. M., & Farrokhi-Asl, H. (2019). Sustainable supplier selection by a new decision model based on interval-valued fuzzy sets and possibilistic statistical reference point systems under uncertainty. International Journal of Systems Science, 6(2), 162–178. https://doi.org/https://doi.org/10.1080/23302674.2017.1376232
- Rebecca Angelesa, C. L. C., Suvojit Choton, B., & Nath, R. (2001). Success factors for domestic and international electronic data interchange (Edi) implementation for Us firms.
- Restuputri, D. P., Masudin, I., & Sari, C. P. (2020). Customers perception on logistics service quality using Kansei engineering: Empirical evidence from indonesian logistics providers. Cogent Business & Management, 7(1), 1751021. https://doi.org/https://doi.org/10.1080/23311975.2020.1751021
- Rundh, B. (2008). Radio frequency identification (RFID)-Invaluable technology or a new obstacle in the marketing process. Marketing Intelligence and Planning, 26(1), 97–114. https://doi.org/https://doi.org/10.1108/02634500810847174
- Safaei, A. S., Farsad, S., & Paydar, M. M. (2018). Robust bi-level optimization of relief logistics operations. Applied Mathematical Modelling, 56(April 2018), 359–380. https://doi.org/https://doi.org/10.1016/j.apm.2017.12.003
- Santa, R., MacDonald, J. B., & Ferrer, M. (2019). The role of trust in e-Government effectiveness, operational effectiveness and user satisfaction: Lessons from Saudi Arabia in e-G2B. Government Information Quarterly, 36(1), 39–50. https://doi.org/https://doi.org/10.1016/j.giq.2018.10.007
- Sarkar, S., & Giri, B. C. (2020). Stochastic supply chain model with imperfect production and controllable defective rate. International Journal of Systems Science, 7(2), 133–146. https://doi.org/https://doi.org/10.1080/23302674.2018.1536231
- Sayyadi, R., & Awasthi, A. (2018). A simulation-based optimisation approach for identifying key determinants for sustainable transportation planning. International Journal of Systems Science, 5(2), 161–174. https://doi.org/https://doi.org/10.1080/23302674.2016.1244301
- Sayyadi, R., & Awasthi, A. (2020). An integrated approach based on system dynamics and ANP for evaluating sustainable transportation policies. International Journal of Systems Science, 7(2), 182–191. https://doi.org/https://doi.org/10.1080/23302674.2018.1554168
- Shah, N. H., Chaudhari, U., & Cárdenas-Barrón, L. E. (2020). Integrating credit and replenishment policies for deteriorating items under quadratic demand in a three echelon supply chain. International Journal of Systems Science, 7(1), 34–45. https://doi.org/https://doi.org/10.1080/23302674.2018.1487606
- Silva, L. D. O., Bandeira, R. A. D. M., & Campos, V. B. G. (2019). Proposal to planning facility location using UAV and geographic information systems in a post-disaster scenario. International Journal of Disaster Risk Reduction, 36(May 2019), 101080. https://doi.org/https://doi.org/10.1016/j.ijdrr.2019.101080
- Souad Djelassia, M. F. D., & Stephan, Z. (2020). How self-service technology experience evaluation affects waiting time and customer satisfaction? A moderated mediation model. Decision Support Systems, 111(July 2018). https://doi.org/https://doi.org/10.1016/j.dss.2018.04.004
- Srivastava, M., & Kaul, D. (2014). Social interaction, convenience and customer satisfaction: The mediating effect of customer experience. Journal of Retailing and Consumer Services, 21(6), 1028–1037. https://doi.org/https://doi.org/10.1016/j.jretconser.2014.04.007
- Steve Scala, R. M., Jr. (1993). Advantages and disadvantages of electronic data interchange an industry perspective
- Tomasini, R., Van Wassenhove, L., & Van Wassenhove, L. (2009). Humanitarian logistics. Springer.
- Tsao, Y.-C. (2015). Design of a carbon-efficient supply-chain network under trade credits. International Journal of Systems Science, 2(3), 177–186. https://doi.org/https://doi.org/10.1080/23302674.2015.1024187
- Usman, M., Shafiq, M., Savino, M., Rashid, Z., Yehya, M. I., Naqvi, A. A., … Menanno, M. (2019). Investigating the role of QMS implementation on customers’ satisfaction: A case study of SMEs. IFAC-PapersOnLine, 52(13), 2032–2037. https://doi.org/https://doi.org/10.1016/j.ifacol.2019.11.504
- Vega, D., Britta Gammelgaard, P. G. D., & Roussat, C. (2015). Humanitarian logistics: The role of logistics service providers. International Journal of Physical Distribution & Logistics Management, 45(4), 352–375. https://doi.org/https://doi.org/10.1108/ijpdlm-12-2014-0309
- Vijayaraman, B., & Osyk, B. A. (2006). An empirical study of RFID implementation in the warehousing industry. The International Journal of Logistics Management, 17(1), 6–20. https://doi.org/https://doi.org/10.1108/09574090610663400
- Waters, S. R. L. Y. S. (2013). Factors affecting RFID adoption in Chinese manufacturing firms: An investigation using AHP.
- Yin, S., Nishi, T., & Zhang, G. (2016). A game theoretic model for coordination of single manufacturer and multiple suppliers with quality variations under uncertain demands. International Journal of Systems Science, 3(2), 79–91. https://doi.org/https://doi.org/10.1080/23302674.2015.1050079
- Zhang, L., Tian, J., Fung, R. Y. K., & Dang, C. (2019). Materials procurement and reserves policies for humanitarian logistics with recycling and replenishment mechanisms. Computers & Industrial Engineering, 127(January 2019), 709–721. https://doi.org/https://doi.org/10.1016/j.cie.2018.11.013