
Abstract
The current study aims to evaluate the impact of working capital components on the financial performance of Indian pharmaceutical companies. Moreover, it aims to analyze working capital among small, medium and large firms. The study uses a panel data of 82 pharmaceutical companies for the period from 2008 to 2017. Generalized Method of Moment (GMM) model is used for estimating the results. Findings show that there is a significant difference in managing working capital among small, medium and large firms. Furthermore, it is found that number of days’ collection period, number of days’ payable period and number of days’ inventory holding period positively impact the financial performance of Indian pharmaceutical companies measured by return on assets and net operating margin. Whereas, cash conversion cycle has a negative impact on return on assets, net operating margin and Tobin’s Q.
PUBLIC INTEREST STATEMENT
Working capital management is considered as one of the crucial areas of financial management, because Working capital is the lifeblood and nerve centre of every business unit. As blood circulation is essential for human to keep alive, working capital is necessary for a business unit to run its operations smoothly and successfully. Working capital is needed for purchasing raw materials, paying wages and salaries, incurring day-to-day expenses, providing credit facilities to customers, and maintaining the inventories of raw material, work in progress, spares and finished stock. An adequate amount of working capital ensures maintaining the solvency of the business, increasing business’ goodwill, getting easy loans, getting cash discounts, regular supply of raw materials, regular payment of salaries, ability to face crises, etc. Further, efficient working capital management enables firms to react quickly and appropriately to unexpected market changes.
1. Introduction
Working Capital Management (WCM) is considered to be one of the most important areas of financial management which has attracted the attention of financial managers, academicians and researchers to investigate its impact on firm’s performance (e.g., Abuzayed, Citation2012; Deloof, Citation2003; Raheman et al., Citation2010; Raheman & Nasr, Citation2007; Ukaegbu, Citation2014; Vural et al., Citation2012). WCM is essential to all companies operating in developed and developing countries. Efficient working capital management enables firms to react quickly and appropriately to unexpected market changes. The critical task of working capital management is maintaining adequate liquidity to guarantee the smooth function of a business unit. It is reported that one of the things that hinders a company from good profit is liquidity constrains (Afrifa, Citation2013). On the other hand, a high level of liquidity may also negatively affect firms’ profitability (Baek, Citation2006). Thus, firms are advised to invest more in current assets more than investing in fixed assets for maintaining adequate liquidity.
Recently, the research on WCM has been increased; especially, after the financial crisis that took place in 2007/2008 (Pirttilä, Citation2014). Furthermore, Viskari et al. (Citation2011) argue that research on WCM is segmented and have been studied widely. However, Preve and Sarria-Allende (Citation2010) and Sagner (Citation2014) believe that working capital have been intensively taught in schools and discussed in many books, studies on WCM that used robust statistical tests such as Generalized Method of Moments (GMM) are few, especially in India; because most of reviewed studies that were carried out in Indian pharmaceutical industry (e.g., Bhunia & Das, Citation2015; Jain, Citation2014; Kavitha & Shanmugam, Citation2015; Mehra, Citation2013; Pandey et al., Citation2016; Vijayalakshmi & Srividya, Citation2015; Viswanathan et al., Citation2016), used either descriptive statistics, Pearson correlation or least square regression models. Further, by looking to the reviewed studies that were conducted in the Indian pharmaceutical industry, it was found that none of the studies followed scientific sampling process to get robust results to be generalized to the industry. Moreover, the market leadership in pharmaceutical industry is based on new product development rather product innovation. That is what motivated the researchers to conduct this study in an emerging market; India. Hence, this study is going to contribute to the literature by using robust statistical tests and scientific methodology.
Indian pharmaceutical industry is ranked the third in the world and is known as the fastest growing drug market all around the world, but the domestic markets’ performance in pharmaceutical industry experienced a decline in the financial year 2016–17 as a result of the government efforts in making medicines affordable and accessed by most of the population in India. The industry showed poor sales performance during two successive quarters ended in September 2016, after that the industry reported grow in sales performance by only 2.9% in December 2016 quarter. Historically, the industry had experienced poorer working-capital performance as compared to other industries. Therefore, this paper seeks firstly, to explore the differences in WCM among small, medium and large pharmaceutical firms, secondly, to examine the influence of WCM on firms performance in a different context; India. The business environment in India is somewhat different from that of other countries around the globe. WCM in Indian pharmaceutical contexts sounds an interesting one to investigate. The study will provide a rich context to interpret the results. Indeed, the paper has a potential contribution to research, especially in the field of working capital. The study uses generalized method of moment for running the analysis. Two accounting-based measures namely: ROA and Net Operating Margin (NOM), and one marketing based measure Tobin’s Q are taken as measures for firms’ performance. Number of days’ collection period, number of days’ payables period, number of days inventory-holding period and cash conversion cycle are the independent variables while, Leverage and firms’ size are used as controlling variables. The rest of this paper is organized as follows: section 2 illustrates previous literature. Section 3 provides a brief overview of the pharmaceutical industry. Section 4 demonstrates research design. Section 5 analyses and discusses the findings. Section 6 briefly concludes the study.
2. Literature review
Traditionally, studies on a long-term financial management were overwhelming and dominating the empirical and theoretical literature of corporate finance. Singh and Kumar (Citation2014) believe that the development in the existing literature of WCM is limited. Further, the focus of researchers has been shifted either towards the determinants of working capital or long-term corporate finance (e.g., Chiou et al., Citation2006; Mansoori & Muhammad, Citation2012; Narender et al., Citation2008; Nazir & Afza, Citation2009). Nevertheless, there are few studies in working capital field concern about firms’ liquidity and profitability (e.g., Abuzayed, Citation2012; Deloof, Citation2003; Gill & Obradovich, Citation2012; Lazaridis & Tryfonidis, Citation2006; Padachi, Citation2006). Moreover, the majority of research that identified WCM and its efficiency were carried out in developed countries, e.g., United States and Australia, while the literature related to developing economies is scant. India is classified by the World Bank as one of the Asian low middle income country (Somvanshi, Citation2016). Furthermore, a deeper understanding of working capital’s historical perspectives will make sense of its practices today and likely in future directions. These are some of the motivations that encourage the researchers to conduct this study in an emerging market; India. The body of this section is extensively focusing on the results, variables, and the statistical techniques which were used by previous researchers in the field of working capital in order to find what has been done and what is left to be done.
Various studies (e.g., Ajibolade & Sankay, Citation2013; Kazimoto, Citation2016; Nyamao et al., Citation2012; Taani, Citation2012; Uchenna et al., Citation2012; Wire, Citation2015) found a positive association between WCM variables and firm’s performance. However, Nyamao et al. (Citation2012) conducted a survey using a stratified random sampling technique. The questionnaire was distributed to 72 trading and 41 manufacturing enterprises. Firm’s performance was measured in terms of growth in sales, growth in profit, growth in total assets, and growth in the market, whereas cash management, receivables management, and inventory management were used as proxy variables for working capital. It was concluded that 63.4% of the variations in firm’s performance could be explained by the changes in the efficiency of working capital components. In the same year, Taani (Citation2012) took a sample of 45 companies listed on Amman Stock Exchange to investigate the impact of WCM policy on firm’s performance measured by net income, Return on Equity (ROE) and ROA. Results show that the WCM policy has a significant relation with net income and an insignificant relation with ROE and ROA. Consistently, Uchenna et al. (Citation2012) applied a cross-sectional time-series data for four world-leading beer brewery firms to find out the impact of working capital measured by cash conversion cycle, current ratio, sales growth and debt ratio on firm’s profitability. The findings showed that there was a positive relation between world leading firms’ profitability and its cash conversion cycle and sales growth rate. Researchers argued that sales growth rate and cash conversion cycle could be used effectively as determinants of the sector’s profitability
On the other hand, other studies, (e.g., Afrifa, Citation2016; Ahmadpour et al., Citation2012; Ahmed et al., Citation2016; Ajao & Adebayo, Citation2010; Alipour, Citation2011; Almazari, Citation2013; Lyngstadaas & Berg, Citation2016; Deloof, Citation2003; Karaduman et al., Citation2010; Lazaridis & Tryfonidis, Citation2006; Makau et al., Citation2014; Singhania & Mehta, Citation2017; Nazir & Afza, Citation2014; Oladipupo & Okafor, Citation2013; Pas & Gama, Citation2015; Raheman et al., Citation2010; Raheman & Nasr, Citation2007; Şamiloğlu & Akgün, Citation2010; Sen & Oruç, Citation2009; Tran et al., Citation2017; Vahid et al., Citation2012; Vural et al., Citation2012) demonstrated a negative correlation between WCM variables and firm’s performance. Interestingly, not all studies used the same methodology; various methods, statistical techniques, along with a variety of variables were used for measuring the impact of WCM on firms’ performance.
Empirical studies, (e.g., Garcia-Teruel & Martınez-Solano, Citation2007; Karaduman et al., Citation2010; Pais & Gama, Citation2015) investigated the impact of WCM on firm’ performance using ROA as a measure of firms performance and Average Collection Period (ACP), inventory conversion period (ICP), average payment period (APP) and Cash Conversion Cycle (CCC) as measures of WCM. It was concluded that WCM has a negative impact on the firm’s profitability. In the same way of conducting and analyzing data, Sen and Oruç (Citation2009) used the same variables for measuring WCM in addition to the current ratio and networking capital ratio to find out the relationship between the efficiency level of WCM and ROA. The results of the study after adding these variables were consistent with previous ones showing a negative relationship between ROA as a measure of firms’ performance and WCM. Similarly, Makau et al. (Citation2014) measured the performance through ROA and WCM by average collection period, and the findings demonstrated that there was a negative effect of average collection period on firm’s performance of Kenyan firms.
Consistently, other researchers (e.g., Ajao & Adebayo, Citation2010; Alipour, Citation2011; Almazari, Citation2013; Deloof, Citation2003; Lazaridis & Tryfonidis, Citation2006; Tran et al., Citation2017) took average collection period, inventory conversion period, average payables period and cash conversion cycle as proxy variables for measuring WCM, but for measuring firms’ performance (profitability) they used gross operating income. The study findings underlined the existence of the negative relationship between WCM and firms’ performance. Furthermore, studies such as Aggarwal and Chaudhary (Citation2015); Haresh (Citation2012), Mahato and Jagannathan (Citation2016), Ray (Citation2012), Sharma and Kumar (Citation2011), and Singhania et al. (Citation2014) measured WCM by inventory conversion period, average collection period, average payment period and cash conversion cycle. Firm’s profitability was measured by ROA, gross operating profit, and net operating profit. The findings affirmed that components of working capital have a different association with firm’s performance positively and negatively. Consistent with these studies, Yadav and Sb (Citation2014) used the same variables plus net trading cycle to measure WCM and its impact on ROA of 10 Indian steel manufacturing companies.
Because of different business environment and firms’ characteristics, working capital would be different in different countries; this is the reason behind the conflicting results of previous studies. For instance, the financing cost in India seems to be higher and capital is less available in comparison to the developed countries, which caused difficulty for Indian firms to finance their working capital requirements. Furthermore, Indian accounting practices are somewhat different and have smaller manufacturing firms base as well as few multinational companies. All these factors might have caused some companies to have different WCM approaches. In fact, Indian companies are different from that in the world in terms of working capital efficiency, comparative technologies and regulatory practices.
Few studies evaluated working capital in Indian pharmaceutical industry (e.g., Bhunia & Das, Citation2015; Jain, Citation2014; Kavitha & Shanmugam, Citation2015; Mehra, Citation2013; Pandey et al., Citation2016; Vijayalakshmi & Srividya, Citation2015; Viswanathan et al., Citation2016), all these studies used different proxy variables for measuring working capital and its impact on Indian firms’ performance. It is worth mentioning that these studies have some major limitations e.g., these studies were either case studies or confined to top 10 companies (e.g., Joshi & Ghosh, Citation2012; Vijayalakshmi & Srividya, Citation2015; Viswanathan et al., Citation2016). Further, they did not adopt a good methodology or implement robust statistical tests. Furthermore, lack of studies that cover a large sample motivated the researcher to take a large sample (82 companies with 820-year observations) which is enough for making generalisation. Therefore, this paper seeks to contribute to the existing literature by evaluating the impact of working capital on firms’ performance in a different context; India. The business environment in India is somewhat different from that of other countries around the globe. Therefore, working capital in Indian context sounds an interesting to estimate. Hence, the study tries to provide a rich context to interpret the results. Indeed, the paper has a potential contribution to research, especially in the Indian pharmaceutical industry.
3. Overview about pharmaceutical industry
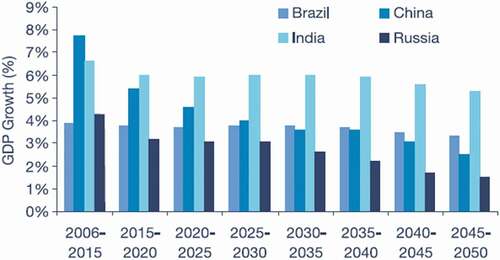
The Indian pharmaceutical market is the fastest-growing market in the world. It sets itself as a worldwide manufacturing and research Centre. India has a massive number of scientists and engineers who can boost the industry to a very high and competent level. Indian pharmaceutical industry is listed the first among other science-based industries with huge abilities in drug manufacturing and technology. It is well known for being an organised sector (Padiya, Citation2015). shows that the Indian pharmaceutical sector is expected to grow by at least 50% a year for the next 32 years, which shows a robust growth over long term.
Figure 1. Forecasted growth of Indian pharmaceutical sector in comparison to some other big pharmaceutical sectors worldwide (source: BRICs and Beyond, Goldman Sachs, November 2007)
The industry is estimated to be worth US 4.5 USD billion, with annual growth between 8% and 9%. In terms of range of medicines manufactured and technology used, the industry ranks third in the world. The industry meets approximately 70% of the country’s demand for drug intermediates, bulk drugs, pharmaceutical formulations, capsules, oral tablets and chemicals.
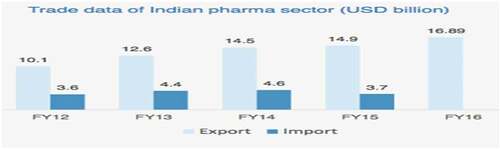
The industry produces around 10% of global production (Geethalakshmi & Jothi, Citation2016; Pandey et al., Citation2016). shows that Indian pharmaceutical companies exported medicine for US 16.89 USD Billion. This number is expected to reach US 40 USD Billion by 2020.
Figure 2. Trade data of Indian pharmaceutical sector (source: department of commerce India, department of pharmaceuticals, Indian business news, MI Techsci Research
More than 20,000 units which are registered and working in the pharmaceutical sector, out of them, approximately 250 units are large and control 70 percent of the market (Geethalakshmi & Jothi, Citation2016; Vijayalakshmi & Srividya, Citation2015). The annual turnover of pharmaceutical industry during the financial year 2015–16 is 185,388 crores. This figure represented a decrease of 7.4% over the figure of the financial year 2014–15 (Department of Pharmaceuticals, Citation2017). It is expected that Indian pharmaceutical sector is going to achieve compound annual growth of 23.9% by the year 2020 (Padiya, Citation2015). However, the domestic market of pharmaceutical witnessed a decline in the financial year 2016–17, that is attributed to the efforts of the government in making medicines affordable and accessed by all people. It is noticed that pharmaceutical industry is a sector that will keep observing a high growth opportunity in the next future.
4. Research methodology
This study relied on secondary data that are extracted from Prowess IQ database. The financial data covered 10 years from 2008 to 2017. However, marketing-based measures seem to be more suitable than accounting-based measures, they are affected by several uncontrollable factors (Gani & Jermias, Citation2006). Hutchinson and Gul (Citation2004) believe that for reflecting the results of management actions accounting-based measures are preferable to market-based measures for evaluating the impact of WCM on firms’ performance. Therefore, two accounting-based measures namely: ROA, NOM and one marketing-based measure Tobin’s Q are used for measuring firms’ performance. WCM is measured by four proxies: number of days’ collection period, number of days’ payable period, number of days’ inventory holding period and cash conversion cycle. in the appendix shows the study variables’ name, symbols, formula and their use in the previous literature.
In order to check if working capital among small, medium and large groups is managed differently or not and if this difference is statistically significant or not, Kruskal-wallis test was run. Kruskal-wallis test is a non-parametric test which is the alternative test to the parametric test one way ANOVA. The reason behind running the non-parametric test (Kruskal-wallis) is that it does not assume the normal distribution of the data. If the data are normally distributed, the parametric test (one way ANOVA) would be appropriate to be run (Davis & Pecar, Citation2010). For the purpose of running this test, the sample was divided based on their size into three categories: small, medium and large firms. First category (small firms) consists of 27 firms whose total assets is less than 1323.485 RS million, the second category (medium firms) consists of 28 firms whose total assets lie between 1323.485 RS million and 13,749.426 RS million and the third category (large firms) consists of 27 firms whose total assets lie between 13,749.426 RS million and 353,920.8 RS million. Usually, large firms tend to have more assets than medium and small firms do. Further, larger firms generally have stable cash follow (Barclay et al., Citation2003). Kim (Citation2016) argues that older and larger firms have the advantage over small firms as they can expand their accounts payable level.
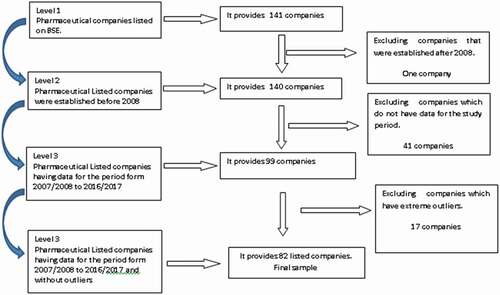
The target population of the study consisted of 141 companies which are listed on Bombay Stock Exchange (BSE). To ensure that the sample is ideal, the study set the following criteria for any company to be included in the study sample:
The establishment of the company must be before 2008.
The company’s data must be during March 2008 to March 2017.
The company must not have any extreme outliers.
Therefore, one company was excluded because its establishment was after the financial year 2008. Forty-one companies did not have data for the study period from March 2008 to March 2017 were discarded to maintain balanced structured panel. Seventeen companies were eliminated from the sample due to the existing of extreme outliers that would affect the results obtained from regression model. Thus, the final sample consists of 82 companies that met the above criterion. illustrates the process of sample selection
Figure 3. Sample selection process
To examine the impact WCM on firm’s performance, 12 regression models are designed as follows:
Where:
(ROA) it = Stands for financial performance of company I, at time t, measured by return on assets
(NOM) it = Stands for financial performance of company I, at time t, measured by net operating margin
(TQ) it = Stands for financial performance of company I, at time t, measured by Tobin’s Q, (NCP) it = Number of days’ collection period of company I, at time t. (NPP) it = Number of days’ deferral period. (NIHP) it = Number of days’ inventory-holding period
(CCC) it = Cash conversion cycle. (SIZ) it = Size of company i at time t. (LEV) it = Leverage of company i at time t. (α) = Common y-intercept. (β1-β3) = coefficients of the explanatory variables (ε) it = Stochastic error term of company i at time
5. Findings and discussion
5.1. Descriptive analysis
ROA, NOM, and Tobin’s Q are used for measuring the financial performance of Indian pharmaceutical firms. It is clear from that the mean values of whole sample for performance measures are 6.10, 14.68 and 1.52 with standard deviation of 9.15, 9.62 and 1.99 for ROA, NOM and Tobin’s Q, respectively. This indicates that the majority of listed pharmaceutical companies are profitable. reveals that small and medium firms are less profitable in comparison to large firms, the mean values of their financial performance measures are 6.775, 15.466 and 1.936, respectively.
Table 1. Descriptive statistics
Number of days’ collection period (NCP) are used for evaluating the collection policy of Pharmaceutical companies, results show that pharmaceutical companies receive the payment of their credit sales from customers after 100.90 days on average. shows that small firms wait 102.814 days to receive their money from customers, medium firms hold on 100.281 days and large firms wait 99.638 days, which means that smaller firms wait longer than larger firms do. In general, pharmaceutical firms have good collection policy as they release the cash from sales earlier possible.
The average number of days’ payable period is 86.52, which means that pharmaceutical companies delay the payments to their credit purchases 86.52 days. The minimum and maximum numbers of days’ payable period are 462 and 7.42, respectively. Pharmaceutical companies (small, medium and large) take on average 3 months to pay back their suppliers, which is quite similar to the period of collecting money from customers. In comparison to other sectors e.g., telecom sector which wait 142 days to collect the payments of their credit sales from customers and delay the payments to their credit purchases 21 days (Mahato & Jagannathan, Citation2016), pharmaceutical companies are following a strict credit policy, and they are efficient in collecting their money from customs.
Number of days inventory-holding period is used as a measure for inventory policy, the mean of inventory-holding period is 32.24. Small firms take 26.73 days to turnover their inventory, medium firms take 33.826 days and large firms take 36.735 days to turnover their inventory, this means that larger firms are reputable and have good relation with suppliers to finance their inventory, so they store their drugs for longer period than smaller firms do. These results indicate that pharmaceutical companies take almost 1 month to turnover their inventory. This result is consistent with Afrifa (Citation2013) who found that firms take approximately 1 month to sell out their inventory. The minimum and maximum days that are needed by companies to turn over the inventory ranges between 1 and 205, which is closer to the result found by (Mahato & Jagannathan, Citation2016). It can be said that pharmaceutical companies process and sell their finished goods straightaway.
Cash conversion cycle minimum and maximum values of pharmaceutical firms range between −305.70 and 424.10 days with a mean of 17.66 days; these results are far from that obtained by Sharma and Kumar (Citation2011), Mahato & Jagannathan (Citation2016) and Ray (Citation2012). Small pharmaceutical firms need 9.505 days to convert their cash in to purchases, inventory and then in to sales, while medium firms need 20.279 days and large firms need 23.108 days. This means that smaller firms take less time to convert their cash in to purchases, inventory and then in to sales, that is because they could not maintain good relations with suppliers or get loans for financing their inventory. Overall, the sector is successful in maintaining cash conversion cycle is short enough in order to enhance their performance.
Firms’ size is measured by the log of total assets. The average of log total assets is 8.26, and the minimum and maximum values range between 3.68 and 12.87 with a standard deviation of 1.86. The standard deviation shows a small variation in the size of the pharmaceutical companies listed on BSE. The mean of leverage ratio for pharmaceutical companies is 1.94%, the minimum and maximum leverage values range from 0.00 to 104.60 with a standard deviation of 9.36. The standard deviation is large which indicates the large variation in the financial leverage of pharmaceutical companies; this illustrates that the majority of pharmaceutical companies do not use debt for financing their business. This is understandable as all pharmaceutical companies in the sample are listed on BSE, which allows firms to go for unlimited access to equity capital. The leverage of small, medium and large pharmaceutical firms is 2.091, 1.812 and 1.910, respectively.
5.2. Kruskal-wallis (one-way ANOVA)
The Kruskal-Wallis test is a non- parametric test which is the alternative test of one way ANOVA. For running this statistical test, the sample was divided into three categories based on their size; small, medium and large firms.
shows that there is a significant difference between ROA, NOM and Tobin’s Q of small, medium and large firms, the difference is significant at 0.05. In terms of ROA the difference is between small and large firms, exhibits the differences among the three groups; small, medium and large firms. This difference refers to variation of their market share, working capital, types of activities and products. Regarding NOM, the difference lies between small and medium firms, small and large firms; while in terms of Tobin’s Q, the difference lies between small and large firms, large and medium firms. Further, reveals that there is a significant difference between number of days inventory-holding period and cash conversion cycle of small, medium and large firms, the difference is significant at 0.05, which means that small, medium and large firms manage their number of day’s inventory-holding period and cash conversion cycle differently from each other. exhibits the differences among the three groups. In terms of number of day’s inventory-holding period the difference lies between small and medium, small and large firms, whereas, in terms of CCC the difference lies between small and large firms. This difference is due to the good credit policy or efficient management of inventory by large firms.
Figure 4. Multiple comparison between groups
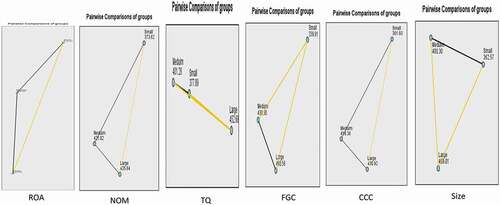
Table 2. Kruskal-wallis (one-way ANOVA)
5.3. Correlation
Results in show a negative association between the number of day’s collection period, ROA, NOM and Tobin’s Q. This result is statistically significant at 0.001. This means that when number of days’ collection period increases, the profitability of pharmaceutical firms decreases. This result coincides with previous research work in the field of WCM (e.g., Lyngstadaas & Berg, Citation2016; Garcia-Teruel & Martınez-Solano, Citation2007; Padachi, Citation2006; Tauringana & Afrifa, Citation2013) which revealed a negative association between cash collection period and firms’ profitability. These results contradict with some other studies (e.g., Rahman, Citation2011; Sharma & Kumar, Citation2011).
Table 3. Pearson correlation matrix
A seen the number of day’s deferral period in pharmaceutical companies negatively correlates with ROA, NOM and Tobin’s Q, indicating that pharmaceutical companies wait longer to pay their suppliers. Findings from some other studies that were conducted in different developing and developed countries are inconsistent with the findings of this study (e.g., Padachi, Citation2006; Sharma & Kumar, Citation2011; Tauringana & Afrifa, Citation2013). At the same time, there are number of studies that found a positive association between number of day’s deferral period and the financial performance measured by ROA (e.g., Mahato & Jagannathan, Citation2016; Mushtaq et al., Citation2015; Tahir & Anuar, Citation2015; Waema & Nasieku, Citation2009). In contrast with previous studies (e.g., Mushtaq et al., Citation2015; Roumiantsev & Netessine, Citation2014; Tahir & Anuar, Citation2015; Tauringana & Afrifa, Citation2013), number of day’s inventory-holding period has an insignificant relationship with firms performance. The association between the number of days’ inventory-holding period and ROA is negative and insignificant which signifies that pharmaceutical companies take long time to sell out their inventory which insignificantly impacts the financial performance of pharmaceutical companies. The results are in line with Ahanga and Shah (Citation2017), Padachi (Citation2006), Rahman (Citation2011), Sharma and Kumar (Citation2011), and Waema and Nasieku (Citation2009). Similar to the prior studies in the field of WCM (e.g., Padachi, Citation2006; Sharma & Kumar, Citation2011; Tauringana & Afrifa, Citation2013), these studies found a positive association between ROA, NOM and cash conversion cycle. This result indicates that pharmaceutical companies take short time to convert their inventories into cash, this result contradicts with some previous studies (e.g., Pais & Gama, Citation2015; Singhania et al., Citation2014; Waema & Nasieku, Citation2009; Yazdanfar & Öhman, Citation2014). Furthermore, there is a negative association between Tobin’s Q and cash conversion cycle. Regarding control variables results, shows that firm’s size has a positive and significant relationship with firms’ financial performance measured by ROA, NOM and Tobin’s Q. These results are supported by some researchers e.g., (Afrifa & Padachi, Citation2016; Garcia-Teruel & Martınez-Solano, Citation2007; Tahir & Anuar, Citation2015; Tauringana & Afrifa, Citation2013; Yazdanfar & Öhman, Citation2014), while some other studies contradict with the results of this study (e.g., Pais & Gama, Citation2015; Yunos et al., Citation2015). Leverage is one of the control variables used in this study; it was found that ROA, NOM and Tobin’s Q have a negative and significant correlation with leverage. This result is similar to the results found by Tauringana and Afrifa (Citation2013), Garcia-Teruel and Martınez-Solano (Citation2007), Tahir and Anuar (Citation2015), and Yunos et al. (Citation2015). On the other hand, some studies found a positive association between leverage and ROA (e.g., Afrifa & Padachi, Citation2016; Pais & Gama, Citation2015).
5.4. GMM analysis
GMM estimator accounts for possible correlations between any of the independent variables (Athanasoglou et al., Citation2008). Further, Saona (Citation2016) states that problems and issues related to individual heterogeneity are some justifications for using GMM. Both difference and GMM estimators are suitable for situations with “small T, large N” panels; independent variables that are not strictly exogenous; fixed individual effects; heteroscedasticity and autocorrelation (Roodman, Citation2006). For evaluating the effect of WCM on firms’ performance, GMM estimation is applied to dynamic panel data of 82 firms for the period from 2008 to 2017. The study used GMM estimator for the following reasons: firstly, it accounts for possible correlations between any of the independent variables (Athanasoglou et al., Citation2008). Secondly, Saona (Citation2016) stated that problems and issues related to individual heterogeneity are some justifications for using GMM. Thirdly, the independent and dependent variables are based on annual data. De Grauwe and Skudenly (Citation2000) argue that some effects of omitted variables are caught by the lagged dependent variable in the dynamic panel, which helps in correcting the autocorrelation.
To test the validity of the instrument variables used in our GMM estimation, the three assumptions of GMM are met. Findings in show that in all models, GMM lambda is significant, J-statistic is insignificant, and AR (2) is insignificant, these indicate that GMM models are valid. Furthermore, multicollinearity, normality and linearity assumptions are checked and were met. To overcome any possible multicollinearity, WCM variables were examined individually in separate models. Moreover, shows that the VIF values are less than two which mean that there is no multicollinearity in the models. Histograms were visualized, and it was found that the residuals are normally distributed. Moreover, to check the Heterogeneity, redundant fixed effects likelihood ratio was performed. Findings in show that all the models of NOM and Tobin’s Q have two-way variable intercept effect because cross-section fixed effect and period fixed effects are significant (p < 0.05) except for models of ROA which have only one-way fixed effect intercept.
Table 4. Redundant fixed effects tests
Table 5. GMM estimations
The results of models (1), (5) and (9) that are shown in represent the impact of number of day’s collection period on ROA, NOM and Tobin’s Q of Indian pharmaceutical companies. It is clear from that number of day’s collection period has a positive impact on ROA, NOM and Tobin’s Q, this result contradicts with some other studies (e.g., Afrifa, Citation2013; Makau et al., Citation2014; Pais & Gama, Citation2015; Şamiloğlu & Akgün, Citation2010; Sen & Oruç, Citation2009; Sharma & Kumar, Citation2011; Tahir & Anuar, Citation2015; Waema & Nasieku, Citation2009; Yunos et al., Citation2015) which argue that accounts receivable has a negative impact on firms performance. The magnitude of the coefficient shows that when the number of days’ collection period increases, ROA gets increased. On the other hand, the results of the study are in line with previous studies (e.g., Martínez-sola et al., Citation2014; Mushtaq et al., Citation2015; Singhania et al., Citation2014). The results indicate that firms should shorten the period of collection by following stricter credit policies that give customers less time to make payments, which in turn helps them to enhance their performance.
The results of models (2), (6) and (10) in demonstrate the impact of the number of days payable period on ROA, NOM and Tobin’s Q of Indian pharmaceutical companies listed on BSE. The coefficient of the number of days’ payables period is 0.05, 0.09 and −0.01 for the models, respectively. It means that the number of days’ payable period positively and significantly impacts ROA and NOM at 0.001, which means that when pharmaceutical companies delay the payments to their suppliers, their ROA and NOM would increase. These results are consistent with previous research (e.g., Gama, Citation2015; Mahato & Jagannathan, Citation2016; Mushtaq et al., Citation2015; Singhania et al., Citation2014; Tahir & Anuar, Citation2015; Waema & Nasieku, Citation2009). The coefficient (−0.01) means that the number of days payable period negatively impacts Tobin’s Q. It reflects that pharmaceutical companies listed on BSE follow a strategy of early payment of their credit purchases of goods and services, Tobin’s Q will be improved. The negative impact of number of day’s payable period on Tobin’s Q might be due to the following reasons: firstly, pharmaceutical companies are paying their dues on time and enjoying the discount of early payment; secondly, making an early payment to the suppliers would post the business relations between the company and the suppliers which ensures continuous business deals and enough supply at the time of shortages.
Findings of models (3), (7) and (11) in illustrate GMM estimates of the impact of number of days’ inventory-holding period on ROA, NOM and Tobin’s Q of pharmaceutical companies listed on BSE, in model (11) the coefficient of number of days inventory-holding period is (−0.04), which means that number of days inventory-holding period has a negative impact on Tobin’s Q of pharmaceutical companies; this impact is significant at 0.001. The negative and significant impact could be attributed to the following reasons: first, considerable amount of fund is locked up in inventory can be invested in other projects are highly profitable, would enhance the performance of the companies; second, it is due to various costs of holding inventory. Therefore, reducing the inventory-holding period would increase the profitability of pharmaceutical firms. Moreover, number of days holding period positively and significantly affects ROA. This result contradicts with Mahato and Jagannathan (Citation2016) and Sen and Oruç (Citation2009) who found that the number of days holding period negatively impacts firms’ financial performance.
shows the results of models (4), (8) and (12) which examine the impact of cash conversion cycle on the ROA, NOM and Tobin’s Q. The coefficient of cash conversion cycle is −0.01, −0.04 and −0.01 for the models (4), (8) and (12), respectively, indicating a negative and significant impact of cash conversion cycle on the financial performance of pharmaceutical companies listed on BSE. These results are consistent with previous studies (e.g., Mahato & Jagannathan, Citation2016; Sen & Oruç, Citation2009; Tripathi & Ahamed, Citation2016). These results contradict with other studies (e.g., Singhania et al., Citation2014; Tahir & Anuar, Citation2015; Uchenna et al., Citation2012). The negative impact of cash conversion cycle on ROA is not surprising because all three working capital elements accounts receivable, inventory and accounts payable are negatively associated with ROA. Cash conversion cycle is a result of both number of days collection period and number of days inventory-holding period minus the number of days accounts payable period. These results mean that when pharmaceutical firms shorten their cash conversion cycle, their profitability will be improved. Further, the results imply that keeping cash conversion cycle as short as possible will create value for shareholders.
6. Conclusion
Traditionally, investors, academicians and research scholars were focusing on long term corporate finance decisions such as company valuation, dividends and capital structure. Importantly, the recent trend in corporate finance research is to focus on working capital practices. Thus, the current study sought to examine the impact of WCM on the financial performance of Indian pharmaceutical companies, which has been neglected by researchers. Moreover, this study aimed to analyze working capital among small, medium and large firms. GMM model is used for estimating the results of this paper, which is based on a panel data approach of 82 companies, for the period from 2008 to be 2017. In order to check if working capital among small, medium and large firms is managed differently or not and if this difference is statistically significant or not, Kruskal-wallis test was run. For the purpose of running this test, the sample was divided based on their size into three categories: small, medium and large firms.
Results revealed that there is a significant difference in the number of day’s inventory-holding period and cash conversion cycle among small, medium and large firms; which indicates that there is a significant difference in managing working capital among small, medium and large firms. Further, it is concluded that there is a stable pattern for working capital components among small, medium and large firms. Moreover, it is found that number of days’ collection period, number of days’ payable period and number of days’ inventory-holding period positively impact the financial performance measured by ROA and NOM whereas cash conversion cycle has a negative impact on the financial performance measured by ROA, NOM and Tobin’s Q.
WCM studies in Indian pharmaceutical industry were few and either confined to one company or the top 10 companies (e.g., Joshi & Ghosh, Citation2012; Vijayalakshmi & Srividya, Citation2015; Viswanathan et al., Citation2016). This study has covered a large sample that consists of 82 companies. Moreover, advanced and robust statistical tests are used such as GMM estimates, which have not been used by previous studies. However, working capital have been intensively taught in schools and discussed in many books, studies on the same that used robust statistical tests such as Generalized Method of Moments are absent, espicially in Indian pharmaceutical industry. By looking to the reviewed studies that were conducted in pharmaceutical industry (e.g., Bhunia & Das, Citation2015; Jain, Citation2014; Kavitha & Shanmugam, Citation2015; Mehra, Citation2013; Pandey et al., Citation2016; Vijayalakshmi & Srividya, Citation2015; Citation2015Viswanathan et al., Citation2016), it was found that none of the studies followed scientific sampling process to get robust results to be generalized on the industry. The present study is limited to listed pharmaceutical companies and has not included unlisted firms, which can be carried out by researchers in the future.
6.1. Managerial and theoretical implications
This research is one of the comprehensive researches in Indian context which provides useful contribution to academicians, investors and policy makers concern about Indian pharmaceutical companies. Advanced and robust statistical techniques are used such as (GMM), which has not been used by previous studies. So, many managerial and theoretical implications can be drawn from the findings of this study. The findings suggest that working capital components should be given an important focus by all pharmaceutical firms for increasing the profitability. Results also indicated that managers of pharmaceutical firms can increase their profitability by decreasing the number of day’s receivables, inventory and cash conversion cycle to a minimum extent. The reduction of these components can be made if each component is dealt individually by formulating an optimal policy for each component. Furthermore, credit policy should be reviewed at least thoroughly to slowdown the payments to suppliers and accelerate cash collection, this is highly likely to be achieved with the help of financial experts. Moreover, financial managers can increase firms’ size and utilize the debt ratio as these two measures found significantly affect firms’ profitability. Overall, taking care of working capital components would increase firms’ performance to a higher extent, which will enable firms to be better performers in the market. Similar to several studies that suffer from some limitations, the study is not an exception, which paves the way for future research. This study is based on ten years data for the period from 2008 to 2017; lengthy period that would include data till 2019 is not possible due to some constrains obtaining further data. Furthermore, the study used secondary data that retrieved from ProwessIQ and the accuracy of the results depends on the accuracy and reliability of the source. It should be pointed that this study is limited to pharmaceutical companies that are listed on BSE; future studies can include unlisted firms and address the mentioned limitations.
Additional information
Funding
Notes on contributors

Najib H.S. Farhan
Najib H.S. Farhan is an Assistant professor, Ibn Rushd College for management Sciences, Saudi Arabia, His areas of interests are in the field of financial reporting quality, financial performance, working capital, and corporate governance. Email:[email protected].
Fozi Ali Belhaj is an assistant professor at Business Administration Department, Faculty of Business Studies, Arab Open University, Saudi Arabia. He focuses on management aspects and he has good communication, interpersonal skills, and ability to work within a team efficiently. He is very keen for knowledge and interested in conducting academic research. Email:[email protected].
Waleed M. Al-ahdal is a Ph.D. Researcher at Department of Accounting, Faculty of Business, Economics and Social Development, University Malaysia Terengganu, Malaysia. His areas of interest are in the field of Corporate Governance; Environmental disclosure; CSR; IFRS and Financial performance Email:[email protected].
Faozi A. Almaqtari is an assistant professor, department of Accounting, Hodeidah University, Yemen. He has authored, coauthored, and reviewed various articles in different reputed Scopus and ISI journals. Email: [email protected] https://orcid.org/0000-0002-5625-3643
References
- Abuzayed, B. (2012). Working capital management and firms ’ performance in emerging markets : The case of Jordan. International Journal of Managerial Finance, 8(2), 155–25. https://doi.org/https://doi.org/10.1108/17439131211216620
- Afrifa, G. A. (2013). Working capital management and aim listed some companies profitability : A Mixed Research Method Approach. Bournemouth University. https://doi.org/https://doi.org/10.6007/IJARAFMS/v3-i4/390
- Afrifa, G. A. (2016). Net working capital, cash flow and performance of UK SMEs. Review of Accounting and Finance, 15(1), 1. https://doi.org/https://doi.org/10.1108/RAF-02-2015-0031
- Afrifa, G. A., & Padachi, K. (2016). Working capital level influence on SME profitability. Journal of Small Business and Enterprise Development, 23(1), 44–63. https://doi.org/https://doi.org/10.1108/JSBED-01-2014-0014
- Aggarwal, A., & Chaudhary, R. (2015). Effect of working capital management on the profitability of Indian firms. Global Business Review, 17(8), 35–43. https://doi.org/https://doi.org/10.9790/487X-17843543
- Ahanga, N., & Shah, F. (2017). Working capital management, firm performance and financial constraints: Empirical evidence from India. Asia-Pacific Journal of Business Administration, 9(3), 206–219. https://doi.org/https://doi.org/10.1108/APJBA-06-2017-0057
- Ahmadpour, A., Zare, M. J., & Rostami, K. H. (2012). An empirical study of association between working capital management and performance: Evidence from Tehran stock exchange. Journal of Social and Development Sciences, 3(8), 279–285. https://doi.org/https://doi.org/10.22610/jsds.v3i8.711
- Ahmed, Z., Awan, M. Z., Safdar, M. Z., Hasnain, T., & Kamran, M. (2016). A nexus between working capital management and profitability : A case study of pharmaceutical sector in Pakistan. International Journal of Economics and Financial Issues, 6(2004), 153–160. https://search.proquest.com/docview/1809611959?pq-origsite=gscholar&fromopenview=true
- Ajao, O. S., & Adebayo, A. S. (2010). The study of Working capital management as a financial strategy (A case study of Nestle Nigeria PLC). Asian Journal of Business and Management Sciences, 2(4), 1–8. http://ajbms.org/articlepdf/1ajbms2012221424.pdf
- Ajibolade, S. O., & Sankay, O. C. (2013). Working capital management and financing decision : Synergetic effect on corporate. International Journal of Management, Economics and Social Sciences, 2(4), 233–251. https://papers.ssrn.com/sol3/papers.cfm?abstract_id=2367990
- Al-ahdal, W. M., Alsamhi, M. H., Tabash, M. I., & Farhan, N. H. S. (2020). The impact of corporate governance on fi nancial performance of Indian and GCC listed fi rms : An empirical investigation. Research in International Business and Finance, 51, 101083. https://doi.org/https://doi.org/10.1016/j.ribaf.2019.101083
- Alipour, M. (2011). Working capital management and corporate profitability : Evidence from Iran. World Applied Sciences Journal, 12(7), 1093–1099.
- Almaqtari, F. A., Al‐Homaidi, E. A., Tabash, M. I., & Farhan, N. H. (2018). The determinants of profitability of Indian commercial banks : A panel data approach. Int J Fin Econ, 24(1), 1–18. https://doi.org/https://doi.org/10.1002/ijfe.1655c
- Almazari, A. A. (2013). The relationship between working capital management and profitability : Evidence from Saudi cement companies. British Journal of Economics, Management & Trade, 4(1), 146–157. https://doi.org/https://doi.org/10.9734/BJEMT/2014/5427
- Athanasoglou, P. P., Brissimis, S. N., & Delis, M. D. (2008). Bank-specific, industry-specific and macroeconomic determinants of bank profitability. Int. Fin. Markets, Inst. And Money, 18(2), 121–136. https://doi.org/https://doi.org/10.1016/j.intfin.2006.07.001
- Baek, H. Y. (2006). Free cash flow, leverage, and performance: Evidence from Canadian acquisitions. Prieigaperinternetą:<http://libra.Acadia.ca/library/ASAC/v27/content/authors/n/ng,%20alex/FREE%20CASH,20
- Bagchi, B., Chakrabarti, J., & Roy, P. B. (2012). Influence of working capital management on profitability : A study on Indian FMCG companies. International Journal of Business and Management, 7(22), 1–10. https://doi.org/https://doi.org/10.5539/ijbm.v7n22p1
- Banos-Caballero, S., Garcıa-Teruel, P. J., & Martınez-Solano, P. (2012). How does working capital management affect the profitability of Spanish SMEs? Small Business Economics, 39(2), 517–529. https://doi.org/https://doi.org/10.1007/s11187-011-9317-8
- Barclay, M., Marx, L., & Smith, C. (2003). The joint determination of leverage and maturity. Journal of Corporate Finance, 9(2), 149–167. https://doi.org/https://doi.org/10.1016/S0929-1199(02)00003-2
- Berg, H. L. T. (2016). Working capital management: Evidence from Norway. International Journal of Managerial Finance, 12(3), 45–60. https://doi.org/https://doi.org/10.1108/IJMF-01-2016-0012
- Bhunia, A., & Das, A. (2015). Underlying relationship between working capital management and profitability of pharmaceutical companies in India. American Journal of Theoretical and Applied Business, 1(1), 27–36. https://doi.org/https://doi.org/10.11648/j.ajtab.20150101.15
- Chiou, J. R., Cheng, L., & Wu, H. W. (2006). The determinants of working capital management. Journal of American Academy of Business, 10(1), 149–155.
- Davis, G., & Pecar, B. (2010). Business statistics using excel. Oxford University Press.
- De Grauwe, P., & Skudenly, F. (2000). The impact of EMU on trade flows. Review of World Economics (Weltwirtshaftliches Archiv), 136(3), 381–402. https://doi.org/https://doi.org/10.1007/BF02707286
- Deloof, M. (2003). Does working capital management affect profitability of Belgian firms? Joimial of Business Fiiunife If.Aicmmting, 30 (May).
- Department of Pharmaceuticals. (2017). Annual report 2016–17. Department of pharmaceuticals. https://doi.org/https://doi.org/10.1017/CBO9781107415324.004
- Egide, T., Olweny, T., & Peter, M. M. (2016). Effect of working capital management on organizational performance. International Journal of Thesis Projects and Dissertations, 4(2), 143–151.
- Farhan, N. H. S., Tabash, M. I., & Yameen, M. (2020). The relationship between credit policy and firms’ profitability: Empirical evidence from Indian pharmaceutical sector. Investment Management and Financial Innovations, 17(2), 146–156. https://doi.org/https://doi.org/10.21511/imfi.17(2).2020.12
- Gama, M. A. P. P. M. (2015). Working capital management and SMEs profitability : Portuguese evidence. International Journal of Managerial Finance, 11(3), 341–358. https://doi.org/https://doi.org/10.1108/IJMF-11-2014-0170
- Gani, L., & Jermias, J. (2006). Investigating the effect of board independence on performance across different strategies. The International Journal of Accounting, 41(3), 295–3 14. https://doi.org/https://doi.org/10.1016/j.intacc.2006.07.009
- Garcia-Teruel, P. J., & Martınez-Solano, P. (2007). Effects of working capital management on SME profitability. International Journal of Managerial Finance, 3(2), 164–177. https://doi.org/https://doi.org/10.1108/17439130710738718
- Geethalakshmi, A., & Jothi, K. (2016). A Study on profitability position of Pharmaceutical Industry in India. International Journal of Advance Research in Computer Science and Management Studies, 4(4), 181-188.
- Gill, A., & Obradovich, J. (2012, September). Corporate governance, institutional ownership, and the decision to pay the amount of dividends: Evidence from USA. International Research Journal of Finance and Economics, 97, 60–71. http://www.internationalresearchjournaloffinanceandeconomics.com
- Haresh, B. (2012). Working capital management and profitability : Evidence from India – An empirical study. Journal of Management and Research, 5(1), 1–16.
- Hutchinson, M., & Gul, F. A. (2004). Investment opportunity set, corporate governance practices and firm Performance. Journal of Corporate Finance, 10(4), 595–614. https://doi.org/https://doi.org/10.1016/S0929-1199(03)00022-1
- Jain, M. (2014). Working capital in pharmaceutical industry in madhya pradesh. devi Ahilya University.
- Joshi, L. K., & Ghosh, S. (2012). Working capital management of Cipla limited: An empirical study. International Journal of Marketing, Financial Services & Management Research, 1(8), 170-186.
- Karaduman, H. A., Akbas, H. E., Ozsozgun, A., & Durer, S. (2010). Effects of working capital management on profitability: The case for selected companies in the Istanbul Stock Exchange (2005–2008). International Journal of Economics and Finance Studies, 2(2), 47–54. https://dergipark.org.tr/en/pub/ijefs/issue/26157/275515
- Kavitha, R., & Shanmugam, R. (2015). A comparative study on the performance of working capital management of large and small pharmaceutical companies in India. International Journal of Scientific Research, 2277. http://citeseerx.ist.psu.edu/viewdoc/download?doi=10.1.1.729.3927&rep=rep1&type=pdf
- Kazimoto, P. (2016). Working capital management and financial performance of selected companies in Kampala. International Journal of Research in IT, Management and Engineering, 6(4), 54–67. http://www.indusedu.org/pdfs/IJRIME/IJRIME_763_90809.pdf
- Kim, W. S. (2016). Determinants of corporate trade credit: an empirical study on Korean firms. International Journal of Economics and Financial Issues, 6(2), 414–419
- Lazaridis, I., & Tryfonidis, D. (2006). The relationship between working capital management and profitability of listed companies in the Athens Stock Exchange. Journal of Financial Management and Analysis, 30(76), 1–12.
- Mahato, J., & Jagannathan, U. K. (2016). Impact of working capital management on profitability : Indian telecom sector. J. Of Management & Commerce, (2), 17–23.
- Mahato, J., & Jagannathan, U. K. (2016). Impact of working capital management on profitability: Indian telecom sector. Journal of Management & Commerce, 2(2), 17–23
- Makau, M. V., Aa, B., & Stephen, M. M. (2014). Effect of working capital management on financial : Acase study of listed manufacturing firms at Nairobi securities exchange, Kenya. International Journal of Management and Commerce Innovations, 4(2), 881–888. https://www.researchpublish.com
- Mansoori, D. E., & Muhammad, D. J. (2012). The effect of working capital management on firm’s profitability: Evidence from Singapore. Interdisciplinary Journal of Contemporary Research in Business, 4(5), 472–486. https://ssrn.com/abstract=2185840
- Martínez-sola, C., García-Teruel, P. J., & Martínez-solano, P. (2014). Trade credit and SME profitability. Small Business Economics, 42(3), 1–31. https://doi.org/https://doi.org/10.1007/s11187-013-9491-y
- Mehra, P. (2013). Effect of Working Capital Management on the Profitability of the Indian Pharmaceutical Sector. International Journal of Enhanced Research in Management and Computer Applications, 2(3), 1–7. http://citeseerx.ist.psu.edu/viewdoc/download?doi=10.1.1.379.1809&rep=rep1&type=pdf
- Mehta, M. S. P. (2017). Working capital management and firms ’ profitability : Evidence from emerging Asian countries. South Asian Journal of Business Studies, 6(1), 80-97. https://doi.org/https://doi.org/10.1108/SAJBS-09-2015-0060.
- Mushtaq, H., Chishti, A. F., Kanwal, S., & Saeed, S. (2015). Trade off between liquidity and profitability. International Journal of Scientific Research and Management, 3(5), 2823–2842. https://doi.org/https://doi.org/10.1108/2823-2842
- Narender, V., Menon, S., & Shwetha, V. (2008). Factors determining working capital management in cement industry. South Asian Journal of Management, 15(4), 64–78.
- Nazir, M. S., & Afza, T. (2009). Impact of aggressive working capital management policy on firms’ profitability. IUP Journal of Applied Finance, 15(8), 19. https://web.b.ebscohost.com/ehost/detail/detail?vid=0&sid=6258ce90-fd70-4f1a-8465-15ca16efd57a%40sessionmgr103&bdata=JnNpdGU9ZWhvc3QtbGl2ZQ%3d%3d
- Nazir, M. S., & Afza, T. (2014). Impact of aggressive working capital management policy on firms’ profitability. Journal of Applied Finance, 5(5), 182–191. https://doi.org/https://doi.org/10.13187/er.2015.91.86
- Niresh, J. A. (2012). Working capital management & financial performance of manufacturing sector in Sri Lanka. European Journal of Business and Management, 4(15), 23–31. https://www.iiste.org/Journals/index.php/EJBM/article/view/2981
- Nyamao, N. R., Patrick, O., Martin, L., Odondo, A. J., & Simeyo, O. (2012). Effect of working capital management practices on financial performance: A study of small scale enterprises in Kisii South District, Kenya. African Journal of Business Management, 6(18), 5807–5817. https://doi.org/https://doi.org/10.5897/AJBM11.1418
- Oladipupo, A. O., & Okafor, C. A. (2013). Relative contribution of working capital management to corporate profitability and dividend payout ratio : Evidence from Nigeria. International Journal Of Business And Finance Management Research, 3(2), 11–20. http://www.bluepenjournals.org/ijbfmr/pdf/2013/September/Oladipupo%20and%20Okafor.pdf
- Padachi, K. (2006). Trends in working capital management and its impact on firms ’ Performance : An analysis of mauritian small manufacturing firms. International Review of Business Research Papers, 2(2), 45–58.
- Padiya, H. J. (2015). Working capital management of selected pharmaceutical units in Gujarat. Sardar Patel University.
- Pais, M. A., & Gama, P. M. (2015). Working capital management and SMEs profitability: Portuguese evidence. International Journal of Managerial Finance, 11(3), 341–358. https://doi.org/https://doi.org/10.1108/IJMF-11-2014-0170
- Pandey, N. S., Sugumari, G., & Azhagaiah, R. (2016). The impact of working capital management on profitability of pharmaceutical industry in India. Pacific Business Review International, 9(6), 1–7.
- Pirttilä, M. (2014), “The cycle times of working capital: Financial value chain analysis method”, PhD thesis, Acta Universitatis Lappeenrantaensis 609, Lappeenranta University of Technology, Lappeenranta.
- Preve, L. A., & Sarria-Allende, V. (2010). Working Capital Management. Oxford University Press.
- Raheman, A., Afza, T., Qayyum, A., & Bodla, M. A. (2010). Working capital management and corporate performance of manufacturing sector in Pakistan. International Research Journal of Finance and Economics, 47(47), 156–169. http://www.eurojournals.com/IRJFE_47_14.pdf
- Raheman, A., & Nasr, M. (2007). Working capital management and profitability – Case of Pakistani firms. International Review of Business Research Papers, 3(1), 279–300.
- Rahman, M. M. (2011). Working capital management and profitability : A study on textiles industry. ASA University Review, 5(1), 115-132. http://www.asaub.edu.bd/data/asaubreview/v5n1sl7.pdf
- Ray, S. (2012). Evaluating the impact of working capital management components on corporate profitability : Evidence from Indian manufacturing firms. International Journal of Economic Practices and Theories, 2(3), 127–136. https://ideas.repec.org/a/aes/ijeptp/v2y2012i3p127-136.html
- Roodman, D. (2006). How to do xtabond2: An introduction to difference and system GMM in Stata. Center for Global Development Working Paper (103).
- Roumiantsev, S., & Netessine, S. (2014). Should inventory policy be lean or responsive? Evidence for US public companies. Working paper . University of Pennsylvania. https://doi.org/https://doi.org/10.2139/ssrn.2319834
- Şamiloğlu, F., & Akgün, A. İ. (2010). The relationship between working capital management and profitability: Evidence from Turkey. Business and Economics Research Journal, 3(5), 62–71. https://doi.org/https://doi.org/10.1017/CBO9781107415324.004
- Sagner, J. (2014). Working capital management: applications and case studies. John Wiley & Sons
- Saona, P. (2016). Intra- and extra-bank determinants of Latin American Banks ‘ profitability. International Review of Economics and Finance, 45, 197–214. https://doi.org/https://doi.org/10.1016/j.iref.2016.06.004
- Sen, M., & Oruç, E. (2009). Relationship between efficiency level of working capital management and return on total assets in Ise. International Journal of Business and Management, 4(10), 109–114. https://doi.org/https://doi.org/10.5539/ijbm.v4n10p109
- Sharma, A. K., & Kumar, S. (2011). Effect of working capital management on firm profitability: Empirical evidence from India. Global Business Review, 12(1), 159–173. https://doi.org/https://doi.org/10.1177/097215091001200110
- Singh, H. P., & Kumar, S. (2014). Working capital management: A literature review and research agenda. Qualitative Research in Financial Markets, 6(2), 173–197. https://doi.org/http://dx.doi.org/10.1108/QRFM-04-2013-0010
- Singhania, M., Sharma, N., & Rohit, J. Y. (2014). Working capital management and profitability : Evidence from Indian manufacturing companies. Decision, 41(3), 313–326. https://doi.org/https://doi.org/10.1007/s40622-014-0043-3
- Somvanshi, K. K. (2016), “World Bank to change classification of countries; India will now be called ‘lower-middle income’ ”, Financial Times, May 31, available at: http://economictimes.indiatimes
- Taani, K. (2012). Impact of working capital management policy and financial leverage on financial performance: Empirical from Amman Stock Exchange companies. International Journal of Management Sciences and Business Research, 1(8), 10–17. http://www.ijmsbr.com
- Tahir, M., & Anuar, M. B. A. (2015). The determinants of working capital management and firms performance of textile sector in Pakistan. Quality & Quantity, 50(2), 605–618. https://doi.org/https://doi.org/10.1007/s11135-015-0166-4
- Tauringana, V., & Afrifa, G. A. (2013). The relative importance of working capital management and its components to SMEs ’ profitability. Journal of Small Business and Enterprise Development, 20(3), 453–469. https://doi.org/https://doi.org/10.1108/JSBED-12-2011-0029
- Tran, H., Abbott, M., & Yap, C. J. (2017). How does working capital management affect the profitability of Vietnamese small and medium-sized enterprises? Journal of Small Business and Enterprise Development, 24(1), 2–11. https://doi.org/https://doi.org/10.1108/JSBED-05-2016-0070
- Tripathi, N., & Ahamed, N. (2016). Does optimizing the cash conversion cycle ameliorate firm’s performance? Unravelling the relationship in the Indian corporate landscape. The Spread of Financial Sophistication through Emerging Markets Worldwide, 32, 243–255. https://doi.org/https://doi.org/10.1108/S0196-382120160000032010
- Uchenna, A. W., Mary, O. I., & Ugwunta, D. O. (2012). Effects of working capital management on profitability : Evidence from the top five beer brewery firms in the world. Asian Economic and Financial Review, 2(8), 966–982. https://www.academia.edu/download/48432384/966-982.pdf
- Ukaegbu, B. (2014). The significance of working capital management in determining firm profitability: Evidence from developing economies in Africa. Research in International Business and Finance, 31, 1–16. https://doi.org/https://doi.org/10.1016/j.ribaf.2013.11.005
- Vahid, T. K., Elham, G., Mohsen, A., Khosroshahi, & Mohammadreza, E. (2012). Working capital management and corporate performance : Evidence from Iranian companies. Procedia - Social and Behavioral Sciences, 62, 1313–1318. https://doi.org/https://doi.org/10.1016/j.sbspro.2012.09.225
- Vijayalakshmi, V., & Srividya, M. (2015). A study on working capital management of pharmaceutical industry in India. Journal of Management and Science, 5(3), 59–80. http://jms.nonolympictimes.org/Articles/JMS-Sep-2015-Vol-5-No-3-Art-5.pdf
- Vishwavidhyalaya, D. A., & By, S. (2015). A study of determinants of financial decisions in indore pharmaceuticals industry. International Institute of Professional Studies.
- Viskari, S., Lukkari, E., & Kärri, T. (2011). State of working capital management research: Bibliometric study. Middle Eastern Finance and Economics, 5(14), 99–108.
- Viswanathan, M., Palanisamy, A., & Mahesh, R. (2016). A comparative study on working capital management of selected pharmaceutical companies in India. International Journal of Management and Social Sciences, 3(3), 499-511. https://doi.org/http://dx.doi.org/10.21013/jmss.v3.n3.p11
- Vural, G., Sökmen, A. G., & Çetenak, E. H. (2012). Affects of working capital management on firm ’ s performance : Evidence from Turkey. International Journal of Economics and Financial Issues, 2(4), 4138.
- Waema, P., & Nasieku, T. (2009). Effect of working capital management on financial performance of manufacturing firms in Kenya. Journal of Financial Management & Analysis, 2(2), 75–80.
- Wire, W. C. (2015). Influence of working capital management practices on financial performance of small and medium manufacturing enterprises in Nairobi County. Jomo Kenyatta.
- Yadav, C. S., & Sb, S. S. K. S. (2014). Impact of profitability on the determinants of working capital: An evident study of large steel manufacturing companies in India. Asia Pacific Journal of Research, (Xi), 34–46.
- Yazdanfar, D., & Öhman, P. (2014). The impact of cash conversion cycle on firm profitability An empirical study based on Swedish data. International Journal of Managerial Finance, 10(4), 442–452. https://doi.org/https://doi.org/10.1108/IJMF-12-2013-0137
- Yunos, R. M., Nazaruddin, N., Ghapar, F. A., Ahmad, S. A., & Zakaria, N. B. (2015). Working capital management in malaysian government-linked companies. Procedia Economics and Finance, 31(15), 573–580. https://doi.org/https://doi.org/10.1016/S2212-5671(15)01203-4
Appendixes
Table A1. Variables description