
Abstract
The budgetary pressures, scarcity of resources, and incessant increases in the demand for public services have driven the Malaysian government to involve the private sector in the development of infrastructure through public–private partnership (PPP) projects. Despite the benefits of PPP projects in different regions, including Malaysia, various PPP endeavours are considered unsuccessful for many reasons. However, the evaluation of the success of these projects is not robust because the definition of the PPP project’s success based on its distinct nature is inadequate. Moreover, the reviewed literature has identified critical success factors (CSFs) for PPP projects, but the question remains whether these factors are real success factors. Thus, this study aimed to develop a robust definition of a PPP project success variable, to categorise the CSFs, and to examine the relationship between the CSF categories and the success of the PPP project.
To achieve these objectives, this study adopted a mixed research method—specifically, an exploratory sequential research design. First, in implementing this method, interviews were conducted to develop the measurement items for the PPP project’s success. Second, the study conducted a survey to collect the data for the exploratory factor analysis (EFA) of the newly developed PPP project success items and the principal component analysis (PCA) to categorise the CSFs. Third, the study conducted a second survey to examine the relationship between CSFs and PPP project success.
The findings indicated that a PPP project’s success can be measured based on four dimensions: time, cost, objects, quality and stakeholders’ satisfaction. Moreover, the study considered quality and stakeholders as one dimension because of the quality phenomenon. The quality phenomenon explains that the delivery of quality services satisfies all the stakeholders. Furthermore, the CSFs were categorised into five groups that significantly affected the success of PPP projects.
PUBLIC INTEREST STATEMENT
Around the globe, various governments seek private sector involvement to meet the demand of infrastructure and public services through Public Private Partnership (PPP) projects. In Malaysia, various types of PPP (i.e., BLMT, BOT and BOOT) are employed in for the development of infrastructure and public services to meet the demand and for better service quality. However, the involvement of public and private sector in the PPP project make the project complex and different than other projects. This distinct nature and complexity increase the risks and requires robust practices. Therefore, this study describes the critical success factors associated with BLMT and BOT projects.
1. Introduction
The provision of public services and infrastructure is the government’s responsibility; however, because of budgetary pressures, different governments tend to involve the private sector to provide public services by implementing public–private partnership (PPP) tools. These budgetary pressures, scarcity of resources, and the continuous increase in demand for public services have driven the Malaysian government to involve and direct the private sector towards providing public services through a PPP (Ismail, Citation2013b). Although the Malaysian government has been implementing PPP projects in many sectors since the mid-1980s (Ismail, Citation2013a), Soomro and Zhang (Citation2013) reported that various PPP projects in different regions failed for many reasons. Similarly, Malaysia Beh (Citation2010) reported on issues of patronage, cost-benefit analysis, and supervision; Markom et al. (Citation2012) identified the problems of low cash flows and construction cost overruns in the Light Rail Transit (LRT) project; and Tan (Citation2012) stated the reasons for the underachievement of the Water and Sanitation Services (WSS).
Although many projects have been successful, it cannot be denied that a considerable number of projects have underachieved, partly because these success evaluations are not robust (Osei-Kyei, Citation2017). PPP projects require massive capital investment (Yescombe, Citation2011), and scarce resources are required on the part of practitioners to define the PPP’s robust success for high-cost projects such as those commonly found in a PPP (Ika, Citation2009a; Ika et al., Citation2012). Nevertheless, the issues concerning the criteria used to measure the success of PPPs are still unclear. Currently, researches pertaining to PPPs have focused on risk management, the identification of critical success factors (CSFs), Value for Money (VfM) calculation, governance issues, economic viability, and procurement. Nevertheless, the success criteria remain elusive (Ke, Citation2009; Osei-Kyei, Citation2017).
Although Ika et al. (Citation2010) established and constructed the success dimensions for international development projects (IDPs), it should be noted that each PPP project is unique due to the involvement of both public and private sectors (Ahmad et al., Citation2018a; Ismail, Citation2013a). The development of a specific construct for the success of the PPP project is indispensable; Shenhar (Citation2001) argued that the success dimensions and measures closely depend on the type of project (i.e. low, medium, or high technology) and time frame (i.e. long term or short term). Therefore, the same construct may not be appropriate for each PPP. In addition, the involvement of both the public and private sectors and their differences in perceptions about critical issues make the project more complex (Ahmad et al., Citation2017).
Because of the importance of PPP projects, the literature highlights the CSF that contribute to a PPP project’s success. However, all CSFs are based on the experience of managers; therefore, such factors are termed perceived success factors (Grunert & Ellegaard, Citation1992). The actual success factors are the result of a statistical analysis of the relationship between success factors and project success (Grunert & Ellegaard, Citation1992; Ika et al., Citation2012). Cooke-Davies (Citation2002) termed success factors as “real success factors”. In the absence of the PPP project success variable, many of the identified CSFs remain vague. Ika, Citation2009a, p. 9) questioned, “How can you say what the correct success factors are until you have identified the criteria?” Furthermore, prior literature (Cserháti & Szabó, Citation2014; Ika et al., Citation2012; Westerveld, Citation2003) strongly recommended examining the empirical effects of success factors on project success. Moreover, in Malaysia, Build-Operate-Transfer (BOT) and Build-Lease-Maintain-Transfer (BLMT) are two important types of PPP projects that are implemented in vital sectors of its economy (Ahmad et al., Citation2018a). Still, both types are different in nature (Ahmad et al., Citation2018). Therefore, this study considers the types of PPPs as a moderator in the relationship between a PPP project’s success and success factors.
Thus, the objectives of this study were twofold. First, it aims to develop a construct for the success criteria of PPP projects. Second, it aims to examine the relationship between CSFs and the success of PPP projects. The results of this study may help researchers to find the real CSFs that significantly affect the success of a PPP project. These results may also help practitioners focus on those dimensions that drive success for the project.
2. Literature review
2.1. Public–private partnership
Recently, there has been a worldwide increase in efforts to seek the involvement of the private sector in the development and financing of public infrastructure and services. Many techniques are being developed to bring the public and private sectors together to share the risks and returns related to such a consolidation. The various techniques are often referred to as the “public–private partnerships” (PPPs) and range from a simple contracting out of management services to the involvement of the private sector in the financing, design, construction, operation, maintenance, and, in some cases, the ownership of major public service facilities and infrastructure (Yescombe, Citation2011).
According to the prime minister, the PPP Department of Malaysia defines a PPP as, “PPP is a form of cooperation between the PPP in which the standalone business is created, funded, and managed by the private sector as a package which includes the construction, management, maintenance, repair, and replacement of public sector assets including buildings, infrastructures, equipment, and facilities” (“Official Portal of Public-Private Partnership Unit”, n.d.). The Malaysian PPP process comprises five phases: the pre-project planning and selection of the private partner or a special purpose vehicle (SPV) phase; planning phase; construction phase; commencement of operation phase; and finally, the transfer to the government phase (Ahmad et al., Citation2018a). It is worth noting that in Malaysia, different types of PPP projects are implemented in different sectors of the economy (Ahmad et al., Citation2018a).
2.2. Critical success factors (CSFs)
In the reviewed literature, the terms “critical success factors” (“CSFs”) and “success factors” for projects are interchangeably used in the same context. According to Boynton et al. (Citation1984), the identification of CSFs is not limited to project management, although its roots have been found in the field of project management. Rockart (Citation1979, Citation1982) defined CSFs as “those few key areas of activity in which favourable results are necessary for a particular manager to reach his or her own goals”. The importance of CSFs leads to another crucial argument, “how to find the critical success factors (CSFs)” and “what are the real success factors” (Ika, Citation2009a; Ika et al., Citation2010, Citation2012). To answer the first question, Rockart (Citation1982) proposed an interview method to identify CSFs.
There are two other types of CSFs: perceived key success factors and actual success factors (Grunert & Ellegaard, Citation1992). The perceived success factors are based on the experiences of practitioners, whereas actual success factors are the result of the statistical analysis of the relationship between success factors, cost, and objectives. The literature (Cserháti & Szabó, Citation2014; Ika et al., Citation2012; Westerveld, Citation2003) elucidates that actual success factors that are based on statistical analysis benefit the project more, and there is a pressing need to convert perceived success factors to actual success factors.
For different types of PPP arrangements, the literature identifies CSFs based on practitioners. presents the success factors identified by different researchers in different regions of the globe.
Table 1. CSFs for PPP Projects
2.3. Project success
Ika, (Citation2009a) and Ika et al. (Citation2012) described success as “a happy result, a success”. However, “what is the success of the projects?” In the available literature, no consensus has been reached about the means of “project success” or “failed projects” (Ika, Citation2009a).
Atkinson (Citation1999) and Westerveld (Citation2003) considered the restrictions of time, cost, and quality or “triangle: time, cost, quality” or the “iron triangle” as sufficient to describe a project’s success. Even so, it has often been observed that there have been projects that had been delivered on time, within budget, and according to the required specifications but still were considered as failures. In contrast, some projects failed to meet the requirements of time, cost, and quality, yet have been proven to be successful (Pinto & Slevin, Citation1988). Hazebroucq (1993) explained that projects which had been perceived as failures at one time could become symbols of success later. Conversely, some successful projects have proven to be disastrous. Hence, it is the criterion for achieving prolific objectives or stakeholders which define the level of the success of projects (Ika, Citation2009a).
Ika, (Citation2009a) highlighted that, in the past, a robust explanation of project success is scant in the available literature. Over the decades, various authors have explained countless dimensions of success in different words, but they share similar concepts. Accordingly, depicts the dimensions of project success.
Table 2. Success Dimension in Literature
2.4. Project success and success factors
Rockart (Citation1982) explained that success factors are key areas affecting the success level of a project or crucial factors that need to be handled properly to achieve the success factors. In other words, success factors must have an impact on the level of success. This clearly means that a true success factor for PPP projects should have an impact on the PPP project’s success. As Ika et al. (Citation2012) explained, the greater the impact on success, the more important the success factor is. However, the criticality of this factor cannot be gauged based on perceptions. Therefore, this study considered all of the success factors in the field of PPP that were identified as CSFs for the purpose of examining the empirical relationship between success factors and the success of establishing the actual CSFs. Thus, the hypotheses of this study are as follows:
H1: Success factors have a significant effect on the PPP project’s success.
describes the number of PPP projects completed until 2019 and their types (Ahmad, 2019). The current literature (Ahmad et al., Citation2018b, Citation2018) suggest that different types of PPPs are diverse in nature and may result in different success factors. Therefore, this study develops another hypothesis:
H2: Certain types of PPPs have a significant moderating effect on the relationship between success factors and project success.
Thus, the discussion of the hypothesis concludes following research framework;
3. Methodology
This study aims to examine the relationship between success factors and PPP project success. Although the study adopts success factors from the literature (see ), the construct of PPP project success needs to be developed. To achieve this objective, the study adopted a mixed method approach—specifically the exploratory sequential method—as suggested by Creswell (Citation2017). The exploratory sequential method consisted of two phases: qualitative and quantitative. In the qualitative phase, the study developed a PPP project success construct based on interviews and the research experts’ judgment (DeVellis, Citation2016). The construct was tested in the quantitative phase, the success factors were categorised, and the hypotheses were tested (DeVellis, Citation2016).
The purpose of the qualitative approach in the first phase was to assist in the development of a questionnaire on PPP project success (Creswell, Citation2017). This first phase was divided into three stages: interviews, development of items, and expert judgment of the items (DeVellis, Citation2016). Based on the qualitative interview guidelines (Sekaran & Bougie, Citation2016; Whiteley, Citation1998), this study used open-ended questions to establish the domain/definitions of PPP project success. For this phase, interviews were conducted with 28 practitioners who were involved in PPP projects from both the public and private sectors. Twenty-eight interviews were considered sufficient because of the repetition of the information.
Based on the interview findings, a large initial pool of items was generated which was shrunk into a small pool of items. Based on Lynn’s method (1986), these items were listed in the form and sent to research experts in the field of PPP for content validity analysis. The experts rated the items based on Lynn’s rating scale (1986). For content validity, the study consulted ten research experts to determine the content validity of the PPP project items, and five of these experts had research expertise in PPP projects.
After the items were finalised, the quantitative phase was initiated. It comprised an exploratory factor analysis (EFA) of the measurement items of PPP project success, a principal component analysis (PCA) for success factor categorisation, and structural equation modelling (SEM) for hypothesis testing. In this phase, the data were collected twice using a survey questionnaire based on simple random sampling. The first survey was conducted for an EFA and PCA to test the newly developed construct of PPP project success; correspondingly, the second survey was conducted for the SEM to test the hypothesis. For the first survey, two questionnaires were sent for one project: one to the managers from the Ministry (public sector) and another questionnaire to the managers of an SPV (private sector). The study received 152 questionnaires out of 200 for the first survey. For the second survey, a questionnaire was sent to the directors of PPP projects from both the public and private sectors involved in the monitoring of the current PPP projects. The study received 128 out of the 200 questionnaires sent; notably, of the 128 questionnaires received, 70 belonged to the BLMT type of PPP and 58 belonged to the BOT type. Hair et al. (Citation2016) recommend adopting partial least squares structure equation modelling (PLS-SEM) to test complex structural models with a small sample size; thus, this study adopted the PLS-SEM approach.
3.1. Analysis, results, and discussion
This section presents the analysis and findings of both phases. The first phase is qualitative, whereas the next phase is the quantitative method.
3.2. Qualitative phase analysis
This section presents the analysis of the interview data, discusses the developed items of the PPP project success, and presents the content analysis of the developed items based on the judgment of experts.
3.3. Interview results
The answers to the interview questions formed the raw data of the study. To interpret the raw interview data, the study used Atlas.ti 8.0 software, which was used to generate codes (themes) and interview quotations to describe the PPP project success. Each code was based on several interview questions. Based on the codes and quotations, PPP project success can be described as:
PPP project success consists of various dimensions—namely, time, cost, quality of services, profile objective, and stakeholder satisfaction. Nevertheless, preparing for the future was excluded based on expert opinions. depicts the dimensions of PPP project success. The letters D and G represent the density and groundedness of the code, respectively. Density refers to the attachment of a code to other dimensions and constructs. Furthermore, a density of more than 1 means that the code is attached to more than one dimension or construct. In addition, groundedness refers to the number of quotations attached to the code.
Figure 1. Research Framework
The interview results for the PPP project successfully revealed each dimension, which are discussed as follows:
3.4. Time
- PPP agreements are time-specific and based on certain demand forecasts. Based on the demand forecast, the government initiated the project, and the SPV would prepare a budget for a specific period. Therefore, the pressure of public demand makes time very crucial for both the government and the SPV. For instance, a road project should deliver services based on highway traffic forecasts. Similarly, a university hostel project of a specific number of rooms must commence its service at a scheduled time before the admissions of students.
To meet the demands of the scheduled time, suitable planning time, completion of project construction, and commencement of operations at the scheduled time are critical in a PPP project. The planning phase would normally take longer for many reasons, such as the clarity of the design concept and delays in approvals. However, proper planning is vital for the success of PPP projects. Delays in construction or installation affect the overall schedule because the constructed facility cannot be immediately enjoyed in the case of delay. After the construction, the respective public departments would inspect the facility based on the key performance indicators (KPIs) of the PPP agreement. In the case of minor or major defects, extended time is required for the necessary rectification. Therefore, the three crucial components of time are the proper planning of time, in-time construction, and commencement of operation at the schedule.
The government desires in-time construction and commencement of service delivery to avoid any public hostility. In addition, delays in commencement may incur extra costs for the provision of a substitute. Furthermore, in the case of a long delay, the government may cancel the agreement which in itself is a failure of the PPP project.
Similarly, time is crucial for an SPV because it receives a unitary charge (payment from the government) at the start of the operation, yet it must start the repayment of debt instalments at the specified time, irrespective of when the operation commenced. Therefore, for an SPV, it is vital to start operations at the scheduled time. Even so, possible delays in approvals, lengthy documentation, and excessive changes in design may increase the planning time. In addition, material availability, technological imports, and lengthy inspections may delay the construction and commencement of service delivery. Therefore, it can be concluded that PPP project time consists of three crucial timelines: suitable planning time, in-time construction, and the commencement of service delivery. Thus, this study developed three measurement items over time.
3.5. Cost
- Cost plays a pivotal role in the success of the PPP project, as it affects the overall budget. The cost of the PPP project comprises the construction and operation/maintenance costs. Both these costs are associated with each other because the quality of the material used in the construction stage affects the frequency of maintenance during the operation stage. Owing to its importance, cost is crucial for both the government and the SPV.
To the government, cost is vital because, ultimately, the government must bear the cost of the project. Therefore, the cost is minimal. Based on budgeted construction and maintenance costs, the government fixes the unitary charge (rental payment). In the case of any increase in the maintenance cost, the unitary charge can be revised. However, the government does not incur any increase in construction costs.
For an SPV, any increase in cost is crucial, as it directly affects cash flows and profitability. For an SPV, the cost of a PPP project can be divided into three sections: the cost of finance, construction, and operations. Only in the case of an increase in the cost of maintenance, the government may increase the payment of unitary charges. Otherwise, the SPV would have to bear the burden of an increase in cost. Furthermore, the cost of maintenance could affect the budgeted cash flows because the cash flows of the SPV depend on the payment (inflow) from the government/public and the maintenance cost (outflow), whereas the amount and schedule of debt instalments are fixed. Therefore, low cash flows may lead to delays in debt instalment. Therefore, this study measures costs by using construction and budgeted cash flows.
3.6. Quality of service
The quality of service is vital for both the government and the SPV. The quality of service must be coherent with its KPIs. The government has the purpose of seeking private sector involvement because of its investment and better quality of service. Similarly, service quality is vital for an SPV because in the case of the KPIs failing to be achieved, the unitary charges can be stopped, or penalties can be imposed that can directly affect the profit margins. Furthermore, in Malaysia, all PPP projects belong to critical public sectors, such as health, education, security, and infrastructure. Therefore, quality is crucial. In addition, the failure of the SPV in providing good quality services may affect the government directly in terms of inviting public hostility. Thus, this study suggests the need to measure the quality of services pertaining to specific KPIs mentioned in the agreement rather than comparing them with a general threshold.
3.7. Objectives in profile
Ministry officials usually develop a needs statement for every PPP that states the project’s objectives and profile. Generally, all these objectives are publicly announced and available on the Ministry’s website. One of the main objectives is the VfM, which aims to achieve maximum service with low cost at standard quality. Technical experts of Malaysia’s Public Private Partnership Unit (UKAS) defined that the VfM ratios for each project should be achieved through PPP projects—otherwise, PPP projects are not considered successful.
For all the government ministries of Malaysia, the profile objectives and the VfM are one of the main concerns, as the auditor general of Malaysia will inspect the VfM and objective profiles on a yearly basis. Moreover, it is important for the government to achieve VfM to avoid political hostility. Ika et al. (Citation2012) and Munns and Bjeirmi (Citation1996) postulated that the achievement of specific objectives is one of the dimensions of success. For PPP projects, the achievement of the VfM is one of the specific objectives. Therefore, this study suggests the inclusion of VfM as an item in the construct of success.
3.8. Stakeholder satisfaction
Interviewees revealed four main stakeholders: the government, SPV, debt financer, and public/user. A PPP project should satisfy all of these major stakeholders. The government needs to fulfil all its objectives in the provision of a particular public service, whereas the SPV needs to achieve a budgeted profit margin. Similarly, a debt-provider requires an in-time repayment, and the public needs satisfactory service at a low cost.
Therefore, based on the interviews, a project is considered successful if it is completed in the budgeted cost, delivers the desired services within the scheduled time, obtains all its objectives, and satisfies all the stakeholders.
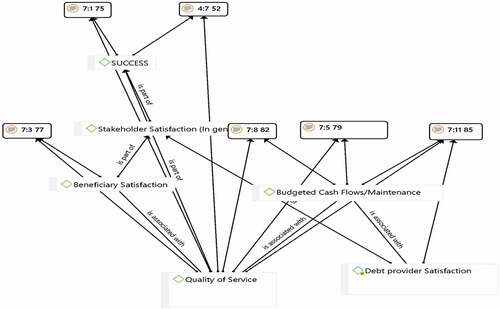
Based on the interview quotations, explains the quality phenomenon. The low quality of service is associated with unsatisfied beneficiaries which in turn creates hostility. The government may stop the payment to the SPV for low-quality services or deduct some amount from the payment as a penalty. This situation reduces the cash flows of the SPV and delays the payment of debt instalments to financial institutions. In a worse situation, project operations may shut down for the non-payment of debt instalments. Furthermore, the delay in debt instalments discourages financial institutions in the market to extend debts for PPP projects. For instance, students in the case of a hostel project and the public in the Medical Equipment Enhancement Tenure (MEET) project (Ahmad et al., Citation2018b) may express hostility to compel the government to take action against the SPV. Similarly, the government may stop the SPV from collecting road tolls for inferior road quality. Thus, the quality of the phenomenon affects all the stakeholders ().
Figure 2. PPP Project Success
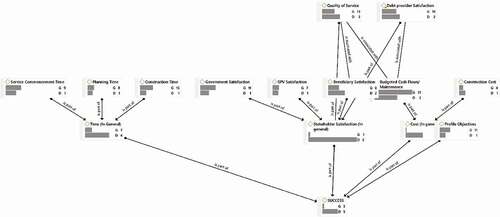
Figure 3. Quality Phenomenon
3.9. Excluded dimension
The findings of interviews indicated the lack of usefulness of one dimension: the future preparation or expansion of the market or the fulfilment of a future need. Each PPP project was built for the specified objectives and specific demands. Based on specific demands, all budgeted statements are prepared. In PPP projects, management does not account for any budget for future marketing or expansion. In the case of extra demand or expansion, the government launched a separate project. Even if expansion is required in the current project, expansion comes under a new project because separate planning and agreement are prepared for that expansion. Nevertheless, the need statement of the government accounts for future demands and creates plans for projects that are connected. Therefore, unlike normal business projects, future preparation or market expansion is not carried out for a specific PPP project.
3.10. Development of items and content analysis
Based on the above description, a large pool of items has been developed for PPP project success in accordance with the guidelines proposed by DeVellis (Citation2016). A large pool of items was presented by the School of Economics Finance and Banking (SEFB) committee. Based on this suggestion, a small pool of items was generated. Ten research experts rated the items based on Lynn’s method (1986) by examining content validity in the form of an item-content validity index (I-CVI), construct validity index (C-CVI), and the ratio of the agreed experts to all experts. The threshold value for this study for each item (I-CVI) was 0.6 (DeVellis, Citation2016).
For PPP project success, after the suggested revision, all the items have at least 0.9 I-CVI, and the overall scale has 0.93 S-CVI. Likewise, the overall agreement ratio of the experts is 0.5, which means that 50% of the experts are in complete agreement to approve the scale. These results confirm that the PPP project success scale is satisfactory and can be used for quantitative research tests.
3.11. Quantitative phase analysis
This section presents the EFA for the PPP project success items, a PCA for the success factors, and a SEM analysis to examine the relationship between success factors and PPP project success. The details of the analysis are as follows.
3.12. Exploratory factor analysis (EFA)
To ensure the dimensionality of the PPP project success items that were developed in the previous section, Yong and Pearce (Citation2013) suggested examining the patterned relationship between the items and sample adequacy of the data set before extracting the factors.
3.13. Patterned relationship
To ensure the suitability of the current study’s dataset for EFA, a patterned relationship through the correlation matrix is examined. The patterned relationship reveals the possibility of extracting factors from a pool of items through the correlation matrix and Bartlett’s test of sphericity. In addition, the confirmation of the patterned relationship authenticates the absence of multicollinearity among the items. This step is consistent with prior studies (Field, Citation2013). Furthermore, Yong and Pearce (Citation2013) asserted that the determinant score of the correlation matrix should be higher than 0.00001, and the correlation among the variables should be less than 0.9. In addition, Bartlett’s test of sphericity determines the significance level of the patterned relationship. Consequently, Bartlett’s test of sphericity ensured that the p-value was less than 0.05. illustrate that the correlation values of all the items are less than 0.9, and the determinant value is 5.38E-005—which is satisfactory. Both the correlation matrix and p-value authenticate the patterned relationship.
Table 4. The correlation for PPP Project Success Items
Table 5. KMO and Bartlett’s Test for PPP Project Success Items
3.14. Sample adequacy
After a patterned relationship, the next step in the EFA is to determine the sample adequacy. Yong and Pearce (Citation2013) suggested that a Kaiser-Meyer-Olkin measure (KMO) and diagonals elements of the anti-correlation matrix are measures that can be used to determine sample adequacy. The value of the KMO value should be higher than 0.5, and the diagonals values should also be more than 0.5. shows a 0.804 KMO value that is acceptable for the current study. In addition, the diagonal values of the anti-image matrix are from 0.670 to .886, which are satisfactory (). Both the KMO and anti-correlation matrix depicted also indicated the adequacy of the sample size.
Table 6. Anti-Image Correlation
3.15. Factor extraction and rotation
In the last step of the extraction of factors, the decision about the extraction method and rotation is crucial. The principle axis method was selected along with a varimax rotation because it intends to find the dimensions (latent structure) (Conway & Huffcuit, Citation2003). After the decision of the extraction method and rotation, the Kaiser criterion and scree plot method were utilised to determine the number of factors retained (Conway & Huffcuit, Citation2003; Yong & Pearce, Citation2013). In the Kaiser criterion, the rotated sum of the extracted eigenvalues should be greater than 1. Furthermore, the scree plot involves the graph of the eigenvalues to determine a number of factors by observing the bend or break point in the data curve. shows that the Rotated Sums of Squared Loadings for the first four factors was more than 1. Moreover, the scree plot shows a bend at Factor 5 (). Thus, for the 12 items of success, there were four factors. The factor matrix and rotated factors illustrate the items for each factor.
Table 7. Total Variance Explained for success items
Figure 4. Scree Plot
Figure 5. Scree Plot
3.16. Factor 1
This factor () consists of five items in which four are the stakeholders’ satisfaction items; one of them is a quality item. All factors have factor loadings of more than 0.5, which is the benchmark (Yong & Pearce, Citation2013). The quality phenomenon in qualitative findings is confirmed in the factor analysis in that the quality and stakeholder satisfaction are associated. Therefore, this study named Factor 1, “Quality and Stakeholder Satisfaction”.
Table 8. Factor Matrix
Table 9. Rotated Factor Matrix
3.17. Factor 2
This factor consists of all three items of time that show the importance of all-time items and their common variance. Consequently, Factor 2 is named “Time” and the items in it are related to planning, construction, and operations. This factor is consistent with the prior literature (Ika et al., Citation2012), but it separately includes items of planning, construction, and operation.
3.18. Factor 3
This factor consists of both cost items: construction cost and budgeted cash flows (maintenance cost). Therefore, Factor 3 is named “Cost” and it is consistent with prior literature (Ika et al., Citation2012) but contains two items.
3.19. Factor 4
This factor consists of two items related to profile objectives. However, these two items have a good contribution in Factor 1 and Factor 2, but their distinct nature and high values in Factor 4 allow us to consider them in Factor 4, which is named, “Profile Objective”.
3.20. Principal component analysis (PCA) for success factors
The second objective is to assess the underlying relationships between success factors through categorisation of factors. Field (Citation2013) suggested a PCA for component extractions in success factor categorisation because prior knowledge is scant about the factor structure. The PCA is divided into a preliminary analysis and a factor extraction.
3.21. Preliminary analysis
For a PCA, the assessment of patterned relationships, sample adequacy of the data set, and singularity of the correlation matrix is vital before extracting the component (Field, Citation2013; Yong & Pearce, Citation2013).
The correlation determinant score helps to examine the patterned relationship, which should be more than 0.00001 (Yong & Pearce, Citation2013). The determinant score for the correlation was < 0.00001. However, Yong and Pearce (Citation2013) suggested deleting low correlation values. Therefore, the study deleted the SF10 (political support) and SF15 (good governance) which resulted in a determinant score of 1.13E-005—which is acceptable. Moreover, the Kaiser-Meyer-Olkin (KMO) test and the diagonal values of anti-image correlation are measures of sample adequacy (Ameyaw & Chan, Citation2016; Field, Citation2013). The KMO value should be larger than 0.5, and the diagonal of the anti-image matrix should be reasonably high (> 0.5) for a good factor analysis (Field, Citation2013). The current study has a KMO value of 0.758 (), and all diagonal values of anti-image-correlation were 0.551 to 0.888.
Table 10. KMO and Bartlett’s Test for PPP Success Factors
Moreover, the value of Bartlett’s test of sphericity explains whether the correlation matrix is significantly different from the identity matrix. This significant difference means that the correlations between variables are (overall) significantly different from zero, and a PCA can be conducted. This study has a significant value (p = 000) for Bartlett’s test of sphericity. The values of the correlation matrix determinant, the KMO test, diagonal values of anti-image, and Bartlett’s test of sphericity met the threshold criteria. Thus, this study can extract these factors.
3.22. Factor extraction and rotation
The PCA can extract the factor by using the principle component method, and this study used a varimax rotation to find components (Conway & Huffcuit, Citation2003). After the selection of extraction method and rotation, this study adopted the Kaiser criterion and scree plot method to decide the number of factors retained (Ameyaw & Chan, Citation2016; Conway & Huffcuit, Citation2003; Field, Citation2013). depicts the Rotated Sums of Squared Loadings for the first five factors are more than 1. Moreover, the scree plot shows the bend at Factor 6. Thus, for 18 success factors, there are five components/categories. The factor matrix and rotated factors illustrate the items in each category ().
Table 11. Total Variance Explained for Success Factors
Table 12. Component Matrix
Table 13. Rotated Factor Matrix
3.23. Category 1
The first factor consists of the following five success factors: government involvement by providing guarantees, project technical feasibility, technology transfer, shared authority between public and private, and the commitment and responsibility of the public/private sector. The study names this factor as “Technology and Relationship Factors”.
3.24. Category 2
This factor consists of the following three items: strong private consortium, competitive procurement process, and transparency in the procurement process. All of these factors are associated with the selection of an SPV in the preplanning stage (Ahmad et al., Citation2018a), and are thus termed procurement factors. This category is consistent with the findings of Chan (Citation2010), who emphasised the transparent procurement process.
3.25. Category 3
This includes factors such as appropriate risk allocation and risk sharing, well-organised public agency, thorough and realistic cost/benefit assessment, and multi-benefit objectives. All of these factors are related to the planning phase of the PPP project, whereas organised public agency is an important success factor. Thus, the study names this category as “Organised Public Agency and Planning Phase Factors”.
3.26. Category 4
The fourth factor consists of the following four CSFs: stable macroeconomic environment, available financial market, sound economic policy, and favourable legal framework. All of these factors are related to the economy; thus, the study terms this category as “Macroeconomic Factors”, which are also consistent with Chan’s (Citation2010) findings.
3.27. Category 5
Factor Five consists of the following two CSFs: clearly defined responsibilities and roles, and clarification of contract documents. Therefore, the study names this category as “Agreement Factors”. The separate grouping of these two factors confirms the argument of Ahmad et al. (Citation2018) that agreement plays a crucial role in a PPP project’s success.
As the success factors are categorised into five categories, the study divides H1 into five sub-hypotheses:
H1a: Technology and relationship factors have a significant effect on a PPP project’s success.
H1b: Procurement factors have a significant effect on a PPP project’s success.
H1c: Organised public agency and planning phase factors have a significant effect on a PPP project’s success.
H1c: Macroeconomic factors have a significant effect on a PPP project’s success.
H1d: Agreement factors have a significant effect on a PPP project’s success.
3.28. Structural equation modelling (SEM)
PLS-SEM divides the model into the following sub-models for assessment: measurement model/outer model and structural model/inner model. The outer model assessment was conducted to examine the underlying assumptions of internal consistency and the validity of the model, while the structural model examined the research hypothesis. The detailed analysis is as follows:
3.29. Assessment of the outer-model
Ramayah, Cheah, Chuah, Ting, and Memon (Citation2018) suggested three criteria for the assessment of the reflective model: internal consistency, convergent validity, and discriminant validity.
For internal consistency, the composite reliability (CR) should be more than 0.6, and is not desirable if more than 0.95 (Ramayah, Citation2018). shows that all the variables meet the threshold value of the CR.
Table 14. Outer Loadings, Composite Reliability and Average Variance Extracted for SEM
In the PLS model assessment, the convergent and discriminant validity are measures of the construct’s validity (Hair et al., Citation2016). The convergent validity is measured using the outer loadings of the items and the average variance extracted (AVE) of the variables. The outer loadings of the construct should be more than 0.7 while the AVE should be more than 0.5 (Hair et al., Citation2016). The values of the outer loading and AVE meet the threshold values recommended in the literature (Hair et al., Citation2016; Ramayah, Citation2018), hence, ensuring the convergent validity (see ).
Moreover, discriminant validity is an important criterion for evaluating the validity of the construct. The PLS provides two criteria, namely Fornell and Lacker’s criterion, cross-loading criterion, and heterotrait–monotrait (HTMT) criterion for ascertaining discernment validity (Hair et al., Citation2016; Ramayah, Citation2018). indicates that the diagonal value of each construct is greater than its value correlated with the other constructs.
Table 15. Fornell and Lacker’s criterion
Another criterion to examine the discriminant validity is cross-loadings, which means that an indicator’s loadings on the associated construct should be greater than any of its cross-loadings on other constructs (Hair et al., Citation2016). shows that the items of each construct load are higher on its respective construct than on other constructs. Moreover, the HTMT ratio of correlation is less than 0.9 which satisfies the HTMT threshold values. Therefore, the discriminant validity of the construct was established.
Table 16. Cross Loadings
The above discussion of internal consistency, convergent validity, and discriminant validity confirms that the model is fit for assessment. Specifically, the newly developed variables such as PPP project success, along with their dimensions, satisfy the criteria of reliability and validity. After determining the outer model, it is possible to examine the outer model/structural model to test the hypothesis.
3.30. Assessment of the inner-model
The inner model was used to test the hypothesis. The assessment of each inner-model/structural model comprises four steps: hypothesis testing/path coefficient, R2, f2, and Q2.
The most important step was to test this hypothesis. All the hypotheses in the inner model require an examination of the direct relationships between the independent and dependent variables. This hypothesis was examined based on the path coefficients and level of significance. The bootstrapping procedure allowed for the determination of path coefficients and their significance in SmartPLS 3.0 software. This study’s bootstrapping procedure was conducted based on two-tailed t-tests, and a path coefficient was considered significant if the t-value was greater than 1.96, with the p-value being less than 0.05, or the t-value greater than 1.645 with a p-value less than 0.01 (Ramayah, Citation2018). shows the results of bootstrapping
Table 17. Assessment of Inner Model
In addition, it is important to evaluate the predictive accuracy of the model through the coefficient of determination (R2) score. Hair et al. (Citation2016) suggested reporting the adjusted R2 as well. Hair et al. (Citation2016) described R2 values 0.75, 0.5, and 0.25 as substantial, moderate, and weak levels of predictive accuracy. The current study has R2 and the adjusted R2 values as 0.782 and 0.773, respectively.
Moreover, after assessing the predictive accuracy, it is vital to evaluate the effect size of the predictors using f2 (Hair et al., Citation2016) because f2 assesses the relative importance of a predictor construct on an endogenous construct. Specifically, it gauges how strongly one exogenous construct contributes to explaining certain endogenous constructs in terms of R2. Cohen (Citation1988) considered the f2 values of 0.35, 0.15, and 0.02 as large, medium, and small effect sizes, respectively. The f2 of C1, C2, C3, C4, and C5 are 0.045, 0.105, 0.174, 0.039, and 0.084, respectively. The values of f2 imply that C3 has a large effect on the PPP project, whereas all the other factors have a low effect on PPP project success.
The predictive relevance (Q2) of the model was examined using the blindfolding procedure through cross-validated redundancy (CVR) and cross-validated communality (CVC). If the Q2 value is larger than 0, the model has predictive relevance for the endogenous construct (Hair et al., Citation2016). The blindfolding procedure for the current study produces values of both CVR (0.492) and CVC (0.561) which are greater than zero and are acceptable. Thus, the success categories show the predictive relevance of the path model.
3.31. Multi-group analysis
To test H2, the effect of the types of PPP on the relationship between the success factor categories and PPP project success, a multi-group analysis (MGA) was adopted based on Hair et al. (Citation2016). Established by Hair et al. (Citation2016), the parametric approach of the MGA was adopted as the study received a response from two types of PPP projects: BLMT and BOT. In this approach, the difference in path coefficients was calculated, and their significance was tested. The results in ) reveal that C3 (at p-value = 0.5) and C1 (at p-value = 0.10) categories have significant differences in path coefficients.
Table 18. Assessment of Inner Model
4. Discussion
This study aimed to develop a construct for a PPP project’s success, categorise success factors, and examine the relationship between success factor categories and PPP project success. Therefore, the discussion of the results can be divided into the following three main sections.
4.1. Construct of PPP project success
The first objective of this study was to construct the measures/items for PPP project success. The study conducted interviews and described the results based on the interview quotations. The results illustrated that a PPP project’s success depends on time, cost, quality, profile objective, and stakeholder satisfaction. Still, this study did not consider the preparation of the future as a dimension of PPP project success. The dimensions are consistent with the findings of prior literature (Ika et al., Citation2012; Shenhar, Citation2001; Shenhar et al., Citation1997).
The first dimension of a PPP project’s success is “time”, which is consistent with prior literature, as Shenhar et al. (Citation1997) explained that time is a measure of efficiency, and they introduced an item known as the “meeting time goal”. Most of the authors (Chandra, Citation2015; Ika et al., Citation2012) used this item to measure the efficiency of the project. A few PPP project success indices (Osei-Kyei & Chan, Citation2018) utilised one item, which was “Adherence to time”. However, this study has developed three items for time because the interview findings indicated that time delays occur at the planning stage, construction, and commencement of the project which is consistent with prior literature (Ahmad et al., Citation2018a).
Sufficient planning time is vital for PPP projects, but lengthy planning leads to the cancellation of a project. In this way, Soomro and Zhang (Citation2013) reported a few projects around the world that were cancelled at the planning stage. Therefore, this study used one item, particularly for the planning time. Similarly, construction is an essential phase of a PPP project for both public and private partners (Ahmad et al., Citation2018a). Abdul-Aziz and Jahn Kassim (Citation2011) reported the construction delay in housing projects and considered it to be one of the major reasons for failure. Thus, this study considered separate measurement items for the construction and commencement of the project.
The second dimension of success is cost, which plays a pivotal role in the success of the PPP project as it affects the overall budget. The cost of a PPP project is comprised of construction and operation costs/maintenance costs. Both of these costs are associated with each other, as the quality of the material used in the construction stage affects the frequency of maintenance at the operation stage. Owing to its importance, the cost is crucial for both the government and the SPV. The cost is the dimension of success which is consistent with the literature (Baccarini, Citation1999; Pinto & Slevin, Citation1988; Shenhar, Citation2001; De Wit, Citation1988). However, these studies measure cost using one item which is “Meeting the budget goals” (Cserháti & Szabó, Citation2014; Ika et al., Citation2012). Osei-Kyei and Chan (Citation2018) suggested one item, which was “Adherence to budget”.
Nevertheless, the interview findings suggest that construction cost overruns, and operational cash flows affect the budget of the PPP project. This finding is consistent with a study conducted by Markom et al. (Citation2012), who reported the case of LRT where the SPV failed to achieve the budgeted goals due to high maintenance costs and low cash inflows. Similarly, Mohamad, Ismail, and Said (2018) ranked operational cost and construction cost as the first two most important performance indicators and suggested that strategies to achieve budgeted operational and construction costs should be developed. Thus, this study measured costs using construction costs and budgeted cash flows.
The third dimension of a PPP project profile is the objective. Generally, PPP projects are developed for specific objectives, and the experts state these objectives in the needs statement (Ahmad et al., Citation2018a). The findings suggest that one of the main objectives is the VfM, which aims to achieve maximum service with low cost at standard quality. The technical experts of UKAS define the VfM ratios for each project that should be achieved through PPP projects. Otherwise, the PPP projects were not considered successful. Therefore, this study develops two items to inquire about profile objectives. Thomas and Fernández (Citation2008) considered one item—meeting project objectives—to measure the objectives, but PPP projects have specific objectives and VfM ratios to meet. Ika, (Citation2009a) Munns and Bjeirmi (Citation1996) postulated that the achievement of specific objectives is one of the dimensions of the success. The findings illustrate that the achievement of VfM is one of the specific objectives for PPP projects, which is consistent with the findings of Li (Citation2003). Therefore, in the measurements of PPP project success, this study includes one extra item to inquire about the VfM ratio.
The last dimension is “quality and stakeholder satisfaction”. Previous literature considers quality and stakeholders as two different dimensions. However, the EFA results of the current study combine the items “the quality and the stakeholder” because of the quality phenomenon. Accordingly, the quality phenomenon states that if the quality of service is low, unsatisfied beneficiaries create hostility—that is, students in the case of the hostel project and the public in the MEET project. The government halts or deducts the rental payments that affect SPV cash inflows. Low cash inflows tend to make the SPV delay debt instalment payments. In a worse situation, project operations may be shut down. Thus, the quality phenomena affect all stakeholders. Markom et al. (Citation2012) described that a PPP project is successful if it offers a fair deal for all, which means that it satisfies all stakeholders.
Furthermore, interviewees revealed four main stakeholders: the government, an SPV, debt financer, and the public/user, which are consistent with the findings of Fischer (Citation2010). A PPP project should and is likely to satisfy all major stakeholders. Shenhar (Citation2001) considered a project to be successful if it satisfied all the stakeholders. Therefore, this study developed four separate items to examine the satisfaction of each stakeholder.
Despite “Time”, “Time”, “Objectives”, “Quality” and “Stakeholder Satisfaction”, Shenhar (Citation2001) revealed that the “preparation for the future” as another dimension that contributes to the success and argued that a project may create a new product line, new technology, and a new market to survive in the future. However, the findings of the interviews highlighted the lack of usefulness of this dimension as one PPP project was built to attain specific objectives and meet specific demands. Furthermore, the project management group of a PPP does not account for any budget for future marketing or expansion to meet market demand. In the case of extra demand or expansion, the government launched a separate project, even if expansion was required in the current project. For future expansions in the operational project, separate planning was conducted, and a separate agreement was prepared. Nevertheless, the government needs to account for future demand and create future plans for projects that are connected. Therefore, unlike normal business projects, future preparation or market expansion is not carried out for a specific PPP project. This finding is consistent with the characteristics of a PPP project in a study conducted by Peters (Citation1998), who explained that every PPP project is a one-off transaction and for a defined period. However, the period of agreement may vary depending on the type of PPP project.
Based on the above discussion, a project is considered successful if it is completed within the budgeted cost, within the scheduled time, delivers the desired services, obtains all its objectives, and satisfies all the stakeholders.
4.2. The Relationship between the success factors and the PPP project’s success
The first category, technology and relationship factors (path coefficient = 0.134, t-value = 1.837, p-value = 0.1) have a significantly strong positive effect on a PPP project’s success. This implies that, for PPP project success, the commitment of the partners plays a vital role. This result is consistent with the argument made by Villani et al. (Citation2017) that for value creation in the PPP project, a long-term technology commitment and commitment among the partners are necessary.
The second category, the procurement factors, includes factors such as strong private consortium, competitive procurement process, and transparency in the procurement process. The selection of an SPV (path coefficient = 0.123, t-value = 2.185, p-value = 0.05) has a significant positive effect on a PPP project’s success, which implies the vital role of the selection of strong SPV in a PPP project’s success. The combination of the three factors in the second category and their significant impact on PPP project success suggests that the selection of a strong SPV is the result of the competitive procurement process and transparency in the procurement process. Moreover, this result is consistent with Chan’s (Citation2010) findings that recommend a transparent and competitive procurement process, which results in a strong SPV. Thus, procurement factors are imperative to achieve PPP project success.
The third category is the organised public agency and planning phase factors, which comprise appropriate risk allocation and risk sharing, well-organised public agency, thorough and realistic cost/benefit assessment, and multi-benefit objectives that significantly positively affect (path coefficient = 0.326, t-value = 2.861, under p-value = 0.05) the PPP project’s success. The significance of the planning phase factor is in line with Soomro and Zhang (Citation2013), who reported the failure of many PPP projects in the planning stage. Ahmad et al. (Citation2018a) also considered the planning stage to be essential for PPP project success.
The fourth category, macroeconomic factors, has a positive significant effect (path coefficient = 0.151, t-value = 1.714, under p-value = 0.1) on PPP project success. This result supports the argument of Li (Citation2005) that the government can help the PPP project by creating and maintaining a stable macroeconomic environment by manipulating economic policies to ensure stable prices.
The fifth category is agreement factors that include factors such as clearly defined responsibilities and roles along with the clarification of contract documents. They have highly significant (path coefficient = 0.173, t-value = 3.138, under p-value = 0.05) positive effects on PPP project success.
4.3. Moderating effect of the type of PPP project
The significant differences in the path coefficients of C3 (organised public agency and planning phase factors) and C1 (technology and relationship factors) reveal that both of these categories have a different impact on PPP project success for each type. This result strengthens the findings of Ahmad et al. (Citation2018) that the BLMT projects are different from other types of PPP projects.
5. Conclusion
The study concludes that PPP project success is different from the project success of other projects found in project management and requires additional measurement items to measure its dimensions. In a PPP project’s success, the quality phenomenon plays a vital role because the satisfaction of the stakeholder is based on service quality.
The study categorises the success factor into five categories, and each category of success factor has a significant impact on the PPP project. Based on the path coefficients, the study concludes that the public agency and planning phase factors have the highest impact, and the related factors have the least effect on a PPP project’s success. Moreover, agreement factors have a significant effect on PPP projects.
Although each category affects PPP project success, the effect of a few factors depends on the type of PPP factor. The study concludes that the effect of the relationship and planning factor depends on the type of PPP project because each type is different in nature. Thus, the planning and relationship of public and private partners differ depending on the type of PPP project.
Additional information
Funding
Notes on contributors

Hamid Waqas
Dr Usman Ahmad is Assistant Professor at DHA Suffa University. Dr Ahmad has conducted research on Malaysian Public Private Partnerships (PPP), in particular, risk management, financial management and project success of PPP projects. Dr Ahmad has profound expertise and interests in risk management, project management, fraud risk management, credit risks, public finance and international finance.
Dr. Hamid Waqas is Senior lecturer at Westminster International University in Tashkent (WIUT) Uzbekistan. He wrested expertise in Corporate Finance, Investment Risk management and Financial Management. He has diversified research interests consisting on leadership and industrial safety management practices, economic growth, capital structure, public private partnership, financial distress and portfolio diversification.
Dr. Kashif Akram is currently serving as an assistant professor at the department of Management and HRM, school of business management and administrative sciences, IUB. His research interests are strategic management, knowledge management and innovation in organizations particularly in public higher education institutions.
References
- Abdul-Aziz, A. R., & Jahn Kassim, P. S. (2011). ‘Objectives, success and failure factors of housing public-private partnerships in Malaysia’, Habitat international. Elsevier Ltd, 35(1), 150–31. https://doi.org/https://doi.org/10.1016/j.habitatint.2010.06.005
- Ahmad, U., Ibrahim, Y., & Abu Bakar, A. (2018a). MALAYSIAN PUBLIC PRIVATE PARTNERSHIP. Academy of Accounting and Financial Studies Journal, 22, 1–6. https://www.abacademies.org/articles/malaysian-public-private-partnership-7076.html
- Ahmad, U., Ibrahim, Y., & Abu Bakar, A. (2018b). Malaysian public private partnership projects: project success definition. International Journal of Engineering & Technology, 7(3.30), 33–37. https://doi.org/https://doi.org/10.14419/ijet.v7i3.30.18151
- Ahmad, U., Ibrahim, Y., & Minai, M. (2017). Public private partnership in Malaysia: the differences in perceptions on the criticality of risk factors and allocation of risks between the private and public sectors. International Review of Management and Marketing, 7(2), 138–150. https://econjournals.com/index.php/irmm/article/view/3983
- Ahmad, U., Ibrahim, Y., & Minai, M. S. (2018). Malaysian public–private partnerships: risk management in build, lease, maintain and transfer projects. Cogent Business & Management, 5 (1), 1–25. Edited by D. Tokic. Cogent OA. https://doi.org/https://doi.org/10.1080/23311975.2018.1550147
- Akintoye, A. (2001). The financial structure of private finance initiative projects.
- Ameyaw, E. E., & Chan, A. P. C. (2016). Critical success factors for public-private partnership in water supply projects. Facilities, 34(3/4), 124–160. https://doi.org/https://doi.org/10.1108/F-04-2014-0034
- Atkinson, R. (1999). Project management: Cost, time and quality, two best guesses and a phenomenon, its time to accept other success criteria. International Journal of Project Management, 17(6), 337–342. https://doi.org/https://doi.org/10.1016/S0263-7863(98)00069-6
- Baccarini, D. (1999). The logical framework method for defining project success. Project Management Journal, 30(4), 25–32. https://doi.org/https://doi.org/10.1177/875697289903000405
- Beh, L.-S. (2010). Development and distortion of Malaysian public-private partnerships - patronage, privatised profits and pitfalls. Australian Journal of Public Administration, 69, S74–S84. https://doi.org/https://doi.org/10.1111/j.1467-8500.2009.00655.x
- Bennett, E. (1998). Public-Private Co-operation in the Delivery of Urban Infrastructure Services (Water and Waste. PPPUE Background Paper, UNDP/Yale Collaborative Programme
- Boyfield, K. (1992). Private sector funding of public sector infrastructure. Public Money and Management, 12(2), 41–6.
- Boynton, A. C., Robert,,, & Sloan, Z. (1984). Management Review (pre-1986).
- Chan, A. P. C. (2010). Critical success factors for PPPs in infrastructure developments: chinese perspective. Journal of Construction Engineering and Management, 136(5), 484–494. https://doi.org/https://doi.org/10.1061/(ASCE)CO.1943-7862.0000152
- Chandra, H. P. (2015). Structural equation model for investigating risk factors affecting project success in Surabaya. Procedia Engineering, 125, 53–59. Elsevier B.V. https://doi.org/https://doi.org/10.1016/j.proeng.2015.11.009
- Cohen, J. (1988). Statistical Power Analysis for the Behavioral Sciences. Hillsdle
- Conway, J. M., & Huffcuit, A. I. (2003). A review and evaluation of exploratory factor analysis practices in organizational research. Organizational Research Methods, 6(2), 147–168. https://doi.org/https://doi.org/10.1177/1094428103251541
- Cooke-Davies, T. (2002). The “real” success factors on projects. International Journal of Project Management, 20 (3), 185–190. Pergamon. https://doi.org/https://doi.org/10.1016/S0263-7863(01)00067-9
- Creswell, J. W. (2017). Research design : Qualitative, quantitative, and mixed method approaches. Sage Publications.
- Cserháti, G., & Szabó, L. (2014). The relationship between success criteria and success factors in organisational event projects. International Journal of Project Management, 32(4), 613-624. https://doi.org/https://doi.org/10.1016/j.ijproman.2013.08.008
- De Wit, A. (1988). Measurement of project success. International Journal of Project Management, 6(3), 164–170. Accessed 28 July 2018. https://doi.org/https://doi.org/10.1016/0263-7863(88)90043-9
- DeVellis, R. F. (2016). Scale development: Theory and applications. Sage Publications.
- Field, A. (2013). Discovering statistics using IBM SPSS statistics (4th edn). Sage Publication. 4th edn.
- Fischer, K. (2010). An integrated risk management system (IRMS) for PPP projects. Journal of Financial Management of Property and Construction, 15(3), 260–282. https://doi.org/https://doi.org/10.1108/13664381011087515
- Grant, T. (1996). Key to Successful public-private partnership. Candaian Business Review, 23, 27–28.
- Grunert, K., & Ellegaard, C. (1992). The concept of key success factors: Theory and method. Available at: (Accessed: 30 December 2018). https://pure.au.dk/ws/files/32299581/wp04.pdf
- Hair, J. F., Jr, Hult, G. T. M., Ringle, C., & Sarstedt, M. (2016). A primer on partial least squares structural equation modeling (PLS-SEM). Sage Publications.
- Hwang, B. G., Zhao, X., & Gay, M. J. S. (2013). Public private partnership projects in Singapore: factors, critical risks and preferred risk allocation from the perspective of contractors. International Journal of Project Management, 31 (3), 424–433. Elsevier Ltd and IPMA. https://doi.org/https://doi.org/10.1016/j.ijproman.2012.08.003
- Ika, L. A. (2009a). Project success as a topic in project management journals. Project Management Journal, 40(4), 6–19. https://doi.org/https://doi.org/10.1002/pmj.20137
- Ika, L. A., Diallo, A., & Thuillier, D. (2010). Project management in the international development industry: the project coordinator’s perspective. International Journal of Managing Projects in Business, 3(1), 61–93. https://doi.org/https://doi.org/10.1108/17538371011014035
- Ika, L. A., Diallo, A., & Thuillier, D. (2012). Critical success factors for world bank projects: an empirical investigation. International Journal of Project Management, 30(1), 105–116. https://doi.org/https://doi.org/10.1016/j.ijproman.2011.03.005
- Ismail, S. (2013a). Critical success factors of public private partnership (PPP) implementation in Malaysia. Asia-Pacific Journal of Business Administration, 5(1), 6–19. https://doi.org/https://doi.org/10.1108/17574321311304503
- Ismail, S. (2013b). Factors attracting the use of public private partnership in Malaysia. Journal of Construction in Developing Countries, 18(1), 95–108. http://web.usm.my/jcdc/vol18_1_2013.htmlhttp://web.usm.my/jcdc/vol18_1_2013/art6_jcdc18-1.pdf
- Jefferies, M., Gamson, R., & Steve, R. (2002). Title critical success factors of the BOOT procurement system: reflections from the stadium Australia case study. Engineering, Construction and Architectural Management, 9(4), 352–361. https://doi.org/https://doi.org/10.1108/eb021230
- Ke, Y. (2009). Research trend of public-private partnership in construction journals. Journal of Construction Engineering and Management, 135(10), 1076–1086. https://doi.org/https://doi.org/10.1061/(ASCE)0733-9364(2009)135:10(1076)
- Kopp, J. C. (1997). Private capital for public works : Designing the next-generation franchise for public-private partnerships in transportation infrastructure. https://trid.trb.org/view/854087
- Li, B. (2003). Risk Management of Construction Public Private Partnership Projects. https://ethos.bl.uk/OrderDetails.do?uin=uk.bl.ethos.270518
- Li, B. (2005). Critical success factors for PPP/PFI projects in the UK construction industry. Construction Management and Economics, 23(5), 459–471. https://doi.org/https://doi.org/10.1080/01446190500041537
- Markom, R., Rabiah, E., & Engku, A. (2012). a legal analysis of successful and (Bot) projects in Malaysia. International Journal of Business and Society, 13(2), 133–150. http://www.ijbs.unimas.my/index.php/vol-13-no-2-2012/172-a-legal-analysis-of-successful-and-problematic-build-operate-and-transfer-bot-projects-in-malaysia
- Muller, R., & Turner, R. (2007). Evaluating the anti-angiogenic properties of iloprost and dipyridamole in the chick embryo chorioallantoic membrane model. European Management Journal, 25(34), 298–309.
- Munns, A. K., & Bjeirmi, B. F. (1996). The role of project management in achieving project success. International Journal of Project Management, 14(2), 81–87. Accessed 28 July 2018. https://doi.org/https://doi.org/10.1016/0263-7863(95)00057-7
- Osei-Kyei, R. (2017). Critical success criteria for public-private partnership projects: International experts’ opinion. International Journal of Strategic Property Management, 21(1), 87–100. https://doi.org/https://doi.org/10.3846/1648715X.2016.1246388
- Osei-Kyei, R., & Chan, A. P. C. (2018). Evaluating the project success index of public-private partnership projects in Hong Kong: the case of the cross harbour tunnel. Construction Innovation, 18(3), 371–391. https://doi.org/https://doi.org/10.1108/CI-08-2017-0067
- Peters, B. (1998). ‘“With a little help from our friends”: Public-private partnerships as institutions and instruments. In Partnerships in urban governance (pp. 11–33). Springer.
- Pinto, J. K., & Slevin, D. P. (1988). Project success. Project Management Journal, 4(67–72). Accessed 28 July 2018. https://www.pmi.org/learning/library/project-success-definitions-measurement-techniques-5460
- Qiao, L. (2001). Framework for critical success factors of BOT projects in China create new project “Political risk quantification” view project captial structure optimization for public-private partnership projects view project. Article in the Journal of Structured Finance.
- Ramayah, T. (2018). Partial Least Squares Structural Equation Modelling (PLS-SEM) using SmartPLS 3.0: An Updated Practical Guide to Statistical Analysis. Pearson.
- Ramayah, T., Cheah, J., Chuah, F., Ting, H., & Memon, M. A. (2018). Partial least squares structural equation modeling (PLS-SEM) using smartPLS 3.0.
- Rockart, J. F. (1979). Chief executives define their own data needs. Harvard Business Review, 57(2), 81–93. Accessed 30 December 2018.
- Rockart, J. F. (1982). THE CHANGING ROLE OF THE INFORMATION SYSTEMS EXECUTIVE: A CRITICAL SUCCESS FACTORS PERSPECTIVE.
- Sekaran, U., & Bougie, R. (2016). Research methods for business: A skill building approach (2nd edn). John Wiley & Sons. doi: https://doi.org/10.13140/RG.2.1.1419.3126.
- Shenhar, A. J. (2001). Project success: A multidimensional strategic concept. Long Range Planning, 34(6), 699–725. https://doi.org/https://doi.org/10.1016/S0024-6301(01)00097-8
- Shenhar, A. J., Levy, O., & Dvir, D. (1997). Mapping the dimensions of project success. Project Management Journal, 28(2), 5–13. http://www.reinventingprojectmanagement.com/material/other/7.%20Mapping%20dimensions%20of%20projects%20success%20PMJ%201997.pdf
- Soomro, M. A., & Zhang, X. (2013). Failure links between public and private sector partners in transportation public private partnerships. Journal of Traffic and Logistics Engineering, 1(2), 116–121. https://doi.org/https://doi.org/10.12720/jtle.1.2.116-121
- Stonehouse, J. H., Hudson, A. R., & O’Keefe, M. J. (1996). Private-public partnerships: The toronto hospital experience. Candaian Business Review, 23, 17–20.
- Tan, J. (2012). The pitfalls of water privatization: failure and reform in Malaysia. World Development, 40 (12), 2552–2563. Pergamon. https://doi.org/https://doi.org/10.1016/j.worlddev.2012.05.012
- Thomas, G., & Fernández, W. (2008). Success in IT projects: A matter of definition?. International Journal of Project Management, 26(7). https://doi.org/https://doi.org/10.1016/j.ijproman.2008.06.003
- Villani, E., Greco, L., & Phillips, N. (2017). Understanding value creation in public-private partnerships: A comparative case study. Journal of Management Studies, (6). https://doi.org/https://doi.org/10.1111/joms.12270
- Westerveld, E. (2003). The project excellence model®: linking success criteria and critical success factors. International Journal of Project Management, 21(6), 411–418. https://doi.org/https://doi.org/10.1016/S0263-7863(02)00112-6
- Whiteley, A. (1998). Planning the Qualitative Research Interview. Accessed 30 December 2018. https://espace.curtin.edu.au/bitstream/handle/20.500.11937/7790/20924_downloaded_stream_380.pdf?sequence=2
- Yescombe, E. (2011). Public-private partnerships: Principles of policy and finance. Accessed 27 July 2018.
- Yong, A. G., & Pearce, S. (2013). A beginner’s guide to factor analysis: focusing on exploratory factor analysis. Tutorials in Quantitative Methods for Psychology, 9(2), 79–94. https://doi.org/https://doi.org/10.20982/tqmp.09.2.p079