
 ?Mathematical formulae have been encoded as MathML and are displayed in this HTML version using MathJax in order to improve their display. Uncheck the box to turn MathJax off. This feature requires Javascript. Click on a formula to zoom.
Abstract
In this study, we examine the behavior of stock price changes in an emerging market to search for possible momentum incidents. Our findings indicate that the existence of momentum can be characterized by the state of the economy, which is significantly correlated with the down market. We argue that this is due to investors, who have diminishing marginal utility of wealth and, in turn, behave in a risk-averse manner, resulting in loser portfolios being responsible for the vast majority of the observed momentum profitability. Furthermore, we find that momentum profitability is stronger with longer formation and holding periods, despite few cases of winners’ return reversals. Our findings remain robust after controlling for size and book-to-market and earnings-to-market ratios.
PUBLIC INTEREST STATEMENT
This case study examined if stock investors can yield excess returns from trading based on stocks’ past prices. More specifically, it investigates if stock investors can earn positive returns when they buy the best 20% performing stocks and simultaneously sell the worst 20% performing stocks, using a sample consisting of all publically listed banks in Jordan covering the period 2000-2018. The Jordanian banking sector is robust and mature. The Amman Stock Exchange (ASE) is one of the emerging markets in the Middle East and is found to be the closest to being efficient compared to other markets in the Middle East region, making it attractive for investors seeking maximizing their wealth, as well as to policy-makers and readers interested in improving their understanding of stock price movements.
1. Introduction
Short-term and long-term stock price behavior has been a research area that has attracted significant research papers from both developed and developing markets for a long time. One such behavior that has proven to consistently exist and systematically last, across different time intervals and countries for periods as long as one year, is momentum. Since the classical paper of Jegadeesh and Titman (Citation1993) (henceforth JT), a series of research papers have provided evidence of momentum behavior from many countries besides the US (e.g., Zhu et al., Citation2019), including European countries (e.g., Abourachid et al., Citation2017), Japan (Chang et al., Citation2018), China (e.g., Zhang et al., Citation2019;; Gang et al., Citation2019), Taiwan (e.g., Lin et al., Citation2016), India (e.g., Ansari & Khan, Citation2012), Ireland (O’Donnell & Baur, Citation2009), Tunis (Boussaidi & Dridi, Citation2020), and Jordan (Saleh, Citation2007).
Existing research provides inconclusive evidence for the patterns that momentum can adopt. Some researchers find that momentum is market specific, both in terms of timing and profitability. For example, Cooper et al. (Citation2004) relate momentum profits to the market state, Asem and Tian (Citation2010) assert momentum returns to market dynamics, and Grobys (Citation2014) documents the negative effect of recessionary periods on momentum profits. Other researchers find that market states are unable to explain momentum returns (Galariotis et al., Citation2014;; Cheema & Nartea, Citation2017).
This unresolved evidence has prompted the search for explanations on such persistent phenomena that are able to outperform the market. While some of the proposed explanations attribute the outperformance of the momentum strategy to the inability of the models that were used in predicting returns to fully capture risk factors, other explanations are behavioral in the sense that they question investor rationality. Investor irrationality has been explained through the underreaction hypothesis (Atilgan et al., Citation2020; Barberis et al., Citation1998; Boussaidi & Dridi, Citation2020; Hong & Stein, Citation1999), overconfidence and overreaction hypothesis (Daniel et al., Citation1998), market state (Cooper et al., Citation2004), market conditions (Abourachid et al., Citation2017), market dynamics (Asem & Tian, Citation2010; Lin et al., Citation2016), individualism (Chui et al., Citation2010), and governance effectiveness (Sherif & Chen, Citation2019).
In this study, we investigate the pattern of momentum behavior in the Jordanian stock market (henceforth, Amman Stock Exchange (ASE)). While most emerging markets are inefficient, the ASE is found to be the closest to being efficient in comparison with other markets in the Middle Eastern region (Lagoarde-Segot & Lucey, Citation2009). We contribute to the existing momentum literature by providing evidence on the profitability of the momentum strategy using data for all banks listed on ASE during the 2000–2018 period, as the Jordanian banking sector is robust and mature.Footnote1
This study differs from previous research in several respects. First, unlike Saleh (Citation2007), we use the buy-and-hold strategy to assess portfolio returns instead of the cumulative abnormal returns (CARs) approach.Footnote2 Second, we recalculate market capitalizations for all banks in the post-formation period while calculating the value-weighted buy-and-hold returns. Finally, we extend the study period from 2000 to 2018, which enhances the robustness of our results because it includes the global financial crisis of 2009.
The rest of the paper is organized as follows: Section Two is the literature review, Section Three presents the empirical methodology used to form the portfolios and measure their performance, Section Four discusses the results, and Section Five provides the concluding remarks of the paper.
2. Literature review
A considerable number of anomalous phenomena show that stock returns are predictable based on past returns, and therefore, contradicts the main premise of randomness in stock returns introduced by the efficient market hypothesis. JT (Jegadeesh & Titman, Citation1993) make a change in this line of research by documenting evidence on short-term return predictability. They show that over intermediate periods of three to twelve months, stocks that performed well/bad will continue with the same performance for subsequent periods.
Following the work of JT (Jegadeesh & Titman, Citation1993), further research was conducted to examine the existence of momentum in different markets (developed and emerging markets). Chan et al. (Citation1996), for example, provide evidence, which confirms the findings of JT (Jegadeesh & Titman, Citation1993), of the existence of momentum in US markets and show that market participants respond slowly to news. Internationally, Rouwenhorst (Citation1998) provides evidence of the presence of momentum in 12 European markets, which lasted for nearly one year. Patro and Wu (Citation2004) find positive and striking hedge portfolio returns that result from buying winners and selling losers from before. Similarly, Naranjo and Porter (Citation2007) find that momentum trading strategies are profitable in both developed and emerging markets. Saleh (Citation2007) shows that in the Jordanian stock market, losers continue to have poor performance over 3-month to 36-month periods. O’Donnell and Baur (Citation2009) examine the profitability of momentum strategies in the Irish stock market and find that these strategies generate positive returns. Ansari and Khan (Citation2012) and Sehgal and Jain (Citation2015) provide evidence of the persistence of momentum profits in the Indian stock exchange. Vo and Truong (Citation2018) employ a sample of firms listed in the Vietnam stock market, covering the 2007–2015 period. They find evidence that a momentum investing strategy based on a formation period of 6 months and a holding period of 9 months generated positive returns. Gang et al. (Citation2019) study momentum in the Chinese equity market in the 2006–2017 period and find that momentum is profitable for horizons shorter than one week, compared to longer periods in the US, lasting up to one year. They stress that the number of individual equity investors is higher in China than in the US, leading to frequent deviations from fundamentals. Institutional investors, trying to benefit from this deviation, become sensitive to the information contained in reported cash flows. As a result, opposite institutional investor behavior has been observed in China, compared to the US, regarding reported cash flows; whereas institutional investors overreact in China, they underreact in the US.
Grobys (Citation2014) considers a sample of 21 foreign stock indices covering a period from 1997 to 2013 and observes statically positive returns on zero-cost quartile momentum portfolios. However, these returns become statically negative when the researcher includes a dummy variable of 1 in the regression, representing a recessionary period, and 0 otherwise. He justifies these so-called “momentum crashes” as being the result of price reversals following remarkably severe market declines, like in March and April of 2009. Daniel and Moskowitz (Citation2016) document momentum crashes, where the market reverts momentum strategies and produces negative returns that are infrequent and persistent. This occurs mainly during market downturns and periods of high volatility prices.
Following the evidence presented in the literature on the presence of the momentum phenomenon, a new line of empirical research has emerged exploring possible explanations for the profitability of momentum strategies. This line of research consists of two strands. The first strand employs risk factor models to explain momentum profits; that is, the returns that result from momentum strategies represent a compensation for some sort of risk. Fama and French (Citation1996) failed to explain momentum using their three-factor model and argued that data problems and irrational pricing could be possible explanations. Chordia and Shivakumar (Citation2002) and Avramov and Chordia (Citation2006) find that the momentum effect is explained by the mispricing of risk models, which varies with business cycle variables. Ansari and Khan (Citation2012) find that both the Capital Asset Pricing Model (CAPM) and the Fama-French models fail to explain the momentum returns in the Indian market and argue that behavioral factors could be the main source of this phenomenon. Moreover, Sehgal and Jain (Citation2015) prove the failure of the CAPM and the Fama-French models in explaining this anomaly. However, they provide evidence that momentum profits are partially explained by lagged macroeconomic factors, and thus, the reasons behind the profitability of momentum strategies could be partially rational and partially behavioral reasons.
The second strand of research is based on behavioral explanations. This strand has emerged because of the failure of risk-based models in explaining the sources of momentum profits. The behavioral models introduced in the literature argue that the profitability of momentum strategies results from biases in market participants’ interpretation of information arriving in the market. In other words, the irrationality of market agents is the driving force behind market prices. Barberis et al. (Citation1998) argue that momentum results from the slow reaction (i.e., underreaction) of investors to reported news of cash flow. That is, due to conservatism, market participants show slow adjustment of their belief in new evidence (i.e., new information). Hong and Stein (Citation1999), in their model, show that underreaction results from a group of traders, “news watchers,” who lay the foundations for the other group, “momentum traders,” to exploit this underreaction to create excessive momentum in stock prices.
In a pioneering study, Cooper et al. (Citation2004) explored the market state in momentum. Their research builds on the behavioral theory of overconfidence and overreaction proposed in an earlier work by Daniel et al. (Citation1998), who assume that investors are overconfident in the short run about share prices good news and, in turn, refer to the success of their own skills, leading them to overreact, which causes the momentum anomaly. Cooper et al. (Citation2004) test the overreaction theory of momentum profits based on the state of the market, defined as the up market (the case of positive market returns for a lagged 36 months) and the down market (the case of negative market returns for a lagged 36 months), just before establishing momentum portfolios. The expectation here is that, as investors gain positive returns after the up market, they gain overconfidence and then overreact, causing enhanced momentum profits in the short run. The findings support the expectation that momentum portfolios are profitable just by following periods of market positive returns, but it is limited to a certain level where investors may start their correctional reversal trading.
Asem and Tian (Citation2010) investigate market dynamics and momentum profits and argue that momentum profits are mainly driven by confirming market movements. That is, when the market continues rather than when it transits its state, it leads to investor overconfidence and overreaction. They find that momentum profits exist only following up markets (not following down markets) and mainly when the markets continue UP. On the other hand, despite the large momentum profits in following down markets when they continue, there are also large momentum losses when down markets revert (transit), leading to offsetting profits.
Contrastingly, in clear contradiction of the US findings, Galariotis et al. (Citation2014) demonstrate that market states are unable to explain momentum returns for UK firms. More importantly, employing Chinese firms’ data for the 1995–2015 period, Cheema and Nartea (Citation2017) provide evidence contradicting that of the US. They find positive momentum profits exclusively on following down (but not up) market states. However, in partial agreement with the findings of Asem and Tian (Citation2010), Cheema and Nartea (Citation2017) find that momentum profits are more evident when holding the same market state only for the down state.
Another explanation for momentum profitability is provided by Sherif and Chen (Citation2019), who find a momentum effect based on international evidence covering the period from 2002 to 2015. They propose that accountability and level of corruption distort governance effectiveness, which negatively affects financial markets’ stability. Therefore, their study concluded that the variables mentioned explain the observed momentum profitability. Additionally, Chui et al. (Citation2010) examine the effect of psychological biases (“individualism”) on momentum profits and find that cultural differences affect the returns generated by momentum strategies.
Momentum behavior is not limited to stock prices; it is also found in other asset classes, such as currencies (Okunev & White, Citation2003), commodities (Erb & Harvey, Citation2006), exchange-traded futures contracts (Moskowitz et al., Citation2012), bonds (Jostova et al., Citation2013), and commodity futures (Paschke et al., Citation2020).
3. Data and methodology
3.1. Data
The main data consist of monthly returns for all 15 banks listed on the ASE, covering the period from 1 January 2000, to 31 December 2018.Footnote3 Because no stock return files are available at ASE, we had to calculate them for the sample banks. Monthly share prices for all banks listed on ASE over the study period were collected from the ASE’s official website and modified retrospectively to account for all capital changes, including stock splits, stock dividends, and right issues.Footnote4
These data are gathered from the official website of the Securities Depository Center.Footnote5 Then, the returns for each bank were calculated as the change in price plus dividends scaled by the beginning-of-period prices. Finally, share market capitalizations, as well as book-to-market and earnings to market ratios, were used to assess the portfolio risk. Since stock markets in different countries witness momentum anomalies over different periods, and these markets vary significantly in the way that they are structured, in their trading mechanisms, and most importantly, in terms of their investor base, we argue that risk-based explanations cannot be ruled out.
3.2. Methodology
This research explores the momentum investing strategy, using all the banks listed on ASE in the 2000–2018 period; they are categorized according to four main formation periods, along with four holding periods. This results in a matrix of 16 (formation-F)-(holding-H) strategies.Footnote6 Specifically, following the methodology of Vo and Truong (Citation2018), shares are individually sorted at the beginning of each month (t), based on their buy-and-hold raw returns over the last F months (t—3, 6, 9, 12), from the lowest to the highest; thus, two portfolios are created. The first portfolio consists of the lowest 20% of the shares’ buy-and-hold raw returns, labeled as losers (L). The second portfolio represents the highest 20% of the shares’ buy-and-hold raw returns, labeled as winners (W).Footnote7
The buy-and-hold returns are calculated as follows:
where Rit is the returns for bank i in month t.
To assess the existence of any momentum anomaly, we create momentum hedge portfolios defined as buying past winners and selling past losers short.Footnote8 After that, the post-formation buy-and-hold returns for the loser, winner, and momentum hedge portfolios are calculated over the next H (t + 3, 6, 9, 12) months.Footnote9
In summary, we assess momentum profitability using a total of 3,424 portfolio formations distributed as 874, 862, 850, and 838 for the main formation strategies F3, F6, F9, and F12, respectively.
Furthermore, portfolio returns for the winners and losers are calculated in two ways: first, on an equally-weighted basis, and second, on a value-weighted basis.Footnote10
Under the method for calculating value-weighted portfolio returns, some complexity exists, as we do not use the shares’ market capitalizations directly as given by the ASE files for the entire holding period (i.e., 3, 6, 9, and 12 months). Market capitalization provided by ASE is used only for the initial amount of investment at the beginning of the first month of each holding period. A share’s market capitalization at the beginning of each of the remaining 2, 5, 8, and 11 months included in the holding periods H3, H6, H9, and H12, respectively, are then created based on its corresponding monthly rates of return. Accordingly, we avoid the effect of transactions such as equity issues, mergers, acquisitions, etc., on the banks’ values.
Finally, following JT (Jegadeesh & Titman, Citation1993), the significance of the average monthly returns for the loser, winner, and zero-cost portfolios is measured using the Newey and West (Citation1987) standard errors to correct for any autocorrelation.
4. Results and discussion
If a momentum anomaly exists in ASE, then significant positive returns are made by a portfolio that consistently buys past winner portfolios and sells past loser portfolios short. Therefore, to decide whether the globally witnessed momentum anomaly applies to the ASE, we conducted a variety of tests, including those relating to size, book-to-market ratios, and earnings-to-market ratios, as robustness checks.
First, we present the average monthly buy-and-hold returns of the loser (L), winner (W), and hedge H (W-L) portfolios for all 16 formation-holding strategies, as shown in . shows the average returns of both the equally-weighted and value-weighted portfolios over the 2000–2018 period, along with the significance levels using the Newey-West standard error test.Footnote11
Table 1. All banks, covering the whole study period
While the returns of the loser and winner portfolios are positive and generally increase as the length of the holding period (H) becomes longer, the returns of the loser portfolios decrease and the returns of the winner portfolios increase as the length of the formation period (F) becomes longer mainly up to F9, after which returns on some portfolios start to revert. The results show that returns are indifferent from zero for all 16 hedge portfolios, with the highest insignificant average return being 0.55% per month for the F9H9 strategy. That is, there is no momentum effect for trading on the banking shares listed on ASE during the 2000–2018 period.
In the second analysis, we split the study period (2000–2018) into two equal sub-periods, for each of the four formation strategies F3, F6, F9, and F12. This procedure enables us to capture the effect of the market state on momentum, if any, as the second sub-period for all four formation strategies coincides with the financial crisis of 2009.Footnote12 Asem and Tian (Citation2010) argue that momentum profits are mainly driven by confirming market movements, leading to investor overconfidence and overreaction. To increase the robustness of this procedure, we clarify the timing and effect of the financial crisis on the Jordanian economy, considering the ASE as a whole including four main sectors: banking, insurance, services, and industry. plots the value traded, market capitalization, and income for the ASE, all in Jordanian dinars (JDs).
Figure 1. The ASE’s value traded, market capitalization, and net income, all in Jordanian dinars (JDs), for the 2005–2014 period
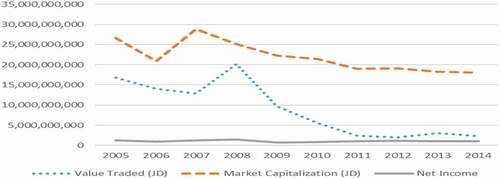
This figure shows a major and long-term drop in the value traded (−72%) that occurred during 2009 to 2010 and in the market capitalization (−23%) during the 2008–2009 period. In addition, it lost 45% of the income generated by all sectors included in the ASE during 2009–2010. However, this drop in market income appears for a short period, compared to the drop in the market value traded and market capitalization.
present the average monthly buy-and-hold returns of the loser (L), winner (W), and hedge H (W-L) portfolios of the first and second sub-periods, respectively, on a value-weighted basis.
Table 2. All banks, covering only sub-period (1)—“the period just before the financial crisis”
Table 3. All banks, covering only sub-period (2)—“the period just after the financial crisis”
The results in , covering the first sub-period (before the financial crisis), are similar to those in , covering the entire study period (2000–2018). The hedge portfolio returns are not different from zero for all 16 formation-holding momentum strategies, with evidence being stronger for the period before the financial crisis, compared to the whole period. Momentum hedge portfolio returns before the financial crisis are lower for formation strategy F3 and higher for formation strategies F6, F9, and F12 (except for F6H12 and F12H12).
Hedge portfolio returns were as high as 0.9% per month for F9H6 and 0.8% for F9H9, and being statistically indifferent from zero may suggest high volatility in share price movements during good economic times, such as the first sub-period (before the financial crisis).
presents the average monthly returns for the 16 momentum strategies during and after the financial crisis. The evidence in this table is unlike that of , which show significant value-weighted momentum returns of 0.3% per month for two momentum strategies: F9H12 and F12H12. This finding is consistent with that of Cheema and Nartea (Citation2017), who document that momentum profits are more evident when holding the same down market state.
Although current evidence supports that momentum is a market state phenomenon, having significant hedge returns for only two investing strategies out of 16 is quite low to accept or reject the existence of momentum in the ASE, which implies that additional investigation is needed.
In the next analysis, we consider the possible effects of the Arab Bank (the oldest and largest bank included in the study period) on the portfolios’ value-weighted returns.Footnote13
As shown in , we follow the Arab Bank about which portfolio it belongs to, over the study period, for each formation strategy: F3, F6, F9, and F12.
Table 4. The largest bank listed on the ASE—“the Arab Bank”
More specifically, since we allocate shares to loser and winner portfolios on a quintile basis, the Arab Bank is expected to be classified as a loser 20% of the time and as a winner 20% of the time, if its occurrence is evenly distributed.
For example, when considering F3, with a total number of 223 observations, the Arab Bank is expected to be classified as a loser bank and, similarly, as a winner bank on 45 occasions each (20% of 223). Unsurprisingly, we find that the Arab Bank has been classified as a loser remarkably much more than as a winner for the four formation strategies specified in the table.Footnote14 The Arab Bank lost a major part of its market value over several successive years. During the 2006–2014 period, the Arab Bank suffered from a negative rate of returns in seven out of nine years—2006, 2008, 2009, 2010, 2011, 2012, and 2014. The bank’s buy-and-hold raw return calculated over a period from 1 January 2006, to 31 December 2014, is negative at 59.76%. However, during the 2015–2018 period, the Arab Bank managed to recover part of its lost market capitalization in three out of four years and yielded a positive buy-and-hold raw return of 32.34%, calculated over a period from 1 January 2015, to 31 December 2018.
This, of course, raises concerns regarding the validity of all previous tests about whether such a particularly large observation may affect the findings in any systematic manner. As a result, we exclude the Arab Bank and repeat the above analysis and reproduce the results as shown in .
Table 5. All banks, except for the Arab Bank, covering the whole study period
Table 6. All banks, except for the Arab Bank, covering only sub-period (1)—“the period just before the financial crisis”
Table 7. All banks, except for the Arab Bank, covering only sub-period (2)—“the period just after the financial crisis”
summarizes the average monthly buy-and-hold returns of the (L), (W), and H (W-L) portfolios for the 16 formation-holding momentum strategies, but after excluding the Arab Bank.
As expected, since the results in are less vulnerable to the market capitalization of the extremely large bank due to its exclusion, portfolios’ buy-and-hold returns seem to be smoother than those in . In , we have significant positive value-weighted returns of 0.7% per month for the two momentum strategies, F9H9 and F12H6, compared to none in . Interestingly, Abourachid et al. (Citation2017) find that, in their sample of 10 European countries, only 4 out of 16 strategies are profitable, yielding extremely low returns, with the highest of 0.4% per month for strategy F6H9. Abourachid et al. (Citation2017) clarify that the observed low momentum returns may be due to the market conditions during the 2007–2012 period.
In addition, comparing the returns on a specific (L), (W), or (H) portfolio in and its corresponding returns in , we note the following: moving from to , loser portfolios’ returns are lower for all 16 portfolios, winner portfolios’ returns are higher in 10 cases, leading to increasing returns on 15 momentum portfolios out of 16.Footnote15 However, the results, regardless of the Arab Bank (), show reverted momentum returns for F12H9 and F12H12.
The results in are comparable to those of , in that both report the average monthly buy-and-hold returns for the first sub-period just preceding the financial crisis, except that excludes the effect of the Arab Bank.
As shown in , the results of also show momentum returns that are indifferent from zero for all 16 momentum strategies. Momentum hedge portfolio returns increase as the formation period increases up to F9, after which the momentum returns revert, mainly when the holding periods are H9 and H12. Moreover, comparing the returns between a specific (L), (W), or (H) portfolio in and its corresponding returns in , we observe that while loser portfolios’ returns are lower for all 16 portfolios, winner portfolios’ returns are higher for just 5 cases, leading to increasing returns on 14 momentum portfolios.Footnote16
Momentum returns for the period after the financial crisis, when the Arab Bank is excluded, are calculated in . The F3H3 strategy is the only strategy that yields a negative return. Similarly, Abourachid et al. (Citation2017) find that the only strategy that yields a negative return out of the same 16 momentum strategies is F3H3. Significant positive returns are observed for the six momentum-investing strategies.Footnote17 One is related to F6 [F6H12], two are related to F9 [F9H9 and F9H12], and three are related to F12 [F12H6, F12H9, and F12H12]. In a related context, Vo and Truong (Citation2018) report that momentum is profitable in 10 out of the 16 comparable momentum strategies.
Considering the difference in results between and , we find that loser portfolios’ returns are lower for 8 portfolios, while winner portfolios’ returns are higher for 15 portfolios, leading to increasing returns on 14 momentum portfolios.Footnote18
More importantly, shows that the returns on loser portfolios consistently decrease as the formation period increases, regardless of the length of the holding period (except for one case F12H12), while returns on winner portfolios slightly increase up to F9, then revert for the three holding periods: H6, H9, and H12.Footnote19
The findings in are in line with Cheema and Nartea (Citation2017), who document positive momentum profits exclusively following down (but not up) market states. Our findings indicating the existence of momentum following down markets are not necessarily contradictory to those of Asem and Tian (Citation2010), who use US data and propose that momentum profits are mainly driven by confirming market movements following up markets. This is because, in Asem and Tian (Citation2010), the large momentum profits observed when following down markets are offset by large momentum losses when down markets revert. In the Jordanian context, the large momentum profits observed following the down markets (beginning in 2009) became even stronger as the same state of the economy was confirmed to continue up to 2018. Saleh (Citation2007) reports that in the Jordanian stock market, losers continue to have poor performance over 3-months to 36-months periods.
This may suggest that momentum is a state of the economic phenomenon that works during recessionary periods, where investors face a higher risk of losing utility. Gleim and Flesher (Citation2018, p. 58) state that since most investors are risk-averse, “they have a diminishing marginal utility for wealth. In other words, the utility of additional increments wealth decreases. The utility of a gain for serious investors is less than the disutility of a loss of the same amount.” Moreover, using the Jordanian data, Ahmad and Abu-Ghunmi (Citation2021) propose that investors became more conservative after the financial crisis in 2009. If this is true, investors will become more risk-averse and, therefore, more sensitive toward the disutility of a loss. This, in turn, may justify the finding that most of the momentum returns for the period after the financial crisis have been found attributable to losers who possibly sold their bad luck investments trying to stop the disutility of loss, causing a rapid deterioration in the returns.
Finally, momentum hedge portfolio returns are stronger when the formation (F) and holding (H) periods are longer, increasing the likelihood that momentum hedge portfolio returns become statistically positive when the formation and test periods are longer than 6 months.
In the last section of our analysis, we test whether the observed momentum profits after the financial crisis in can be justified through any of the following well-known risk factors: size (banks’ market capitalization), book-to-market ratios, and earnings-to-market ratios. We also investigate if higher returns on winners compared to lower returns on losers can be considered as compensation for the additional risk associated with the former. The results in indicate that momentum profits are robust even after controlling for market capitalization, and book-to-market losers are found to be riskier than winners.
Table 8. All banks, except for the Arab Bank, covering only sub-period (2)—“the period just after the financial crisis.” Winner minus loser stocks portfolios’ financial aspects
Earnings-to-market is undifferentiated from zero for formation strategies F3, F6, and F9. However, there is evidence that earnings-to-market is slightly higher for winners for F12, suggesting a slim chance to justify the momentum profits for that strategy.
5. Conclusion
The momentum behavior in stock price changes is not confined by any particular country or market. In fact, evidence of its existence in both developed and developing countries has been widely documented in the literature. However, a large amount of inconclusive evidence exists for the profitability of momentum strategies and for the explanations proposed for the different patterns that it can take. Thus, this study aims to contribute to this line of research by investigating the incidence of momentum behavior in Jordan, which is a small yet relatively developed and stable market. This makes our results relevant for similar economies, at least. Our results have important implications for both researchers and practitioners. Put simply, our results indicate that momentum is a state of economic anomaly. We observe significant returns on the zero-cost hedge portfolio that buys past winners and sells past losers but only for the period following the financial crisis of 2009. We believe that this result is due to investors becoming more conservative (risk-averse) and more resentful toward the disutility of a loss, as they lose more of their wealth. This, in turn, justifies the finding that most of the momentum returns for the period after the financial crisis of 2009 were attributable to losers who sold their underperforming stocks in order to limit the disutility of loss, causing a rapid deterioration in returns. Furthermore, none of our risk factors, including winners’ and losers’ portfolios’ market capitalizations and book-to-market or earnings-to-market ratios can eliminate momentum returns. Second, momentum is profitable and even more so when portfolio formation and holding periods are longer despite the fact that, in a few cases, winners’ return reversals are observed after the formation period (F9). Finally, portfolios’ returns after the financial crisis are much lower compared to their returns before it, yet momentum hedge portfolio returns are significant for six strategies compared to none before the crisis, suggesting lower volatility in share price movements for the second sub-period.
Additional information
Funding
Notes on contributors

Ahmad Ahmad
Ahmad Ahmad completed his PhD in Accounting from University of Salford, Manchester, UK. He is currently Assisstant Proffesor of Accounting at Business School – The University of Jordan. Main areas of research interest are earnings management, investing strategies, market efficiency.
Adel Bino holding a PhD in Financial Economics from University of New Orleans, USA. He is currently Associated Professor of Finance at Business School – The University of Jordan. His research interests include Assets Pricing and Corporate Governance.
Mohammad Tayeh holding a PhD in Accounting and Finance from Durham Business School, University of Durham, UK. He is currently Associated Professor of Finance at Business School – The University of Jordan. His research interests include Market Microstructure, Assets Pricing, Corporate Governance, and Behavioral Finance.
Notes
1. As of 31 December 2018, the financial banking sector in ASE is large enough that it accounts for 59% and 82% of the ASE total market capitalization and total assets, respectively. Source is ASE (www.ase.com.jo)
2. This superiority of the buy-and-hold approach over the cumulative abnormal returns approach is supported by the findings of Blume and Stambaugh (Citation1983) and Barber and Lyon (Citation1997). The buy-and-hold approach is used in recent research by several studies, including Liu and Han (Citation2020), Jory and Ngo (Citation2017), Hegde et al. (Citation2020), and Dutta et al. (Citation2018). However, the last two papers use the CARs approach as well.
3. The choice of starting the study period as from 1 January 2000, is because the data required by this study is not available before that date. The ASE reports financial and return data for publicly listed companies starting from 1 January 2000.
4. Modifications are made following the methods employed by London Share Price Data (LSPD) issued by London Business School (Citation2006) as follows: for bonus issue, the adjustment is [Cum (Old) number of stocks divided by Ex number of stocks (Old+ New)]; for stock split/reverse split, the percentage of increase/decrease in the number of stocks is proportionate to the decrease/increase in exercise price on the effective date compared to the exercise price before the event; for raising capital through private subscription (also known as right issue), the adjustment is [Old Stocks* Cum Price (Old) + New Stocks* Issue Price]/[Ex (Old+ New) Stocks* Cum Price].
6. The momentum investing strategy can be summarized as buying past short-term winners and selling past short-term losers, as the expectation is that winners will continue to be winners and losers will continue to be losers, all on the short-run, defined as any period up to a year. Current stock prices, in different markets, may differ in response to past stock prices, based on when investors revert their expectations regarding the potential of their investments, making the strategy unprofitable. The sooner investors revert their investing expectations, the quicker the market reverts momentum strategies and possibly produces negative returns, which Daniel and Moskowitz (Citation2016) describes as “momentum crashes.” This is because reverting investors to their prior expectations will convert past winners into current losers, and similarly, convert past losers into current winners. Since JT (Jegadeesh & Titman, Citation1993), the matrix of 16 (formation- F)-(holding- H) strategies is employed by many to investigate the momentum strategy, including Abourachid et al. (Citation2017), Gang et al. (Citation2019), and Boussaidi and Dridi (Citation2020). However, some other researchers committed the formation period to be the lagged six months, then considered the following holding periods of 3, 6, 9, and 12 months, such as Cheema and Nartea (Citation2017), Chang et al. (Citation2018), and Lin et al. (Citation2016). Accordingly, we follow JT (Jegadeesh & Titman, Citation1993), among others, and use the matrix of 16 (formation- F)-(holding- H) strategies.
7. Following Cheema and Nartea (Citation2017), we sorted banks based on their past individual performance into 5 quintile portfolios. However, some other researchers sort stocks into decile portfolios (e.g., Cooper et al., Citation2004; Abourachid et al., Citation2017;; Zhu et al., Citation2019), then calculate returns on hedge portfolios, defined as (buying/selling) past (best/worst) 10% performing firms, respectively.
8. It is a common procedure for the vast majority of the work done in this area of research, to consider any momentum profits as equal to the average returns on winner portfolios minus the average returns on loser portfolios, along with the significance level for the difference (e.g., Cheema & Nartea, Citation2017; Vo & Truong, Citation2018;; Sherif & Chen, Citation2019).
9. Gang et al. (Citation2019) employ the same approach as Vo and Truong (Citation2018), except that they consider the monthly formation periods, F: (t-1, 3, 6, 9), and the monthly holding periods, H: (t + 1, 3, 6, 9).
10. Under the equally-weighted method, the portfolios’ raw returns in a month in their simple percentage form are equal to the arithmetic mean of all the shares’ returns outstanding in that month.
11. However, we only commit our discussion on the analysis we perform to the results obtained using the value-weighted approach, as it mitigates small firm effect when calculating portfolio returns. Yin and Wei (Citation2020) investigate the profitability of momentum strategies through only forming value-weighted zero-cost portfolios.
12. Using data for companies listed on major global stock exchange markets (including the New York Stock Exchange, London, Hong Kong, Tokyo, and Shanghai, among others), Syriopoulos and Bakos (Citation2019) consider that the global financial crisis had become evident from the year 2008. We believe that, for the Middle East region, the effect became more profound during the year 2009.
13. The Arab Bank represents 73% and 42% of total market capitalization for all banks listed on ASE as of 31 December 2000 and 2018, respectively.
14. The Arab Bank lost a significant portion of its market capitalization during the study period, as noted in footnote (14).
15. After excluding the Arab Bank, returns have become lower on loser portfolios and higher on winner portfolios, suggesting that its return during the whole study period (2000–2018) is higher than the average loser but lower than the average winner. However, since the Arab Bank has a tendency to be classified as a loser more than otherwise, it turns out that loser portfolios have become of higher influence, compared to winner portfolios, in determining the returns on momentum hedge portfolios.
16. During the whole study period, the Arab Bank suffered from successive losses in its share value. Therefore, its rate of return during the first sub-period will be better off, compared to the second sub-period, because of the increased effect of the relative influence of the successive losses. So, in the current analysis (the first sub-period after excluding the Arab Bank), the number of cases where returns on loser portfolios decreased is higher than the number of cases in which returns on winner portfolios increased. However, we would expect the opposite for the second sub-period.
17. Five of them at p-values that are sufficiently low, which is equal to or less than 5%.
18. As a result of excluding the Arab Bank, the higher number of cases in which returns on winner portfolios have increased and the lower number of cases in which returns on loser portfolios have decreased (during the second sub-period), compared to the first sub-period, were expected in footnote (17).
19. Vo and Truong (Citation2018) find that the momentum investing strategy based on a formation period of 6 months and a holding period of 9 months generates positive returns.
20. In addition, we repeat all of our statistical tests using the standard t-test, with no major differences to the findings in this paper, which were obtained using the Newey and West (Citation1987) standard error. We follow JT (Jegadeesh & Titman, Citation1993) and Atilgan et al. (Citation2020), who report the level of significance results for the portfolios’ average returns using the Newey-West. However, the t-statistics for the loser, winner, and hedge portfolios’ average returns are available for readers upon request.
References
- Abourachid, H., Kubo, A., & Orbach, S. (2017). Momentum strategies in European equity markets: Perspectives on the recent financial and European debt crises. Finance Research Letters, 23 (November), 147–20. https://doi.org/https://doi.org/10.1016/j.frl.2017.05.013
- Ahmad, A., & Abu-Ghunmi, D. (2021). Have investors in the banking sector become more conservative in the long run? Jordan Journal of Business Administration, 17 (2). forthcoming.
- Ansari, V. A., & Khan, S. (2012). Momentum anomaly: Evidence from India. Managerial Finance, 38(2), 206–223. https://doi.org/https://doi.org/10.1108/03074351211193730
- Asem, E., & Tian, G. Y. (2010). Market dynamics and momentum profits. Journal of Financial and Quantitative Analysis, 45(6), 1549‐1562. https://doi.org/https://doi.org/10.1017/S0022109010000542
- Atilgan, Y., Bali, T., Demirtas, K. O., & Gunaydin, A. D. (2020). Left-tail momentum: Underreaction to bad news, costly arbitrage and equity returns. Journal of Financial Economics, 135(3), 725–753. https://doi.org/https://doi.org/10.1016/j.jfineco.2019.07.006
- Avramov, D., & Chordia, T. (2006). Asset pricing models and financial market anomalies. The Review of Financial Studies, 19(3), 1001–1040. https://doi.org/https://doi.org/10.1093/rfs/hhj025
- Barber, B. M., & Lyon, J. D. (1997). Detecting long-run abnormal stock returns: The empirical power and specification of test statistics. Journal of Financial Economics, 43(3), 341–372. https://doi.org/https://doi.org/10.1016/S0304-405X(96)00890-2
- Barberis, N., Shleifer, A., & Vishny, R. (1998). A model of investor sentiment. Journal of Financial Economics, 49(3), 307–343. https://doi.org/https://doi.org/10.1016/S0304-405X(98)00027-0
- Blume, M. E., & Stambaugh, R. F. (1983). Biases in computed returns: An application to the size effect. Journal of Financial Economics, 12(3), 387–404. https://doi.org/https://doi.org/10.1016/0304-405X(83)90056-9
- Boussaidi, R., & Dridi, G. (2020). The momentum effect in the Tunisian stock market: Risk hypothesis vs. underreaction hypothesis. Borsa Istanbul Review, 20(2), 178–195. https://doi.org/https://doi.org/10.1016/j.bir.2020.01.002
- Chan, L. K. C., Jegadeesh, N., & Lakonishok, J. (1996). Momentum Strategies. The Journal of Finance, 51(5), 1681–1713. https://doi.org/https://doi.org/10.1111/j.1540-6261.1996.tb05222.x
- Chang, R. P., Ko, K., Nakano, S., & Rhee, S. (2018). Residual momentum in Japan. Journal of Empirical Finance, 45 (January), 283–299. https://doi.org/https://doi.org/10.1016/j.jempfin.2017.11.005
- Cheema, M. A., & Nartea, G. V. (2017). Momentum returns, market states, and market dynamics: Is China different? International Review of Economics and Finance, 50 (July), 85–97. https://doi.org/https://doi.org/10.1016/j.iref.2017.04.003
- Chordia, T., & Shivakumar, L. (2002). Momentum, business cycle, and time-varying expected returns. The Journal of Finance, 57(2), 985–1019. https://doi.org/https://doi.org/10.1111/1540-6261.00449
- Chui, A. C., Titman, S., & Wei, K. J. (2010). Individualism and momentum around the world. The Journal of Finance, 65(1), 361‐392. https://doi.org/https://doi.org/10.1111/j.1540-6261.2009.01532.x
- Cooper, M. J., Gutierrez, R. C., & Hameed, A. (2004). Market states and momentum. The Journal of Finance, 59(3), 1345‐1365. https://doi.org/https://doi.org/10.1111/j.1540-6261.2004.00665.x
- Daniel, K., Hirshleifer, D., & Subrahmanyam, A. (1998). Investor psychology and security market under- and overreactions. The Journal of Finance, 53(6), 1839‐1885. https://doi.org/https://doi.org/10.1111/0022-1082.00077
- Daniel, K., & Moskowitz, T. J. (2016). Momentum crashes. Journal of Financial Economics, 122(2), 221–247. https://doi.org/https://doi.org/10.1016/j.jfineco.2015.12.002
- Dutta, A., Knif, J., Kolari, J. W., & Pynnonen, S. (2018). A robust and powerful test of abnormal stock returns in long-horizon event studies. Journal of Empirical Finance, 47(June), 1–24. https://doi.org/https://doi.org/10.1016/j.jempfin.2018.02.004
- Erb, C. B., & Harvey, C. R. (2006). The strategic and tactical value of commodity futures. Financial Analysts Journal, 62(2), 69–97. https://doi.org/https://doi.org/10.2469/faj.v62.n2.4084
- Fama, E. F., & French, K. R. (1996). The CAPM is wanted, dead or alive. The Journal of Finance, 51(5), 1947–1958. https://doi.org/https://doi.org/10.1111/j.1540-6261.1996.tb05233.x
- Galariotis, E. C., Holmes, P., Kallinterakis, V., & Ma, X. S. (2014). Market states, expectations, sentiment and momentum: How naive are investors? International Review of Financial Analysis, 32(March), 1–12. https://doi.org/https://doi.org/10.1016/j.irfa.2013.12.004
- Gang, J., Qian, Z., & Xu, T. (2019). Investment horizons, cash flow news, and the profitability of momentum and reversal strategies in the Chinese stock market. Economic Modelling, 83(December), 364–371. https://doi.org/https://doi.org/10.1016/j.econmod.2019.08.021
- Gleim, I. N., & Flesher, D. L. (2018). CMA Review- part 2. Financial Decision Making. Gleim Publication, Inc.
- Grobys, K. (2014). Momentum in global equity markets in times of troubles: Does the economic state matter? Economics Letters, 123(1), 100–103. https://doi.org/https://doi.org/10.1016/j.econlet.2014.01.028
- Hegde, S., Seth, R., & Vishwanatha, S. R. (2020). Ownership concentration and stock returns: Evidence from family firms in India. Pacific-Basin Finance Journal, 61(June), 1–25. https://doi.org/https://doi.org/10.1016/j.pacfin.2020.101330
- Hong, H., & Stein, J. C. (1999). A unified theory of underreaction, momentum trading, and overreaction in asset markets. The Journal of Finance, 54(6), 2143–2184. https://doi.org/https://doi.org/10.1111/0022-1082.00184
- Jegadeesh, N., & Titman, S. (1993). Returns to buying winners and selling losers: Implications for stock market efficiency. The Journal of Finance, 68(1), 65–91. https://doi.org/https://doi.org/10.1111/j.1540-6261.1993.tb04702.x
- Jory, S., & Ngo, T. (2017). Firm power in product market and stock returns. The Quarterly Review of Economics and Finance, 65(August), 182–193. https://doi.org/https://doi.org/10.1016/j.qref.2016.09.008
- Jostova, G., Nikolova, S., Philipov, A., & Stahel, C. W. (2013). Momentum in corporate bond returns. The Review of Financial Studies, 26(7), 1649–1693. https://doi.org/https://doi.org/10.1093/rfs/hht022
- Lagoarde-Segot, T., & Lucey, B. M. (2009). Shift-contagion vulnerability in the MENA stock markets. The World Economy, 32(10), 1478‐1497. https://doi.org/https://doi.org/10.1111/j.1467-9701.2009.01204.x
- Lin, C., Ko, K., Feng, Z., & Yang, N. (2016). Market dynamics and momentum in the Taiwan stock market. Pacific-Basin Finance Journal, 38(June), 59–75. https://doi.org/https://doi.org/10.1016/j.pacfin.2016.03.009
- Liu, S., & Han, J. (2020). Media tone and expected stock returns. International Review of Financial Analysis, 70(July), 1–18. https://doi.org/https://doi.org/10.1016/j.irfa.2020.101522
- Moskowitz, T., Ooi, Y., & Pedersen, L. (2012). Time series momentum. Journal of Financial Economics, 104(2), 228‐250. https://doi.org/https://doi.org/10.1016/j.jfineco.2011.11.003
- Naranjo, A., & Porter, B. (2007). Including emerging markets in international momentum investment strategies. Emerging Markets Review, 8(2), 147‐166. https://doi.org/https://doi.org/10.1016/j.ememar.2007.01.001
- Newey, W. K., & West, K. D. (1987). A simple positive semi-definite, heteroskedasticity and autocorrelation consistent covariance matrix. Econometrica, 55(3), 703–705. https://doi.org/https://doi.org/10.2307/1913610
- O’Donnell, D. J., & Baur, D. G. (2009). Momentum in the Irish stock market. Applied Economics Letters, 16(11), 1133–1138. https://doi.org/https://doi.org/10.1080/17446540802389032
- Okunev, J., & White, D. (2003). Do momentum-based strategies still work in foreign currency markets? Journal of Financial and Quantitative Analysis, 38(2), 425‐447. https://doi.org/https://doi.org/10.2307/4126758
- Paschke, R., Prokopczuk, M., & Simen, C. W. (2020). Curve momentum. Journal of Banking and Finance, 113(April), 1–17. https://doi.org/https://doi.org/10.1016/j.jbankfin.2019.105718
- Patro, D. K., & Wu, Y. (2004). Predictability of short-horizon returns in international equity markets. Journal of Empirical Finance, 11(4), 553‐584. https://doi.org/https://doi.org/10.1016/j.jempfin.2004.02.003
- Rouwenhorst, K. G. (1998). International momentum strategies. The Journal of Finance, 53(1), 267–284. https://doi.org/https://doi.org/10.1111/0022-1082.95722
- Saleh, W. (2007). Overreaction: The sensitivity of defining the duration of the formation period. Applied Financial Economics, 17(1), 45–61. https://doi.org/https://doi.org/10.1080/09603100500447487
- School, L. B. (2006). London share price data LSPD 2005 reference manual.
- Sehgal, S., & Jain, K. (2015). Dissecting sources of price momentum: Evidence from India. International Journal of Emerging Markets, 10(4), 801–819. https://doi.org/https://doi.org/10.1108/IJoEM-04-2014-0046
- Sherif, M., & Chen, J. (2019). The quality of governance and momentum profits: International evidence. The British Accounting Review, 51(5), 1–16. https://doi.org/https://doi.org/10.1016/j.bar.2019.05.001
- Syriopoulos, T., & Bakos, G. (2019). Investor herding behaviour in globally listed shipping stocks. Maritime Policy & Management, 46(5), 545–564. https://doi.org/https://doi.org/10.1080/03088839.2019.1597288
- Vo, X. V., & Truong, Q. B. (2018). Does momentum work? Evidence from Vietnam stock market. Journal of Behavioral and Experimental Finance, 17(March), 10–15. https://doi.org/https://doi.org/10.1016/j.jbef.2017.12.002
- Yin, L., & Wei, Y. (2020). Aggregate profit instability and time variations in momentum returns: Evidence from China. Pacific-Basin Finance Journal, 60(April), 1–18. https://doi.org/https://doi.org/10.1016/j.pacfin.2020.101276
- Zhang, Y., Wei, Y., Ma, F., & Yi, Y. (2019). Economic constraints and stock return predictability: A new approach. International Review of Financial Analysis, 63(May), 1‐9. https://doi.org/https://doi.org/10.1016/j.irfa.2019.02.007
- Zhu, Z., Duan, X., Sun, L., & Tu, J. (2019). Momentum and reversal: The role of short selling. Journal of Economic Dynamics & Control, 104(July), 95–110. https://doi.org/https://doi.org/10.1016/j.jedc.2019.05.001