
Abstract
Despite the significant growth of e-commerce in recent years, especially in the business-to-consumer (B2C) online retail sector, its positive and negative environmental implications are unclear from previous research. To understand the environmental impacts of e-commerce, two conceptual models were first developed from the literature. Next, using 303 responses collected through a structured questionnaire from the GCC countries, the proposed models, including the relevance/appropriateness of each construct and its underlying items, were validated, and then the hypothesized relationships between them were assessed. The findings of Model 1 showed that green consumerism does shape the consumers’ positive and negative environmental attitudes towards e-commerce, which in turn was found to influence the behavioral intention to use e-commerce channels. In Model 2, positive environmental attitudes no longer predicted behavioral intention with the introduction of perceived ease of use and perceived usefulness constructs as consumers preferred ease of use and usefulness of e-commerce over positive environmental factors. Interestingly, the impact of negative environmental attitudes on behavioral intention remained even in the presence of perceived ease of use and perceived usefulness. The study provides critical insights for practitioners and policymakers in promoting and leveraging the positive environmental benefits of e-commerce, while at the same time strive to minimize/eliminate its negative environmental impacts. The study is arguably the first empirical attempt in understanding the positive and negative environmental implications of e-commerce and its impact on the consumer intention to use e-commerce, and hence the study findings are novel.
PUBLIC INTEREST STATEMENT
E-commerce has seen significant growth in recent years and has reshaped the global retail industry. While the future prospects of e-commerce look promising, the important question that needs urgent attention is, “what is the rise of electronic commerce mean for the environment?” “Is it more environmentally friendly than traditional brick and mortar retail?” The concerns of the natural environment have led to an increase in green consumerism. This formed the motivation of this study, which aims to answer the following research questions methodically: (1) What is the impact of green consumerism on the formation of positive and negative environmental attitudes towards e-commerce? (2) What is the impact of positive and negative environmental attitudes on behavioral intention to use e-commerce channels? and (3) What is the impact of perceived usefulness and perceived ease of use (vis-à-vis environmental factors) on behavioral intention to use e-commerce channels?
1. Introduction
E-commerce has seen significant growth in recent years and has reshaped the global retail industry. In the last decade, e-commerce has been witnessed growth of approximately 20% each year (EPS News, Citation2020). The global e-commerce market size was valued at around 9 trillion in 2019 and is expected to grow at a compound annual growth rate of 14.7% from 2020 to 2027 (Grand View Research, Citation2020). Within e-commerce, online shopping is one of the most popular, even more so due to the COVID-19 pandemic with health and safety restrictions prohibiting brick-and-mortar retail (EPS News, Citation2020). The Business-to-Consumer (B2C) retail e-commerce sales worldwide alone amounted to 3.5 trillion USD and is projected to grow to 6.5 trillion USD in 2023 (Statista, Citation2020). The growth is primarily due to global penetration of the internet to all corners of the world along with smartphones, which have quickly become an intrinsic part of the lives of billions of people (Nielsen, Citation2018). Further, the growing technological awareness among customers, along with the prospects of faster internet connectivity due to the developments of 5 G technology is expected to further bolster e-commerce market growth (Grand View Research, Citation2020).
While the future prospects of e-commerce look promising, the important question that needs urgent attention is, “what is the rise of electronic commerce mean for the environment?” “Is it more environmentally friendly than traditional brick and mortar retail?” Addressing the environmental sustainability of e-commerce is vital given that environmental pollution and global climate change have emerged as one of the significant challenges of the twenty-first century (Balasubramanian et al., Citation2020). The considerable push for economic development and industrialization is also amplifying the depletion of natural resources. Businesses and governments around the world are looking at options to meet the market demand in a more environmentally responsible way (Habib et al., Citation2020).
The concerns of the natural environment have led to an increase in green consumerism. In a recent study, half of the digital consumers highlighted that their environmental concerns impact their purchasing decisions (Global Web Index, Citation2018). As consumers are becoming more aware of what their lifestyle choices are doing to the planet, their attitudes towards environmental sustainability of the end-to-end e-commerce supply chain will impact the intention to use/continue using online shopping channels. However, decision-making for environmentally concerned e-commerce consumers is not that easy, given that e-commerce has both positive and negative environmental impacts (Tiwari & Singh, Citation2011). Therefore, the behavior intention of e-commerce consumers will depend on the relative strength of their positive and negative environmental attitudes towards e-commerce. Understanding this complex and conflicting attitude formation in consumers towards the environmental sustainability of e-commerce is important to leverage the positive environmental attitudes and minimize/eliminate the issues related to negative environmental attitudes. Yet, limited effort has been undertaken to understand the consumer attitudes towards the positive and negative environmental impacts of e-commerce as well as how green consumerism is shaping these attitudes. In other words, does green consumerism consider e-commerce as a shield or threat to the environment?
Finally, it is important to know the attitude-behavior gap in environmental sustainability and e-commerce. Will a strong positive or negative environmental attitude towards e-commerce result in more or less use of e-commerce channels, respectively? Or would other factors such as perceived usefulness and perceived ease of use outweigh the environmental attitudes? For example, during the COVID-19 pandemic, there is growing evidence that consumers, including green ones, are trading environmental sustainability for safety, convenience, and cost (Baking Business, Citation2020). In a recent study, 65% of consumers said they want to buy products that advocate environmental sustainability, yet only about 26% do so (White et al., Citation2019). Unfortunately, the current literature is deficient in answering the environmental sustainability attitudes of customers towards e-commerce, and consequently, their intention to use e-commerce channels.
This formed the motivation of this study, which aims to answer the following research questions methodically:
What is the impact of green consumerism on the formation of positive and negative environmental attitudes towards e-commerce?
What is the impact of positive and negative environmental attitudes on behavioral intention to use e-commerce channels?
What is the impact of perceived usefulness and perceived ease of use (vis-à-vis environmental factors) on behavioral intention to use e-commerce channels?
By answering these research questions, we make several contributions to both the e-commerce and sustainability literature. We do this by developing and testing a new conceptual model (Model 1) of e-commerce sustainability, and then extend the model (Model 2) by adding dimensions of perceived usefulness and perceived ease of use.
We have carefully chosen the Gulf Cooperation Council (GCC) countries as the research setting to investigate due to several characteristics of the region. Traditionally, the GCC consumers’ vis-à-vis Western consumers have preferred shopping malls with brick-and-mortar stores because it has become part of their family outing and entertainment culture. Although online retail in the GCC is still at a very nascent stage compared to developed markets, recent years have witnessed significant growth in e-commerce and online retail in the GCC. This is mostly because GCC consumers are among the most connected and digitally savvy in the world. The UAE and Saudi Arabia have some of the highest levels of the internet, smartphone, and social media penetrations globally (Bain & Company, Citation2019). Recently, a spate of local and global online retailers have emerged in the region. Amazon.com acquired UAE-based e-commerce retailer Souq.com for 580 million USD in 2017. In 2017, Noon.com was launched, an e-commerce marketplace targeting the Middle East with 1 billion USD in investor funding (Bain & Company, Citation2019).
On the other hand, GCC faces the impact of rapid development and the effects of climate change and global warming. Protection of the environment and sustainable development are key topics that have received considerable attention from the governments in GCC (EcoMENA, Citation2019). The GCC’s rapid economic development has led to severe environmental challenges that arise from the high pace of population growth and the fast-paced urban development. Although GCC accounts for only 0.6% of the global population, it contributes to 2.4% of the global GHG emissions. GCC countries are among the top per capita emitters of carbon dioxide in the world (EcoMENA, Citation2019). For example, the UAE is among the top countries in the world for having the largest ecological footprint (UAE, Citation2020). Therefore, the GCC provides a perfect example of understanding the environmental implications of e-commerce as well as the potential opportunities to lessen the impacts associated with it.
The structure of the paper is as follows. In the next section, the development of the conceptual models (Model 1 and Model 2) and associated hypotheses from the literature are discussed. In section 3, we lay out the survey research method adopted, followed by an analysis of the findings of the study in section 4. In the final section, we provide a discussion of the results, implications of our research for researchers and practitioners along with limitations of the study, and indications for future research.
2. Conceptual framework and hypotheses development
In this section, we will first define the constructs, namely, green consumerism, positive environmental factors, negative environmental factors, perceived ease of use, perceived usefulness, and behavioral intention to use e-commerce channels. Next, two theoretical frameworks are developed to conceptualize the hypothesized relationships between the constructs.
2.1. Green consumerism
Green consumerism refers to consumer behavior, which minimizes the negative impact of their consumption on the environment. Green consumers’ environmental concerns are typically comprehensive and universal. Their obligation and responsibilities as citizens generally extend beyond the nation-state and include concerns for future generations such a global warming, rising sea levels, increasing global temperature, deforestation, and resource depletion (Dean, Citation2001; Guckian et al., Citation2017). They strongly believe that human beings are responsible for the emergence of environmental problems (Yue et al., Citation2020). They demonstrate a desire to act, directed toward the remediation of environmental problems (Yue et al., Citation2020). Therefore, green consumers are increasingly concerned about the environmental footprints of their purchases, and that they are increasingly aware that the environmental footprints are distributed throughout the supply chain. Consumers have now starting asking questions as to “‘where the product is made”, “how it is made”, “how it is transported”, etc. For instance, consumers are now looking for products with fewer “miles”, i.e., close or locally produced goods which had had less impact on the environment in transportation terms (Bearing Point, Citation2020). Also, green consumers prefer product/service that contributes to the least amount of environmental damage, and they are ready to either avoid or switch brands for environmental reasons (Guckian et al., Citation2017). They prefer products with reuse or recyclable materials. They also participate in manufacturers/retailers recycling or renewal programs to reduce supply chain wastes (Pittayachawan et al., Citation2014).
2.2. Environmental impacts of e-commerce
Several studies have reported both positive and negative environmental impacts of the e-commerce supply chain. Still, there is a lack of consensus in the literature as to whether e-commerce is good or bad for the environment.
2.2.1. Positive environmental impacts of e-commerce
The proponents of e-commerce argue that they have a lower carbon footprint than traditional in-store shopping (Research and Markets, Citation2020). A research carried out at the MIT Center for Transportation & Logistics ins 2013 on US online shopping found that online shopping is more eco-friendly than shopping in brick-and-mortar stores (Weideli, Citation2013). The study looked at the environmental impacts throughout the supply chain starting from the energy consumption during the search ordering process (electricity consumption of personal computer use during the buying process) to warehousing, packaging, transportation, energy consumption at physical stores (in the case of brick-and-mortar shopping). Another study conducted at the Pittsburgh’s Carnegie Mellon University found that online shopping is 35% less energy-intensive than the traditional retail shopping model (Los Angeles Times, Citation2011). This is because, despite the environmental impacts of packaging of online shopping being greater than traditional shopping, customer transportation, which accounts for 65% of total emissions when buying an item at a retail store is significantly greater than transportation emission in online shopping due to their optimized delivery methods (Weber and Matthews, Citation2008). For instance, in e-commerce, multiple deliveries are carried out on a single route which lowers the cost of distribution and reduces carbon footprint (Himanshu, Citation2016). Jusoh and Ling (Citation2012) reported that transportation-related emissions of traditional brick-and-mortar alone are significantly higher than the entire supply chain emission of online shopping, including packaging, warehousing, transportation, personal computing, and data center-related emissions. Further, paperless transactions of e-commerce (bills, receipts, coupons, etc.) along with e-brochures and catalogs save trees and reduce associated environmental impacts vis-à-vis traditional brick-and-mortar stores, which is paper-intensive (Sustainable Earth, Citation2012).
2.2.2. Negative environmental impacts of e-commerce
The growing competition in the online retail sector is leading to changes in business strategies and models to lure customers such same-day home or few hour deliveries, which in turn is causing more harm to the environment (Forbes, Citation2017). For example, Amazon offers several membership packages under its Prime banner, including same-day delivery, and in certain cities, even a 2-hour delivery (Sustainable Brands, 2016). According to World Economic Forum, the demand for urban last-mile delivery of online shopping is expected to grow 78% by 2030, leading to 36% more delivery vehicles in 100 cities around the world, causing environmental-related emissions to rise by nearly one-third (World Economic Forum, Citation2020). For expedited global deliveries, goods sent by air transport contribute towards much higher emissions as compared to goods transported by train or even road (Himanshu, Citation2016). According to CNN Business Report, online shopping can be worse for the environment than driving to a store because of high packaging waste and the fact that online items tend to come from different distribution centers (CNN Business, Citation2020). The total greenhouse gas footprints per item purchased from physical stores were lower than online shopping in 81% of the shopping events in the United Kingdom (CNN Business, Citation2020). Similarly, a report in Forbes (Citation2019) showed that the environmental footprint of online shopping is greater than physical stores because of the increasing number of items being redelivered or returned. The report suggested that as much as one in three orders online were returned (Forbes, Citation2019). More than 50% of respondents in the US expressed concerns about excessive and wasteful packaging in online deliveries (Sustainable brands, 2016). According to Environment Protection Agency (EPA) in the US, packaging accounted for approximately 30% of the total solid waste generated (EPA, Citation2020). This is because, packaging of goods shipped to customers typically consists of an extra layer of corrugated box, foam/plastic/bubble wrap around the product to protect it during shipment (Himanshu, Citation2016). Further, the need for huge, energy-intensive data centers will go on increasing with the increase in the amount of data that needs to be stored, processed and retrieved, and therefore is a concern for the environment (Himanshu, Citation2016).
2.3. Perceived ease of use and perceived usefulness
Consumers are becoming more comfortable with online shopping and are enjoying the convenience it provides. According to Technology Acceptance Model (TAM), perceived ease of use and perceived usefulness are two key factors that shape an individual’s behavioral intention toward using technology, in this case, use of e-commerce channels for retail shopping (Davis, Citation1989; Doshi, Citation2018; Fedorko et al., Citation2018). Perceived ease of use refers to an individual’s belief that using a system is free of effort, while perceived usefulness refers to an individual’s belief that using a system would enhance performance.
From the perceived ease of use perspective, one of the main advantages of online shopping is the convenience including consumers’ time and effort (Jiang et al., Citation2013) and location and time independence (Doshi, Citation2018). Customers can purchase with just a tap of their fingers from any online retailer without having to move around physically. Also, they have the opportunity to buy products and services 24/7 comfortably and conveniently using their smartphones or laptops, allowing them to shop with comfort and convenience of their own home or office (ADEO, Citation2020). Further, e-commerce websites are very convenient to purchase products and services online. The process is often fast as the customers can place orders in a relatively short period using their preferred electronic payment channels or opt for cash on delivery (ADEO, Citation2020).
In the case of perceived usefulness of e-commerce, customers strive to get benefits such as save time, money, make better purchase decisions, and ability to select from a vast selection of products or services (Alraja & Aref, Citation2015). Also, as mentioned earlier, customers can opt for express delivery options that fulfill their desire for instant gratification (Sustainable Brands, 2016). Also, customers have the opportunity to avail of free deliveries. For example, Amazon offers free delivery for its prime customers (The Sun, Citation2016).
2.4. Behavioral intention to use E-commerce channels
It refers to the customer intention to use e-commerce channels vis-à-vis brick-and-mortar stores. This also includes customer intention to encourage/recommend friends and family members to shop online as well as further increase the number of items purchases online vis-à-vis physical stores in the future (Jibril et al., Citation2020).
Now that we have defined the constructs, next, we will discuss the relationships between constructs and related hypotheses.
2.5. Theoretical background
Theoretical frameworks provide a way to conceptualize these complex relationships. In this study, multiple theoretical perspectives from established and emerging theories are used to develop the two theoretical frameworks as it provides a strong theoretical foundation. The key theories considered are Theory of Reasoned Action (TRA), The Theory of Planned Behavior (TPB), Technology Acceptance Model (TAM), and Model of Goal-Oriented Behavior (MGB).
TPB emphasizes on predicting the various individual level intentions and behavior (Ajzen, Citation1991). Unlike TRA which focuses on a specific rational behavior, TPB, which is an extension of TRA focuses on both volitional and non-volitional aspects (Hsu & Huang, Citation2012). Both these socio-psychological and rational choice theories assume that an individual’s intentions drive various actionable outcomes (Han et al., Citation2010) and hence they found applications in various contexts. Hsu and Huang (Citation2012) proposed that the potential of both TRA and TPB models can be harnessed by adding innovative predictors and outcome variables. In line to this, Perugini and Bagozzi (Citation2001) came up with the Model of Goal-Oriented Behavior (MGB) to capture motivational, affective and automatic aspects of individual’s intention, which were sidelined by the other theories (Taylor et al., Citation2009). The MGB theory supports the relationships among positive and negative emotions, subjective norms, attitude towards behavior and individual’s intention (Han et al., Citation2014; Perugini & Bagozzi, Citation2001). Finally, the most common used conceptual theory for examining behavioral intention in technological studies is TAM (Davis, Citation1989) which is derived from TRA. TAM explains the behavioral intention to use technology-based applications based on measures relating to user acceptance, adoption of technology, and usefulness of using the technology. Hence, the conceptual frameworks of the present study are based on the culmination of TRA, TPB, TAM and MBG theories.
2.6. Relationships between constructs
2.6.1. Green consumerism and environmental attitudes (positive and negative) towards e-commerce
Green consumers are expected to make a concerted effort to understand the positive and negative environmental impacts of their shopping. This is because they do not immediately believe the environmental claims of the seller unless they are verified (IISD, Citation2013). They are also eager to know and learn more about the environmental impacts of their purchases (IISD, Citation2013). Hence, we argue that green consumers are likely to find out (such as through their own research) the positive and negative environmental impacts of online shopping and consequently develop distinct positive and negative environmental attitudes towards online shopping that are likely to influence their behavioral intention to use e-commerce channels. Hence, we propose the following hypotheses.
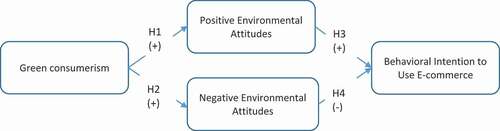
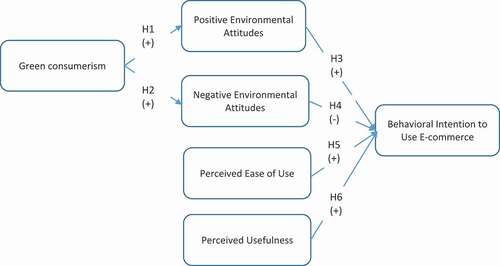
H1: Green consumerism leads to positive environmental attitudes towards e-commerce
H2: Green consumerism leads to negative environmental attitudes towards e-commerce
Environmental attitudes (positive and negative) towards e-commerce and behavioral intention to use e-commerce
According to the TAM model, attitude towards the technology would lead to behavioral intention to use the technology (Fedorko et al., Citation2018). In this study, given that we have both positive and negative environmental attitudes, the behavioral intention to use e-commerce channels would depend on the opposing (positive and negative) environmental attitudes, similar to Lewins’ force field theory (Lewin, Citation1951). Therefore, higher the relative strength of the positive environmental attitudes vis-à-vis negative environmental attitudes, more can be the expected behavioral intention to use the technology. Conversely, higher the relative strength of the negative environmental attitudes vis-à-vis positive environmental attitudes, less can be the expected behavioral intention to use the technology. Therefore, we propose the following hypotheses:
H3: Positive environmental attitudes towards e-commerce will increase the behavioral intention to use e-commerce
H4: Negative environmental attitudes towards e-commerce will decrease the behavioral intention to use e-commerce
The hypotheses mentioned above (H1–H4) are conceptualized in Model 1 ().
Figure 1. Environmental sustainability and e-commerce framework (Model 1)
2.6.2. Perceived ease of use, perceived usefulness, and behavioral intention to use e-commerce
According to the TAM model in e-commerce, perceived ease of use, and perceived usefulness will positively influence the behavioral intention to use e-commerce channels (Fedorko et al., Citation2018). While we expect this relationship to behave in the same manner in this study, the objective of assessing this relationship is to understand the changes in the predictive power of positive and negative environmental factors when they are introduced in the model. In simple terms, will perceived usefulness and perceived ease of use outweigh the environmental attitudes? Will consumers trade environmental sustainability attitudes for perceived ease of use and usefulness? Evidence from the literature shows that even green consumers do not want to entail major sacrifices in convenience, comfort, and benefits (IISD, Citation2013). It is important to know whether environmental attitude translate to behavioral intention when they perceive the use and usefulness of e-commerce. For example, free return policy is something customer may find it useful but has major environmental implications. Studies have shown that free return policy fuel unnecessary ordering and increase return rates (Saarijärvi et al., Citation2017). According to White et al. (Citation2019), only less than half of the customers who report positive environmental attitudes toward products and services follow through with their wallets. To explore this further, we propose the following hypotheses:
H5: Perceived ease of use will increase the behavioral intention to use e-commerce
H6: Perceived usefulness will increase the behavioral intention to use e-commerce
The extended environmental sustainability and e-commerce framework (Model 2) are given in .
Figure 2. Environmental sustainability and e-commerce extended framework (Model 2)
3. Research methodology
A quantitative survey-based research method was adopted to test and validate the framework and hypotheses in the study. They are discussed in detail below.
3.1. Survey design
The underlying measures for each construct identified from the literature were organized in the form of a self-administered survey questionnaire. A 5-point Likert scale ranging from strongly agree (5) to strongly disagree (1) was used to assesses the main constructs in the study. In addition, the survey instrument had several questions to capture the demographic information of participants.
3.2. Survey pretest
During the development phase of the survey instrument, the questionnaire was pretested with three industry and academic experts with rich experience in the retail fashion industry. The pretest process with the participants involved checking the appropriateness of the questions, evaluating the readability/choice of terminology, assuring clarity/ease of understanding, and the relevance of the items in real-world situations (Balasubramanian & Shukla, Citation2017). The suggestions from the pretest respondents were then incorporated and the refined questionnaire became more relevant and easy to understand.
3.3. Survey pilot-test
Immediately following the pretest, a pilot survey test with 50 participants using convenience sampling was conducted to gain insight into the planning and preparation of the main survey, including aspects such as the response rate, the drop-out rate and average time for completion, questions/sections skipped. In addition, useful feedback was obtained from the survey participants on the survey instrument through an open-ended for improving the questionnaire. Based on this pilot study responses, the questionnaire was further refined, and survey length was reduced by removing some questions. The finalized survey instrument used for this study is given in Appendix 1.
3.4. Main survey administration—Population and sample
The sample population comprises residents in the Gulf Cooperation Council (GCC) countries. Techniques for random sampling was utilized to select the participants for the study (J. Hair et al., Citation2017). The main survey was administrated for a period of 2 months using Survey Monkey, an online survey system. In terms of sampling, a random sampling technique was used, with the survey sent to 1000 randomly selected residents in the GCC countries. A total of 352 respondents completed the survey, a response rate of 35.2%. Of the 352 responses, 49 responses were removed due to incompleteness or other concerns related to the engagement of participants such as pattern responses and faster completion time, leaving 303 usable responses for data analysis. The characteristics of the survey participants are provided in .
Table 1. Demographic classification of survey respondents T
As seen in , more than two-thirds of the participants were male. In terms of age, almost 80% of the respondents were either 45 or younger. The participants also had a good level of education, with almost 53% of the respondents, having a Master’s degree or higher; quality of responses, in general, therefore, was presumed to be high. Finally, a good mix of representation was obtained across all income levels.
3.5. Model and hypotheses testing
A two-stage procedure was used to test the measurement model and hypothesis, as suggested by Anderson and Gerbing (Citation1988). In the first stage, CFA was conducted to test the measurement models (see section 4.3.1). In the second stage, structural equation modeling (SEM) was used to examine the hypothesized structural relationships in the models.
Structural equation modeling (SEM) was used as the main statistical analysis technique to assess the hypothesized relationship in the models. SEM was preferred over other approaches because it is a powerful statistical tool that combines a measurement model (confirmatory factor analysis) with a structural model (path analysis) into a simultaneous statistical test (Garver & Mentzer, Citation1999). It can assess the relationships between unobserved latent constructs (Lei & Wu, Citation2007) and has the ability to handle multiple relationships simultaneously and efficiently (Garver & Mentzer, Citation1999). Also, SEM can check the fit of the entire model to the data. SEM provide estimates for the overall model fit and various other goodness-of-fit indices to ensure the statistical appropriateness of both models. Also, it provides a statistical approach for explicitly considering measurement error in the observed variables including both dependent and independent variables in a given model (Kline, Citation2011).
Although, SEM is susceptible to sample size, the 300 plus valid responses obtained from the study facilitated the use of SEM. The minimum sample size recommended by researchers for the use of maximum likelihood estimation, the estimation technique in SEM used in this study, is approximately 200 (Lei & Wu, Citation2007). These reasons justified the use of SEM to test the proposed hypotheses in this study.
4. Analysis and findings
Before proceeding with the computation of descriptive statistics, we checked for data validity. In the next step, before testing the hypotheses using structural equation modeling, we have checked the construct reliability, construct validity, and measurement model validity.
4.1. Data validation
4.1.1. Common method bias
To eliminate common method bias, which arises when one respondent answers all parts of the self-reported questionnaire involving multiple constructs, prior to data collection, procedural remedies suggested by Podsakoff et al. (Citation2003) such as informing respondents about the data confidentiality and anonymity were used to prompt honest answers from the respondents. Post data collection, the Harman’s single-factor test, one of the most widely used methods to check for common method bias, in which all items are loaded into one construct (factor) using exploratory factor analysis (Podsakoff et al., Citation2003). The results of the constrained single-factor exploratory factor analysis accounted for only 22.74% of the variance, while the unconstrained model explained 62.25% of the variance, indicating that common method bias was an issue in the study.
4.1.2. Non-response bias
To test for non-response bias, responses of early respondents (responses received in the first month) were compared to that of late respondents (responses in the second month after multiple reminders), with the underlying assumption that the opinions of late respondents were representative of the views of the theoretical non-respondents (Rogelberg & Stanton, Citation2007). The t-test revealed no significant difference between early respondents and late respondents for all the items, indicating that non-response bias was not a problem in the survey (Armstrong & Overton, Citation1977).
4.2. Measurement model and construct validation
4.2.1. Model fit of measurement model
The model fit of the measurement model comprising all six constructs were computed using CFA. The various measures used to determine the model fit of the measurement model include chi-square/df (χ2/df), comparative fit index (CFI), goodness-of-fit index (GFI), adjusted goodness-of-fit index (AGFI) and root mean square error of approximation (RMSEA) (Balasubramanian & Shukla, Citation2017). The selection ensured at least one fitness index was selected from the three model fit categories, namely absolute fit, incremental fit, and parsimonious fit, as recommended by J. F. Hair et al. (Citation2010). The measurement model showed a good model fit as shown in .
Table 2. Measurement model fit indices
4.2.2. Convergent validity
CFA was used to check for convergent validity. The standardized factor loadings of CFA indicate the correlation between the individual items and the corresponding construct. Usually, a higher factor loading (>0.5) and a corresponding critical ratio above 1.96 shows evidence of construct validity (Anderson & Gerbing, Citation1988). As shown in , all items (except for PEA1, NEA1, PU1, and PU2) loaded to their respective construct with factor loadings greater than 0.50 indicating strong convergent validity of the theoretical constructs. Of the four items that failed to load, three items were still retained, given that the lower threshold for retaining the factors is 0.4 (Stevens, Citation2012). PU1, which had a factor loading of 0.26, was removed from the subsequent analysis. The reason for lower loading could be because, although free returns are possible in online shopping, they may not be seeing the whole returning process to be useful as it involves considerable time and effort.
Table 3. First order-confirmatory factor loadings
4.2.3. Discriminant validity
Discriminant Validity refers to the degree to which measurement items of constructs that theoretically should not be related to each other are, in fact, not related to each other (Trochim, Citation2020). In this study, discriminant validity is assessed by using both Fornell–Larcker criterion and heterotrait–monotrait (HTMT) ratio of correlation.
In Fornell–Lacker criterion, the square root of each construct’s average variance extracted (AVE) should be greater than the bivariate correlation with the other constructs in the model (Fornell & Larcker, Citation1981). As shown in , the correlation between constructs is well below the upper threshold of 0.85, demonstrating strong discriminant validity. Also, the square root of AVE of the constructs is greater than the correlation with other constructs except for PEOU and PU, and PU and BITU, demonstrating reasonable discriminant validity. The correlation between PEOU and PU is not a concern given that TAM model expects PEOU to influence PU. Similarly, a high correlation between PU and BITU is not surprising given that PU is a strong predictor of BITU.
Table 4. AVE and correlation between constructs
The HTMT method compares the correlation values of latent constructs with a predefined threshold value of 0.85 (Kline, Citation2011) or 0.90 (Gold et al., Citation2001) and the values which are closer to 1 indicate a lack of discriminant validity. It is more superior with higher specificity and sensitivity rates over 97%, when compared to Fornell–Lacker’s 20.82% (Henseler et al., Citation2015). The results of HTMT test (see ) reveals that all the latent constructs of the study achieve discriminant validity. Overall, based on Fornell–Larcker criterion and HTMT method, it can be concluded that the constructs have discriminant validity.
Table 5. Heterotrait–monotrait ratio of correlations (HTMT)
4.2.4. Reliability of constructs
The Cronbach’s alpha was used to measure the reliability of the constructs. As seen in , the reliability scores obtained for all six constructs were well above 0.7, the acceptable threshold for reliability (Nunnally & Bernstein, Citation1994).
Table 6. Mean, standard deviation, and Cronbach’s alpha
Now that we have established the validity and reliability of the data and constructs, the next phase of analysis required examination of the descriptive statistics at both the construct and the item level to identify the relative importance of the constructs and items as perceived by the respondents.
4.3. Descriptive statistics
The mean and standard deviation (SD) of the items and constructs are given in . As seen in the table, perceived ease of use (PEOU) emerged as the construct with the highest overall mean score of 4.13 out of 5.00, followed by perceived usefulness (PU) with a mean score of 3.93. Green consumerism (GC), behavioral intention to use e-commerce (BITU), and positive environmental attitudes (PEA), all emerged with a moderately high score ranging between 3.81 and 3.85. Negative environmental attitudes (NEA) emerged as the construct (vis-à-vis other constructs) with the lowest overall mean score, though it is still moderate, 3.51 out of 5. A relatively lower standard deviation (SD <1) shows consistency in the responses of participants.
In terms of individual items for GC, GC6 and GC7 emerged as the items with the highest individual scores, with scores above 4.00. This shows that participants’ concern for the environment goes beyond their individual purchasing actions and that they support the green consumerism movement and very much concerned about global warming. This supports the arguments in the literature that consumers have a concern for future generations (Dean, Citation2001; Guckian et al., Citation2017). In terms of positive environmental attitudes, the two items that received high scores above 4.00 are PEA1 and PEA4, both related to paperless benefits of online shopping. This could be because participants can better connect and gauge this benefit than others. In terms of NEA, concerns related to packaging materials (NEA5) emerged as the highest with a mean score above 4.00, echoing the concerns in the literature related to excessive and wasteful packaging in online deliveries (Sustainable brands, 2016). However, respondents seem to disagree with the statement that faster shipping has a negative environmental impact as it emerged with a relatively low mean score of 2.94. This shows the need for creating environmental awareness for consumers on the greater environmental impact of faster shipping vis-à-vis slower shipping. For POEU, all items except PEOU1 (3.96) had scores above 4.00, with anytime (PEOU4) and anywhere (PEOU5) shopping emerged as the ones with the highest mean scores. The consistently high scores received for individual items explain why PEOU emerged as the construct with the highest overall mean score. For PU, three out of the five items (PU4, PU5, and PU6) emerged with scores above 4.00. Finally, for BITU, only item, BITU1, which captures the respondents’ intention to continue using online shopping, emerged with a score above 4.00.
4.4. Structural equation modeling results and hypotheses test results
Before proceeding with the testing of hypotheses, it is important to establish the overall model fit and various other goodness-of-fit indices to ensure the statistical appropriateness of the structural models.
4.4.1. Model fit of structural models
The model fit of the structural models (Model 1 and Model 2) was established using χ2/df, CFI, GFI, AGFI, and RMSEA (Balasubramanian & Shukla, Citation2017). The structural models showed a good model fit as shown in .
Table 7. Structural model fit indices
For results of fit indices for model 1 () and model 2 () demonstrate reasonable fit for the structural model.
4.4.2. Hypotheses test results (model 1)
shows the structural equation modeling test results for Model 1. The structural equation model results show that all the relationships are significant, and therefore the proposed hypotheses (H1–H4) are supported. However, the strength of the relationships is moderate for H1 (β = 0.35, p < 0.001) and H3 (β = 0.35, p < 0.001), while it is low for H2 (β = 0.29, p < 0.001), and H4 (β = −0.20, p < 0.01).
Table 8. Summary of hypotheses test results (Model 1)
shows the structural equation model test results for Model 2. The structural equation model results show that all the proposed hypotheses are supported except for H3. PEA was found to have no significant impact on BITU. For the hypotheses that are supported, the strength of the relationship is moderate for H1 (β = 0.31, p < 0.001), H5 (β = 0.40, p < 0.001) and H6 (β = 0.40, p < 0.001) while the strength is low for H2 (β = 0.29, p < 0.001) and H4 (β = −0.16, p < 0.001).
Table 9. Summary of hypotheses test results (Model 2)
5. Discussions
The study found support for hypotheses H1 and H2 in both Model 1 and Model 2, demonstrating that green consumerism leads to the formation of both positive and negative environmental attitudes towards e-commerce, thus, answering RQ1. In line with the literature, this shows that green consumers make a concerted effort to know and learn more about the environmental impacts of their purchases, including those activities that are happening behind the scenes such as warehousing, transportation, and use of energy-intensive servers (IISD, Citation2013).
However, in both the models, the impact of green consumerism on positive environmental attitudes is marginally greater than that of negative environmental attitudes towards e-commerce. Also, the mean score for PEA (3.81) and NEA (3.51) shows that consumers, in general, perceive the positive environmental impacts of e-commerce to be marginally greater than that of the negative environmental impacts. While these findings bring some degree of consensus to the literature as well as dispel the misconceptions in the literature that e-commerce is worse than brick-and-mortar stores for the environment. Yet, the findings show that negative environmental impacts of e-commerce are a major concern and that consumers are reasonably informed of it.
To answer RQ2, we need to look at Model 1 and Model 2 results together. First, looking at Model 1, as hypothesized, the positive and negative environmental attitudes towards e-commerce were found to increase and decrease the behavioral intention to use e-commerce channels, respectively. In other words, the behavioral intention to use e-commerce is shaped by the positive and negative attitudes; greater the positive environmental attitude, greater would be the intention to use e-commerce. On the contrary, the greater the negative environmental attitude, lesser would be the intention to use e-commerce. However, despite the support for the hypotheses, it could still be argued that there exists an attitude-behavior gap on environmental sustainability and e-commerce given that the relationship between NEA and BITU and between PEA and BITU is only low and moderate, respectively. In line with the literature, this shows that environmental attitudes not always get translated into behavioral intentions (White et al., Citation2019).
Interestingly, in the case of the extended model (Model 2), when we introduced perceived ease of use and perceived usefulness, positive environmental attitudes impact on behavioral intention was found to be very low and insignificant. On the other hand, both perceived ease of use and perceived usefulness were found to have a positive, moderate impact on behavioral intention. This shows that the positive environmental attitudes no longer predict behavioral intention in the presence of perceived ease of use and perceived usefulness. The likely explanation is that consumers prefer the ease of use and usefulness of e-commerce over environmental aspects. The results support the evidence in the literature that shopping convenience is one of the principal motivations underlying consumer inclinations to towards online shopping (Jiang et al., Citation2013). Also, the findings resonate the views in the literature that consumers do not want to entail major sacrifices in convenience, comfort, and benefits in supporting the environment (IISD, Citation2013). Specifically, this explains why most customers who report positive environmental attitudes toward products and services do not follow through with their wallets (White et al., Citation2019). This shows that e-commerce firms need to implement environmental practices, not at the expense of ease of use and usefulness. Interestingly, the negative environmental attitudes impact on environmental sustainability still remained significant even in the presence of perceived ease of use and perceived usefulness, though the predictive power has marginally diminished (β = −0.20 in Model 1 to β = −0.16 in Model 2). In other words, the negative attitudes towards environmental sustainability remain despite the ease of use and usefulness of e-commerce, something that the e-commerce firms need to take into consideration.
6. Managerial implications
Although the study was conducted in GCC, given the fact that most of the underlying issues in e-commerce and specifically online shopping are similar in most countries, the insights obtained from this study, including the framework, enables relevant practitioners and policymakers to devise policies and support mechanisms that address environmental sustainability issues of e-commerce. Practitioners must strive for promoting and leveraging the positive environmental benefits of e-commerce without compromising on ease of use and usefulness of e-commerce channels, while at the same time strive for minimizing/eliminating the negative environmental impacts of e-commerce. For example, paperless benefits of e-commerce were found to resonate well with the environmental conscious buyers, and therefore, online retailers must further strive to create this awareness that whoever is using e-commerce channels are contributing to the environment, preferably quantify their contribution in terms of the number of trees saved or CO2 emissions mitigated. For example, offering customers the chance to see their carbon footprint saving of online purchases with further motivate them to support the environment.
On the other hand, in the case of the negative environmental impacts of e-commerce, for example, packaging, which was highlighted as a major concern. Therefore, online retailers must strive for sustainable packaging such as those made with recycled materials or start programs for taking back packaging after delivery. The other interesting findings from this study is that customers do not recognize the environmental impacts of faster delivery options. This emerged as the factor with the lowest score in the negative environmental attitudes of customers. More effort is therefore required from both online retailers to educate the customers on how faster shipping and delivery impact the environment. In this way, customers would volunteer to choose a green delivery method themselves. For example, if the ordered product is not urgent, then some customers may be happy to wait longer for it to be delivered if it is better for the environment. Online retailers can also differentiate faster shipping with relatively higher shipping charges.
7. Conclusions
This study offers several important research contributions. First, the study was able to identify the critical elements of e-commerce sustainability and develop them into managerially relevant constructs as well as validate the constructs. The development and validation of e-commerce environmental sustainability constructs, especially distinct negative environmental attitudes, and positive environmental attitudes construct in itself, is a significant research contribution. The study offers a unique opportunity to understand how positive and negative attitudes towards environmental sustainability are developed in consumers’ minds and its implications on the intention to use e-commerce channels. Given that construct development and validation is at the heart of theory building (Venkatraman, Citation1989), this study significantly contributes to the theoretical advancement of environmental sustainability in the e-commerce domain. Next, the study was able to integrate the constructs into an empirically tractable and meaningful framework. The proposed frameworks (Model 1 and Model 2) and related hypotheses considerably fill the gap in the literature. Future researchers could use/adapt the framework in their contexts.
However, the study has some limitations. First, the findings and the proposed framework of e-commence environmental sustainability is relevant only for B2C (business to consumer) model in the online retail sector. Future researchers, therefore, could extend the study to include B2B (business to business) and C2C (customer to customer) models. Second, the constructs proposed in this study are identified from the literature and may not have covered every underlying facet of e-commerce. For example, there could be other positive environmental benefits or negative environmental issues of e-commerce, which may not be considered in this study. The next obvious step for future researchers would be to use exploratory interviews with customers and e-commerce professionals to further understand the positive and negative environmental implications of e-commerce. The final limitation of the study is the fact that it has not explored the impact of demographic factors of consumers. Future studies could explore the impact of demographic factors of consumers such as age, gender, income, and occupation.
Despite the limitations, we believe the study findings and proposed frameworks significantly contribute to addressing the environmental implications of the e-commerce sector so that it could meet the growing demands in a more environmentally sustainable manner.
Additional information
Funding
Notes on contributors
Prakash Rao
Sreejith Balasubramanian is a Senior Lecturer in Supply Chain Management, at Middlesex University, Dubai. His expertise include supply chain, operations management, and sustainability.
Sreejith Balasubramanian
Nitin Simha Vihari is an Assistant Professor of Management at BITS Pilani, Dubai. His research interests are Human Resource Management, and Corporate Sustainability.
Nitin Vihari
Shazi Shah Jabeen is a Professor and Head of the Department of Humanities and Social Sciences at BITS Pilani, Dubai.
Shazi Jabeen
Vinaya Shukla is a Senior Lecturer in Operations and Supply Chain at Middlesex University, London. His research interests are in Green Supply Chain Management.
Vinaya Shukla
Janya Chanchaichujitis an Associate Professor in Logistics Management and Head of Logistics and Business Analytics Center of Excellence at Walailak University in Thailand.
Janya Chanchaichujit
Prakash H Narayan Raois a Doctoral Candidate at the Department of Humanities and Social Sciences, BITS Pilani, Dubai and the Group Head – SCM Projects & Home Operations at Landmark Group, UAE.
References
- ADEO. (2020). What are the benefits of E-commerce to the customer?. Available at (accessed 18 July 2020). Adeogroup. https://www.adeogroup.co.uk/ecommerce-benefits/
- Ajzen, I. (1991). The theory of planned behaviour. Organizational Behaviour and Human Decision Processes, 50(2), 179–29. https://doi.org/https://doi.org/10.1016/0749-5978(91)90020-T
- Alraja, M. N., & Aref, M. (2015). Customer acceptance of e-commerce: integrating perceived risk with TAM. International Journal of Applied Business and Economic Research, 13(2), 913–921.
- Anderson, J. C., & Gerbing, D. W. (1988). Structural equation modeling in practice: A review and recommended two-step approach. Psychological Bulletin, 3(3), 411–423. https://doi.org/https://doi.org/10.1037/0033-2909.103.3.411
- Armstrong, J. S., & Overton, T. S. (1977). Estimating nonresponse bias in mail surveys. Journal of Marketing Research, 14(3), 396–402. https://doi.org/https://doi.org/10.1177/002224377701400320
- Bain & Company. (2019). E-commerce in MENA: opportunity beyond the hype. Available at (accessed 03 June 2020). https://www.bain.com/contentassets/2b078686303045ffa1d1207130ab5d79/bain_report__ecommerce_in_mena.pdf
- Baking Business. (2020). Sustainability issues take a backseat to COVID-19. Available at (accessed 03 June 2020). https://www.bakingbusiness.com/articles/50763-sustainability-issues-take-a-backseat-to-covid-19
- Balasubramanian, S., & Shukla, V. (2017). Green supply chain management: An empirical investigation on the construction sector. Supply Chain Management: An International Journal, 22(1), 58–81. https://doi.org/https://doi.org/10.1108/SCM-07-2016-0227
- Balasubramanian, S., Shukla, V., & Chanchaichujit, J. 2020. Firm size implications for environmental sustainability of supply chains: Evidence from the UAE. Management of Environmental Quality: An International Journal, (5), 1375-1406. (online first). https://doi.org/https://doi.org/10.1108/MEQ-01-2020-0004
- Bearing Point. (2020). Green supply chain: From awareness to action. Available at (accessed 18 July 2020). https://www.bearingpoint.com/en-ae/our-success/thought-leadership/green-supply-chain-from-awareness-to-action/
- CNN Business. (2020). Online shopping can be worse for the environment than driving to a store. Available at (accessed 18 July 2020). CNN International. https://edition.cnn.com/2020/02/26/tech/greenhouse-gas-emissions-retail/index.html
- Davis, F. D. (1989). Perceived usefulness, perceived ease of use, and user acceptance of information technology. MIS Quarterly, 13(3), 319–340. https://doi.org/https://doi.org/10.2307/249008
- Dean, H. (2001). Green citizenship. Social Policy & Administration, 35(5), 490–505. https://doi.org/https://doi.org/10.1111/1467-9515.t01-1-00249
- Doshi, P. V. (2018). Relationship of perceived ease use and perceived usefulness on usage of e-commerce site. International Journal of Academic Research and Development, 3(1), 495–498.
- EcoMENA. (2019). Carbon capture and storage: prospects in GCC. Available at (accessed 09 June 2020). https://www.ecomena.org/carbon-capture-storage/#:~:text=GCC%20accounts%20for%200.6%25%20of,carbon%20dioxide%20in%20the%20world.
- EPA. (2020). Containers and packaging: product-specific data. ( accessed 10 June 2020). United State Environmental Protection Agency. https://www.epa.gov/facts-and-figures-about-materials-waste-and-recycling/containers-and-packaging-product-specific-data
- EPS News. (2020). How the Covid-19 pandemic is driving E-commerce. Available at (accessed 15 June 2020). ASPENCORE. https://epsnews.com/2020/06/04/how-the-covid-19-pandemic-is-driving-e-commerce/
- Fedorko, I., Bacik, R., & Gavurova, B. (2018). Technology acceptance model in e-commerce segment. Management & Marketing. Challenges for the Knowledge Society, 13(4), 1242–1256.
- Forbes. (2017). How retailers can reduce the Carbon footprint from online shopping. Available at (accessed 15 June 2020). Forbes Media LLC. https://www.forbes.com/sites/baininsights/2017/05/22/how-retailers-can-reduce-the-carbon-footprint-from-online-shopping-infographic/amp/
- Forbes. (2019). Why internet shopping isn’t always better for the environment. Available at (accessed 12 July 2020). Forbes Media LLC. https://www.forbes.com/sites/heatherfarmbrough/2019/10/14/why-internet-shopping-isnt-always-better-for-the-environment/#94f366d5c189
- Fornell, C., & Larcker, D. F. (1981). Evaluating structural equation models with unobservable variables and measurement error. Journal of Marketing Research, 18(1), 39–50. https://doi.org/https://doi.org/10.1177/002224378101800104
- Garver, M. S., & Mentzer, J. T. (1999). Logistics research methods: Employing structural equation modeling to test for construct validity. Journal of Business Logistics, 20(1), 33.
- Global Web Index. (2018). The rise of green consumerism: what do brands need to know?. Available at (accessed 19 March 2020). Global Web Index. https://blog.globalwebindex.com/chart-of-the-week/green-consumerism/
- Gold, A. H., Malhotra, A., & Segars, A. H. (2001). Knowledge management: an organizational capabilities perspective. Journal of Management Information Systems, 18(1), 185–214. https://doi.org/https://doi.org/10.1080/07421222.2001.11045669
- Grand View Research. (2020). E-commerce Market Share, Growth & Trends Report, 2020-2027. Available at (accessed 03 June 2020). https://www.grandviewresearch.com/industry-analysis/e-commerce-market
- Guckian, M., De Young, R., & Harbo, S. (2017). Beyond green consumerism: Uncovering the motivations of green citizenship. Michigan Journal of Sustainability, 5(1), 73–94. https://doi.org/http://dx.doi.org/10.3998/mjs.12333712.0005.105
- Habib, M. A., Bao, Y., Ilmudeen, A., & Soobaroyen, T.. (2020). The impact of green entrepreneurial orientation, market orientation and green supply chain management practices on sustainable firm performance. Cogent Business & Management, 7(1), 1743616. https://doi.org/https://doi.org/10.1080/23311975.2020.1743616
- Hair, J., Hollingsworth, C. L., Randolph, A. B., & Chong, A. Y. L. (2017). An updated and expanded assessment of PLS-SEM in information systems research. Industrial Management & Data Systems, 117(3), 442–458. https://doi.org/https://doi.org/10.1108/IMDS-04-2016-0130
- Hair, J. F., Anderson, R. E., Babin, B. J., & Black, W. C. (2010). Multivariate data analysis: A global perspective. Pearson.
- Han, H., Hsu, L. T. J., & Sheu, C. (2010). Application of the theory of planned behavior to green hotel choice: Testing the effect of environmentally friendly activities. Tourism Management, 31(3), 325–334. https://doi.org/https://doi.org/10.1016/j.tourman.2009.03.013
- Han, H., Kim, W., & Hyun, S. S. (2014). Overseas travelers’ decision formation for airport-shopping behavior. Journal of Travel & Tourism Marketing, 31(8), 985–1003. https://doi.org/https://doi.org/10.1080/10548408.2014.889643
- Henseler, J., Ringle, C. M., & Sarstedt, M. (2015). A new criterion for assessing discriminant validity in variance-based structural equation modeling. Journal of the Academy of Marketing Science, 43(1), 115–135. https://doi.org/https://doi.org/10.1007/s11747-014-0403-8
- Himanshu. (2016). How e-commerce is impacting our carbon footprint?. Available at (accessed 18 July 2020). https://medium.com/@tyagi83/how-e-commerce-is-impacting-our-carbon-footprint-ffe1f9950b65
- Hsu, C. H., & Huang, S. (2012). An extension of the theory of planned behavior model for tourists. Journal of Hospitality & Tourism Research, 36(3), 390–417. https://doi.org/https://doi.org/10.1177/1096348010390817
- IISD. (2013). Who are the green consumers? International Institute of sustainable development. Available at (accessed 09 June 2020). International Institute for Sustainable Development. https://www.iisd.org/business/markets/green_who.aspx
- Jiang, L. A., Yang, Z., & Jun, M. (2013). Measuring consumer perceptions of online shopping convenience. Journal of Service Management, 24(2), 191–214. https://doi.org/https://doi.org/10.1108/09564231311323962
- Jibril, A. B., Kwarteng, M. A., Pilik, M., Botha, E., & Osakwe, C. N. (2020). Towards understanding the initial adoption of online retail stores in a low internet penetration context: an exploratory work in Ghana. Sustainability, 12(3), 854. https://doi.org/https://doi.org/10.3390/su12030854
- Jusoh, Z. M., & Ling, G. H. (2012). Factors influencing consumers’ attitude towards e-commerce purchases through online shopping. International Journal of Humanities and Social Science, 2(4), 223–230.
- Kline, R. B. (2011). Principles and practice of structural equation modeling (3rd ed ed.). Guilford.
- Lee, S. M., Sung Rha, J., Choi, D., & Noh, Y. (2013). Pressures affecting green supply chain performance. Management Decision, 51(8), 1753–1768. https://doi.org/https://doi.org/10.1108/MD-12-2012-0841
- Lei, P. W., & Wu, Q. (2007). Introduction to structural equation modeling: issues and practical considerations. Educational Measurement: Issues and Practice, 26(3), 33–43. https://doi.org/https://doi.org/10.1111/j.1745-3992.2007.00099.x
- Lewin, K. (1951). Field theory in social science: Selected theoretical papers. (D. Cartwright, ed.). Harper & Row.
- Los Angeles Times. (2011). Online shopping: better for the environment?. Available at (accessed 02 March 2020). https://latimesblogs.latimes.com/home_blog/2011/12/online-shopping-vs-traditional-shopping.html%20
- Nielsen. (2018). Future opportunities in FMCG E-commerce: market drivers and five-year forecast. Available at (accessed 18 March 2020). Nielsen Holdings. https://www.nielsen.com/wp-content/uploads/sites/3/2019/04/fmcg-eCommerce-report.pdf
- Nunnally, J. C., & Bernstein, I. H. (1994). The assessment of reliability. Psychometric Theory, 3(1), 248–292.
- Perugini, M., & Bagozzi, R. P. (2001). The role of desires and anticipated emotions in goal directed behaviours: broadening and deepening the theory of planned behaviour. The British Journal of Social Psychology, 40(1), 79–98. https://doi.org/https://doi.org/10.1348/014466601164704
- Pittayachawan, S., Abareshi, A., Kam, B., & Teo, L. (2014). Green consumerism: A study on the prospect of consumers’ participation in corporate environmental management programs. In ISL2014: Designing Responsible and Innovative Global Supply Chains (pp. 670–678). University of Nottingham.
- Podsakoff, P. M., MacKenzie, S. B., Lee, J. Y., & Podsakoff, N. P. (2003). Common method biases in behavioral research: A critical review of the literature and recommended remedies. Journal of Applied Psychology, 88(5), 879. https://doi.org/https://doi.org/10.1037/0021-9010.88.5.879
- Research and Markets. (2020). The environmental impact of E-commerce 2020. Available at (accessed 12 July 2020). https://www.researchandmarkets.com/reports/4911530/the-environmental-impact-of-e-commerce-2020
- Rogelberg, S. G., & Stanton, J. M. (2007). Introduction understanding and dealing with organizational survey nonresponse. Organizational Research Methods, 10(2), 195–209. https://doi.org/https://doi.org/10.1177/1094428106294693
- Saarijärvi, H., Sutinen, U. M., & Harris, L. C. (2017). Uncovering consumers’ returning behaviour: A study of fashion e-commerce. The International Review of Retail, Distribution and Consumer Research, 27(3), 284–299. https://doi.org/https://doi.org/10.1080/09593969.2017.1314863
- Statista. (2020). Retail e-commerce sales worldwide from 2014 to 2023. Available at (accessed 09 June 2020). https://www.statista.com/statistics/379046/worldwide-retail-e-commerce-sales/
- Stevens, J. P. (2012). Applied multivariate statistics for the social sciences. Routledge.
- Sustainable Brands. (2016). Consumers love E-commerce’s convenience, but not its cardboard. accessed 03 March 2020. https://sustainablebrands.com/read/chemistry-materials-packaging/consumers-love-e-commerce-s-convenience-but-not-its-cardboard
- Sustainable Earth. (2012). Why E-commerce is good for the environment. Available at (accessed 02 March 2020). http://www.isustainableearth.com/sustainable-living/why-e-commerce-is-good-for-the-environment
- Taylor, S. A., Ishida, C., & Wallace, D. W. (2009). Intention to engage in digital piracy: A conceptual model and empirical test. Journal of Service Research, 11(3), 246–262. https://doi.org/https://doi.org/10.1177/1094670508328924
- The Sun. (2016). AMAZON DELIVERY DODGE 7 ways to get free delivery on your amazon orders. Available at (accessed 03 March 2020). https://www.thesun.co.uk/uncategorized/1818369/7-ways-to-get-free-delivery-on-your-amazon-orders/
- Tiwari, S., & Singh, P. (2011). Environmental impacts of e-commerce. In International conference on environment Science and engineering, 8, 202–207.
- Trochim, W. M. K. (2020). Convergent & discriminant validity. Available at (accessed 18 July 2020). https://conjointly.com/kb/convergent-and-discriminant-validity/
- UAE. (2020). Environmental challenges. Available at (accessed 18 July 2020). https://u.ae/en/information-and-services/environment-and-energy/environmental-challenges-in-the-uae
- Venkatraman, N. (1989). The concept of fit in strategy research: toward verbal and statistical correspondence. Academy of Management Review, 14(3), 423–444. https://doi.org/https://doi.org/10.5465/amr.1989.4279078
- Weber, C. L. & Mathew, H.(2008). Quantifying the global and distributional aspects of American household carbon footprint. Ecological Economics, 66(2–3), 379–391.
- Weideli, D. (2013). Environmental analysis of US online shopping. Available at (accessed 10 June 2020). https://ctl.mit.edu/sites/default/files/library/public/Dimitri-Weideli-Environmental-Analysis-of-US-Online-Shopping_0.pdf
- White, K., Hardisty, D. J., & Habib, R. (2019). The elusive green consumer. Harvard Business Review, Magazine, July–August Issue, 124–133.
- World Economic Forum. (2020). Online shopping is polluting the planet - but it’s not too late. Available at (accessed 04 March 2020). World Economic Forum. https://www.weforum.org/agenda/2020/01/carbon-emissions-online-shopping-solutions/
- Yue, B., Sheng, G., She, S., & Xu, J. (2020). Impact of consumer environmental responsibility on green consumption behavior in China: the role of environmental concern and price sensitivity. Sustainability, 12(5), 2074. https://doi.org/https://doi.org/10.3390/su12052074
Appendix 1—Survey Instrument
Demographics
Your gender
Male
Female
Your age
Below 18
18–30
31-45
46–60
Above 60
Your education level
High school
Professional degree/Diploma/Technical degree
Bachelor’s degree
Master’s degree
Doctorate degree
Others
Your monthly Income (USD)
Up to 2000
2001–5000
5001–10000
10,001–15000
15,001–20000
More than 20,000
Your nationality
——————————————————————-
Green Consumerism (GC)
Please rate your level of agreement with the following questions on a scale of 1–5
[Strongly Disagree (1); Disagree (2); Neither agree nor disagree (3); Agree (4); Strongly agree (5)]
Positive Environmental Attitudes (PEA)
Please rate your level of agreement with the following questions on a scale of 1–5
[Strongly Disagree (1); Disagree (2); Neither agree nor disagree (3); Agree (4); Strongly agree (5)]
Negative Environmental Attitudes (NEA)
Please rate your level of agreement with the following questions on a scale of 1–5
[Strongly Disagree (1); Disagree (2); Neither agree nor disagree (3); Agree (4); Strongly agree (5)]
Section E—Perceived Ease of Use (PEOU)
Please rate your level of agreement with the following questions on a scale of 1–5
[Strongly Disagree (1); Disagree (2); Neither agree nor disagree (3); Agree (4); Strongly agree (5)]
Section F—Perceived Usefulness (PU)
Please rate your level of agreement with the following questions
Section G—Behavioral Intention to Use (BITU)
Please rate the performance benefits from implementing Industry 4.0 technologies