?Mathematical formulae have been encoded as MathML and are displayed in this HTML version using MathJax in order to improve their display. Uncheck the box to turn MathJax off. This feature requires Javascript. Click on a formula to zoom.
Abstract
This study primarily aims to identify the determinants of Vietnamese commercial banks’ performance from 2009 to 2020. Recent developments in the economy have brought banks’ performance and their operations into the limelight. The paper deals with the CAMELS model as a framework for evaluating and measuring banks’ performance. Additionally, using the quantitative regression method, the System Generalised Method of Moments (SGMM), and combining the previous studies, the author examined ten statistically significant factors, including all the pro-rata of the CAMELS model. Furthermore, the obtained results highlight the relationship between ownership type and banks’ performance, implying that state-owned banks must improve and increase their soundness.
PUBLIC INTEREST STATEMENT
The Bank is also a particular category of businesses in which shareholders invest in the banks to maximize profits or increase the earnings per share.
The paper deals with the CAMELS model as a system for evaluating banks’ performance. Additionally, using the quantitative regression method, the System Generalised Method of Moments (SGMM) and combining the previous studies, the author has examined ten statistically significant factors, including all the pro-rata of the CAMELS model. Furthermore, the obtained results highlight the relationship between ownership type and bank’s performance to imply that state-owned banks must improve and increase their soundness.
1. Introduction
A commercial bank whose function is to make money by lending and mobilizing funds. The banking system the engine of growth and an important part of the country’s economic development. As a result, banks have emerged as one of the most important financial resources for businesses (Nimalathasan, Citation2008). As a result, the banking system is critical in modern societies, and its performance is a key indicator of a country’s financial health.
Evidence from the global financial crisis in 2008, the study by Claessens and Horen (Citation2014) proved financial crises originate from some factors of assets, risks, capital, management, and even financial leverage under their vast literature summary. Crises arise from the financial sector, especially from bank problems, such as non-performing loans (NPLs) and the level of credit risks. In detail, putting the size of NPLs and potential NPLs based on the relation to the banking system’s equity capital (and loan loss provisions) in different countries creates different NPLs’ levels that lead to potential other risks. Therefore, the capital adequacy ratio required by Basel and central banks of each country in the world to maintain a minimum level to ensure that the bank has enough capital to operate its business and absorb any financial downturn without defaulting (Fatima, Citation2014). It has demonstrated that having good management of risks and a maintenance capital adequacy ratio ensure the banking system’s smooth running and effective performance.
In the sensitive and competitive market, the bank’s performance will be hurt, and its consequence is spreading to many parties in the economy. The failure of the banks will cause issues such as frozen customer deposits, fractured loan relationships, and shrinking credit lines in the company. Furthermore, the negative externalities of bank failure, which typically have a domino effect, pose a systemic risk to the banking sector as a whole. To avoid failure costs for the bank and the economy, the government and the Central Bank should inspect and supervise the bank’s operations carefully and strictly. As a result, management, control, and supervision policies are being reshaped and reoriented to meet the challenge of systemic risks. The government’s fundamental challenge in this changing environment is to keep the financial system stable while also taking advantage of business and development opportunities (Arora & Kaur, Citation2006).
To put it another way, the primary goal of financial and non-financial institutions is to measure and manage their performance effectively. In terms of subjects, models, and methods, banking efficiency studies are becoming increasingly diverse. Besides the methods used to measure banks’ performance, another issue is considered. That is the impact of various factors on a bank’s performance, such as bad debt, bank capitalization, and liquidity.
CAMELS, PATROL, and ORAP are some methods used to evaluate and determine banks’ performance and overall financial health. The CAMELS model is one of these methods, which is a very appropriate and accurate proxy for measuring bank performance and predicting failure (Doumpos & Zopounidis, Citation2010; Oztorul, Citation2011; Salhuteru & Wattimena, Citation2015). The CAMELS framework emphasizes banking system parameters by evaluating performance using the income statement, whereas PATROL is a systematic monitoring tool for individual banks’ financial health, and ORAP is a multi-factor analysis system that aims to detect potential weaknesses in banks by controlling and examining all operational and environmental risk components.
The CAMELS system was found to be very useful by Barker and Holdsworth (Citation1993), Crystal et al. (Citation2002), and Grier (Citation2007), who used it as a model for predicting bank failure with a specified rating principle based on both quantitative and qualitative information about the bank. Aside from that, Hirtle and Lopez (Citation1999) looked at previous CAMELS criteria to assess current bank conditions, arguing that the supervisory information in previous CAMELS ratings provides more insight into current bank conditions. The CAMELS method, which uses pro rata to measure and evaluate the banking sector’s performance, has been used in several studies. This CAMELS model determines the quality of income, liquidity, capital adequacy, and banking service level by measuring quantitative management to achieve banks’ goals. Collecting formal and informal data to help clients and investors identify their investment behaviours is part of a bank’s performance analysis. These studies have shown that the CAMELS analysis can examine and emphasize the importance of credit ratings and the financial health of commercial banks. As a result, banks should figure out how to manage and evaluate their resources for operations and investment decisions in the most efficient way possible. The CAMELS method, which uses financial ratios to assess the banking system’s performance, is a common method for evaluating banks’ performance (Rozanni & Rahman, Citation2013).
The CAMELS ratings method is still considered an effective way to assess a bank’s conditions worldwide. As a result, the State Bank of Vietnam (SBV) has agreed on a banking evaluation framework for the entire industry in the spirit of absorbing ideas from the CAMELS Principles, which have been in effect since 2019. In the eyes of the SBV, CAMELS is a set of useful tools for evaluating and ranking banks and setting standards for commercial banks to improve efficiency and develop business capacity.
The CAMELS model considers the conditions and operations of banks to provide a more accurate assessment of their soundness. This paper aims to provide an accurate and consistent evaluation of a bank’s performance by using the CAMELS method. The study uses the System Generalized Method of Moments (SGMM) to define the determinants of bank performance in Vietnam. The literature review and the CAMELS method are briefly described in the first section of paper. The second section will mention about related studies and the method of analyzing the data to answer the research question, “What are the determinants of Vietnamese commercial bank’s performance?” The study’s findings are interpreted and discussed in the final section. Besides the findings, the author also identifies some limitations of this study and suggests future research directions.
Implementing the SGMM model to deal with the model’s endogeneity is one of this paper’s practical contributions. Furthermore, the study raises a new issue when using CAMELS to measure bank’s performance is whether the bank’s ownership type affects its performance because state-owned commercial banks in Vietnam perform less efficiently than joint-stock commercial banks.
2. Literature review and hypothesis development
2.1. Bank performance
Commonly, to measure the firm’s performance, financial ratios are the quantitative metrics in most of studies for all differential business sectors, including banking. Bank performance is defined as the main driver of profitability generated from their operations. Besides, it is the pillar and the purpose of any banking activity (Ferrouhi, Citation2018). In the world and Vietnam, the popular ratios are used to measure bank performance as return on assets (ROA) and return on equity (ROE). In aspect of the financial analysis, those ratios interpret the accounting value based on historical cost principle because they lead to the latency in the measurement of performance compared to the market value. Due to timeliness, a market index is an accurate value for firm’s performance measurement that is reasonably necessary for investors who focus on market value instead of ROA, and ROE comes from organization’s internal activities.
Thus, firm value can be measured internally (Brigham & Houston, Citation2006). On the external aspect, from the empirical studies by Mohan and Ruggiero (Citation2007) and Reddy et al. (Citation2008), who estimate firm performance by Tobin’s Q ratio is a market-based measurement. This ratio expresses investors’ expectations that show the invested company’s good growth and powerful comparative advantages (Campbell & Mínguez-Vera, Citation2008; Rose, Citation2007). According to them, in this case, the low value of this ratio shows a company’s weak resources. Besides, Chen et al. (Citation2006); Nguyen et al. (Citation2014), the formula of calculation Tobin’s Q is the sum of the market value of a firm’s stock and the book value of debt divided by the book value of total assets (Nguyen et al., Citation2015).
Especially, Tobin’s Q has the advantage of displaying the present value of predicted future economic benefits, so it has highly correlated to level of performance (Copeland et al., Citation2005; Rostami, Citation2015b; Vafeas & Theodorou, Citation1998). In details, several researchers have investigated these linkages using the Tobin’s Q, which relates investment in physical capital to the ratio of the market value of financial claims on the firm and the cost of reproducing its existing stock of capital, as proposed by Keynes (Citation1936) and Tobin (Citation1969). So, Tobin’s Q ratio is widely used in the financial literature as a proxy for future investment opportunities, as well as to investigate various financial performance and decisions. A Tobin’s Q is greater that one means that the shareholders believe the company is worth more than its book value; a value smaller than one means that the market is expecting the company. It is close to one, indicating that the company is in a state of equilibrium. It is also known as the Tobin’s Q theory or general equilibrium theory (Brainard & Tobin, Citation1968). This ratio has been used to explain the relationship between managerial ownership and firm value (McConnell & Servaes, Citation1990; Morck et al., Citation1990). The Tobin’s Q ratio is used by Lang et al. (Citation1989), Servaes (Citation1991) to investigate the relationship between bidder and target stockholder returns and market valuation. Tobin’s Q also represents the financial reporting decisions made by management (Skinner, Citation1993).
Therefore, from the above discussion, this paper uses Tobin’s Q as a proxy to measure a bank’s performance in Vietnam because it reflects the market value of listed banks on the stock exchanges in terms of finance.
2.2. Factors affect bank’s performance
2.2.1. CAMELS
In the 1940s, the number of failed U.S. banks had increased and created a heightened perception of banks’ supervisors, regulators, and stakeholders. Additionally, the 2007–2008 global financial crisis has triggered both national and international economies’ realization of the importance of banking performance from its activities that need supervised mechanisms. The existence of the CAMELS rating system clarifies and categorizes financial conditions of the entire banks’ activities and measures the banking sector’s financial performance and market discipline.
On 13 November 1979, The Federal Financial System Examination Council (FFIEC) issued the decision to use the uniform Financial Institutions Rating System, called CAMEL, the rating system. Under the 1997 revision, it assigned each financial institution a composite rating (or “CELS” rating) that comprises six critical indicators of an institution’s financial condition and operations summarised into a composite “CAMELS” rating. So, most banks use this model across the world as a performance evaluation technique (Raiyani, Citation2010). Overall, to assess banks’ financial condition, the CAMELS supervisory rating system was built and introduced first in the U.S for inside monitoring.
CAMELS is an acronym containing the following six words: Capital Adequacy (C), Asset Quality (A), Management (M), Earnings (E), Liquidity (L), and Sensitivity to Market Risk (S). Based on the literature and reviews of previous researchers, each component is mentioned concretely. Because CAMELS is a synthesizing criteria method to evaluate and measure bank performance, it will facilitate commercial banks in effectively managing their business activities.
Firstly, capital adequacy (C) related to the sufficiency of the amounts of capital for absorbing any potential risks that a bank may encounter. According to Kosmidou (Citation2008), the capital adequacy ratio is an important measure to identify financial institutions’ conditions and the banks’ wellness. Applied capital adequacy strictly controlled financial stability and banks’ health. This ratio represents the percentage of a bank’s assets that are readily available to meet a lender’s future obligations aims to identify the potential for various forms of risks concerning capital retention (Suresh & Paul, Citation2010). In the buffer theory, according to Milne and Wiley (Citation2001), a buffer is a term indicates excess capital that a bank holds in excess of the minimum requirement. So, Milne and Wiley (Citation2001) assume that banks with their capital slightly above the minimum regulatory ratio should constantly increase their capital ratios and reduce risks to avoid regulatory penalties and ensure the safety of banking operations. It forced banks to raise their capital ratios when they are close to the required minimum. The view of Berger et al. (Citation1995) is that banks can hold large amounts of capital to explore unforeseen future investment opportunities. According to them, banks may choose to have a capital buffer to reduce the possibility of their capital falling below the statutory requirement, mainly if the ratio is very volatile. A proper capital adequacy ratio ensures that the bank has enough capital to expand its activities, and smooth running. It is the ratio that determines the bank’s capacity to deal with NPLs and other risks like credit risk, market risk, operational risk … (Fatima, Citation2014). Capital adequacy ratio (CAR) is a safety indicator in the operation of all banks and is clearly stated in the regulations of international banks (Basel, Citation2010). Capital adequacy is one of the most important indicators of a bank’s financial health, as it ensures shareholders’ interests, prevents bank bankruptcy, and keeps banks alive in general. This ratio indicates whether the bank has enough capital to endure future unanticipated losses. If the CAR is high, it means the banks can absorb losses resulting from their operations. As a result of Basel and the central banks of each country’s requirements, banks may hold more capital than is required by regulations. Bashir and Hassan (Citation2004) used internal and external factors to predict the profitability of Islamic banks during 1994–2001. The results show that high capital leads to high profitability. Goddard et al. (Citation2004), Pasiouras and Kosmidou (Citation2007) support Hassan’s study when the concluded a positive relationship exists between the performance of banks and CAR at European and UK banks, respectively. These findings are in line with the research of Kaur (Citation2010), Sangmi and Nazir (Citation2010), Soni (Citation2012), and Rozzani and Rahman (Citation2013), and Rahman et al. (Citation2015). From the discussion, the hypothesis that can be proposed is that capital adequacy has positively affected bank’s performance.
H1: capital adequacy has a positive effect on bank’s performance.
Secondly, asset quality (A) reveals the bank’s asset risk situation and financial institutions or earning power. It measures as assets or good creditworthiness that can be a significant factor in banks’ solvency consideration. The quality of assets can be generally calculated using indicators such as NPLs. The low-quality assets imply a higher possibility exists for granted loans to become NPLs as defaulted loans that cannot create profits for the banks (Petersson & Wadman, Citation2004). According to the International Monetary Fund (IMF), a non-performing loan is any loan in which interest and principal payments are over 90 days overdue (IMF, Citation2009). NPLs often refer to loans that have been extended for a relatively long time without generating income and show its principal and/or interest on these loans that have been unpaid for at least 90 days. Typically, most NPLs are often associated with bank failures and financial crises in developing and developed countries (IMF, Citation2009). NPLs are considered a prominent problem and affect the bank’s performance. Therefore, the relationship has been thoroughly studied with many remarkable achievements by some economists Mester (Citation1996), Berger and DeYoung (Citation1997), Berger and Mester (Citation1997), and Koutsomanoli–Filippaki et al. (Citation2009). The researchers have demonstrated the relationship between NPLs and bank performance. A lower asset quality ratio shows a higher bank’s performance. Effective management and reasonable lending policies will help banks grow again and eliminate NPLs, hence their performance will improve. The effect of NPLs can be devastating to an economy if not check as a multiple of failure banks can erode the confidence of the banking public, this will have a negative implication on the whole banking industry. Research by Nathan et al. (Citation2020) states that in order to minimize NPL and improve the performance of the commercial banking sector in Uganda, a number of reforms have been carried out including restructuring, namely the takeover of bankrupt banks which are then sold and combined with other banks (mergers), bureaus credit reference (CRB) to reduce information gaps between lenders and borrowers with; provide timely and accurate information about the borrower’s debt profile, and payment history. Besides, the studies of Olweny and Shipho (Citation2011), Dang (Citation2011), Rozzani and Rahman (Citation2013), Balango and Rao (Citation2017), and Kingu et al. (Citation2018), and Patwary and Tasneem (Citation2019) have concluded NPLs affect bank’s performance negatively. Hence, the hypothesis is proposed that asset quality has a negative influence on banks’ performance.
H2: asset quality has a negative effect on bank’s performance.
Thirdly, management quality (M) refers to the entity’s overall well-being management as a fundamental necessity for all organizations, including the bank. Monitoring and controlling risks at a specific level depends on the board of directors and senior managers’ managerial skills. Management also relates to the professional competency of the bank’s managers, who use their expertise to make subjective judgments, create strategic missions and make economic decisions. The agency problem exists in any organization, without exception in banks. According to Berle and Means (Citation1932), the separation of owners and managers has resulted in conflicts in their interests. The agent’s goals are no longer perfectly aligned with the principal’s initial goals. Hence, the cost of disagreement is called the agency cost (Jensen & Meckling, Citation1976). Two parties concern about the business’s performance, but their objectives are different. The owners aim to maximize the value of company and the return on equity or earnings per share. While managers try to achieve more incentives and bonuses because they are generally paid more if they obtain higher realized performance, especially in the face of uncertainty and information asymmetry. For resolving agency problems, contracts are seen as an appropriate means of management and binding between owners and managers. According to Golin (Citation2001), the measurement of management is the most challenging and unpredictable. However, to measure it, the ratio of operating costs to income (CIR) is used. This ratio is operating expenses, including management costs, fixed costs to earnings. A low CIR ratio implies managers possess the skills and knowledge to manage the bank efficiently. It is also explained by the theory of transaction costs and the bad management hypothesis. Those theories were proposed by Schwartz (Citation1974), Berger and DeYoung (Citation1997), respectively, which suggest banks may rely on specialists to evaluate and manage banking activities. According to Roman and Sargu (Citation2013), total non-markup expenses are operating expenses, including salaries and related expenses, other administrative expenses, and other provisions. It indicates the company’s ability to meet operating expenses from the banks’ assets and revenues. The lower the ratio, the better the bank’s performance will be (Chandani et al., Citation2014; Liu & Pariyaprasert, Citation2014; Olweny & Shipho, Citation2011; Roman & Sargu, Citation2013; Venkatesh & Suresh, Citation2014). From theoretical and empirical evidence, the hypothesis is that management has a negative influence on banks’ performance.
H3: management has a negative effect on bank’s performance.
Fourth, increasing capital sources depend on the managers and managers decisions because the cost of capital affects the bank’s performance. In case the cost of capital decreases and the value of the firm increases, then leverage is used optimally (minimum cost of capital or maximum firm value) and vice versa (Solomon, Citation1959). The capital structure’s explanation base on the trade-off theory and the pecking order theory. The trade-off theory rationalizes firms maximize their value when the additional benefit (marginal benefit) derived from debt (i.e., tax deductions for interest expenses, the disciplinary role of debt) is equal to the marginal cost of debt (i.e., bankruptcy costs, agency costs between related and bondholders). Myers and Majluf (Citation1984) developed the pecking order theory and stated that firms want to finance new investments initially with retained earnings, then with debt, and finally with equity. The theory predicts that firms will apply their financing to minimize associated costs and prefer internal financing to external financing and debt-equity. In addition, the trade-off theory of capital structure explains a bank’s leverage, whether the bank is financed with equity or debt. This theory asserts that banks should perform a cost-benefit analysis before deciding whether to use debt or equity in their capital structure. According to Niu (Citation2008), the benefit of using debt in the capital structure is the tax advantage (tax shield). The choice of funding source will affect the earnings of the organization. So, earnings (E) are added to the owners’ capital, whereas the losses will be subtracted from the capital. The earning index shows the trend of net income and analyses the stability of expected income growth in the future. In the long term, any financial institution must satisfy the going concern concept assumption for continuous operation. Therefore, banks must obtain profitability. The most common indicators used to measure any entity’s income and profitability are ROA and ROE. ROA is the ratio of net income to total assets. The higher this ratio, the greater the return on assets implemented and deployed by the banks, while ROE is the ratio of the returns to the total owners’ equity. This ratio also shows the banks’ efficiency and effectiveness, which means the banks have used their capital in thoughtful ways. Long-term sustainability is a requirement for the operation of any financial institution. Thus, the most frequently used measures in assessing the performance of any organization include the two ratios above. They can be used to determine whether net profits are being generated. This reflects productivity in that no matter how professional the bank employees are, every bank must still make their valuable resources available to more people. ROA and ROE are expected to positively affect the bank’s performance (Chandani et al., Citation2014; Jha & Hui, Citation2012; Liu & Pariyaprasert, Citation2014; Rozzani & Rahman, Citation2013; Venkatesh & Suresh, Citation2014). Therefore, the hypothesis is proposed: earnings have a positive influence on banks’ performance.
H4: earnings have a positive effect on bank’s performance.
Fifthly, liquidity (L) is the bank’s capability to quickly and efficiently turn its financial assets into cash or the availability of ready funds to meet all of its financial obligations (Babar & Zeb, Citation2011). This account expansion measure considers the extent to which the bank’s fund practice is sufficient and the available funds’ future resources. The amount of loans determines the degree of liquidity risk that a bank has made relative to deposits. The rise in loan-to-deposit ratio (LDR) suggests liquidity issues for a bank. It can be specified as LDR. It is the ratio between the number of funds channelled to the community (credit) and the number of community funds and own capital used. This ratio illustrates banks’ ability to repay withdrawals by depositors by relying on loans provided as a liquidity source. The higher the ratio implies, the lower the ability of bank liquidity. The LDR significantly negatively affects the bank’s performance (Chandani et al., Citation2014; Elyor, Citation2009; Golin, Citation2001; Jha & Hui, Citation2012; Liu & Pariyaprasert, Citation2014; Venkatesh & Suresh, Citation2014). Hence, the proposed hypothesis is that liquidity has a negative influence on banks’ performance.
H5: liquidity has a negative effect on bank’s performance.
Finally, the sensitivity (S) component was added in 1997. Hence, the CAMEL model has been changed to CAMELS. S stands for sensitivity to market risk, which is associated with the fluctuation of interest rates and other factors (Hays et al., Citation2009), especially during the financial crisis (Kandrac, Citation2014). Additionally, sensitivity to market risk is evaluated by measuring the way of changing commodity prices, interest rates, foreign exchange rates, fixed assets, and management’s ability to identify and control these risks (Masood et al., Citation2016). Although banking activity is largely influenced by the variation of the financial assets’ prices based on the financial position statement, some previous studies have not considered the sixth component of the CAMELS because of the difficulties associated with measurement accounting and financial data. Accordingly, Sarker (Citation2006) and Avkiran and Cai (Citation2012) have eliminated risks and considered the size (S) of the bank, which is represented by the ratio of bank assets to the total assets of the banking sector in the economy. According to Sarker (Citation2006), Avkiran and Cai (Citation2012), Roman and Sargu (Citation2013), Venkatesh and Suresh (Citation2014), and Chandani et al. (Citation2014), and Kumari (Citation2017), sensitivity has an effect on the bank’s performance. Based on this, the proposed hypothesis is sensitivity has influence on bank’s performance.
H6: sensitivity has an effect on bank’s performance.
2.2.2. Other factors
In addition to the components of CAMELS, there are some considerable variables that affect the bank’s performance, like leverage ratio, ownership type, economic growth, and inflation rate.
Leverage ratios are used to determine the degree of financial risk assumed by a business. It indicates an optimal capital structure, showing that banks have equity ratios and creditors. The debt-to-assets ratio shows the proportion of assets financed by debt by comparing total liabilities (short-term and long-term debt) to total assets (Drake & Fabozzi, Citation2010). The ratio of total liabilities to total assets shows as a complement to equity holders’ residual claims. However, leverage may not be a reliable indicator of a firm’s near-term default risk (Rajan & Zingales, Citation1995). According to research conducted in developing countries, such as Booth et al. (Citation2001), Onaolapo and Kajola (Citation2010), Salim and Yadav (Citation2012), and Iavorskyi (Citation2013), there is a relationship between leverage ratio and the financial performance of a firm. However, depending on the circumstances of a particular country, the coefficient of linear expansion of the leverage ratio may be positive or negative. As a result, the author proposes that leverage ratios will hurt a bank’s performance.
H7: leverage has a negative effect on bank’s performance.
The banking literature on developing countries concludes ownership type matters, particularly government or state ownership. According to Bonin et al. (Citation1998), evidence of government-ownership firms’ operations is less efficient than private ownership. Prior studies have examined the relationship between ownership type and performance (Bayyurt, Citation2013; Haider et al., Citation2018; Hasan & Marton, Citation2003; Kasman & Yildirim, Citation2006; Kumar & Gulati, Citation2008; Micco & Panizza, Citation2006; Narwal & Pathneja, Citation2016; Phung & Mishra, Citation2016; Robin et al., Citation2018; Sabi, Citation1996; Sufian and Chong, Citation2008). These studies have determined ownership type as an important factor influencing a firm’s performance and can change depending on ownership types. State-owned banks are believed to have the least efficient performance (Shawtari, Citation2018). La Porta et al. (Citation2002) also found that state-owned banks obtained lower performance than joint-stock commercial banks. The research results of Barth et al. (Citation2001), Cornett et al. (Citation2009), Su and He (Citation2012), and Robin et al. (Citation2018) were also consistent with the above studies. From the above discussion, the proposed hypothesis is ownership influences banks’ performance.
H8: ownership has an effect on bank’s performance.
Gross domestic product (GDP) is defined as annual percentage growth of finished goods and services value at market prices based on a constant local currency (Waqas et al., Citation2017). Along with the inflation factor, GDP is a macro factor affecting organizations taking part in the financial market. Additionally, a growing economy enables businesses to operate more efficiently. During cyclical upswings, economic growth as measured by the GDP growth rate that has a positive impact on bank profitability due to an increase in customer deposits and loans granted and an increase in interest margins (Bikker & Hu, Citation2002; Demirgüç-Kunt & Huizinga, Citation1999). As a result, economic growth is positively related to profitability (Pham Anh Tuyet, Citation2017). GDP, in particular, has a significant positive effect on bank’s performance (Emase, Citation2017; Matar et al., Citation2018; Sufian & Habibullah, Citation2010; Tahsin & Gülşah, Citation2018). Therefore, the hypothesis is proposed: there is a positive influence of GDP on the bank’s performance.
H9: GDP has a positive effect on bank’s performance.
The inflation rate is the annual percentage growth of several popular indexes of money prices, most commonly measured by the percentage increase in the consumer price index (White, Citation1999). The inflation rate represents the growth rate of the price level of the economy. Macroeconomic factors, including inflation rates, are signalers of uncontrolled failures that banks face because of changes. Research by Mileris (Citation2012), Chaibi and Ftiti (Citation2015) has noted that macroeconomic factors have a powerful impact on the economic environment where business entities and business entities are involved in currency activities. The research of J. Boyd and Smith (Citation1998), John H. Boyd and Champ (Citation2006), Cetin (Citation2019), and Mbabazize et al. (Citation2020) found that there is a negative relationship between inflation and bank’s performance. Whereas, the following studies demonstrated their positive correlation, namely Guru et al. (Citation2002), Jiang et al. (Citation2003), Fadzlan (Citation2009), Miguel Á. et al. (Citation2018), and Gilbert and Jaya (Citation2019), and Almansour et al. (Citation2021). Hence, the hypothesis is inflation has effect to bank’s performance.
H10: inflation has an effect on bank’s performance.
2.3. Empirical research
In recent years one of the most used models for the estimation of a bank performances and soundness is represented by the CAMELS framework (Derviz & Podpiera, Citation2008; Elyor, Citation2009; Mishra et al., Citation2012).
Elyor (Citation2009) proved that the CAMELS model is a valuable model to evaluate bank performance. Olweny and Shipho (Citation2011) have also used the CAMELS model to analyze the determinants of Kenya banks’ profitability, and the results showed that all the bank-specific factors (e.g., five categories) that came from the CAMELS model had a statistically significant variable, and they have an important effect on the profitability of a bank. The categories of components in the CAMELS model are based on the previous studies of Obamuyi (Citation2013), Rozzani and Rahman (Citation2013), Rodica-Oana (Citation2014), Salhuteru and Wattimena (Citation2015), Magweva and Marime (Citation2016), and Lelissa and Kuhil (Citation2018), and Nguyen and Dang (Citation2020), and Anh Huu Nguyen et al. (Citation2020), and Obamuyi (Citation2013) looks at how bank capital, bank size, expense management, interest income, and the economy affect bank profitability in Nigeria. The fixed effects regression model was used on panel data from the financial statements of 20 banks from 2006 to 2012. According to the findings, capital, size, interest income, expense management efficiency, and favorable economic conditions contribute to higher bank performance and growth.
Rozzani and Rahman (Citation2013) used the CAMELS rating to investigate bank performance, with the primary goal of examining both Islamic and conventional banks’ performance in Malaysia. Year-end financial data from 2008 to 2011 was gathered from these banks’ annual reports, and 19 conventional banks and 16 Islamic banks were chosen as study samples. According to the analysis, the levels of performance for both conventional and Islamic banks in Malaysia were highly similar. Their results show that Management Quality (1.00) is one component of CAMELS that received the highest overall rating in the study’s data samples. Asset Quality (1.91), Compliance (2.05), Capital Adequacy (2.10), Earnings Quality (2.93 and 3.51), and Liquidity were the following most important components (3.59 and 4.37). It was also clear that bank regulators needed to emphasize Earnings Quality and Liquidity, as these two elements had portrayed these banks as having poor earnings and liquidity management.
The goal of Liu and Pariyaprasert (Citation2014) study is to see how independent variables from the CAMEL model affect bank performance in China’s banking sector. Capital adequacy, asset quality, management, earnings, and liquidity are independent variables in the CAMEL model. The sample size for this study was 13 Chinese banks listed on the Shanghai and Shenzhen Stock Exchanges between 2008 and 2011. This study used a fixed-effect model to measure the relationship between components of the CAMEL model and bank performance. According to the findings of this study, the risk-weighted capital adequacy ratio, NPLs to total loans ratio, the cost to income ratio, net interest rate margins, and loans to deposits ratio are all factors that affect the return on assets. Meanwhile, according to this research, the cost-to-income ratio, operating expenses-to-assets ratio, and loans-to-deposits ratio all impact return on equity.
Salhuteru and Wattimena (Citation2015) used secondary data from the state bank’s monthly financial report published by Bank Indonesia between 2012 and 2013. Discretionary accruals, which have been adapted to the characteristics of banking, are used to manage earnings. The coefficient of earnings management was calculated by regressing total accruals, which were calculated using the Healy and Jones model. Multiple regression was used to test the impact of earnings management and the effect of the CAMELS ratio on earnings management. This study’s findings show that Government Bank’s net profit margin (NPM) has a positive impact on earnings management. The adverse effects of CAR and market risk (MR) are not significant. Positive return on risked assets (RORA), ROA, and LDR are not significant in terms of earnings management. According to Private Bank, ROA, NPM is a significant variable that has a positive influence on earnings management. The negative effects of CAR and LDR are not significant. Positive RORA and MR have no relevance on earnings management.
Magweva and Marime (Citation2016) investigates whether bank-specific factors significantly impact bank performance as measured by ROA. The relationship between internal bank features and bank performance in Zimbabwe was investigated by using the quantitative method based on panel data. The findings revealed that while bank-specific indicators were not significant in determining bank performance, external bank factors are statistically significant variables. The researchers recommended that the Central Bank take a softer stance to focus on the bank’s capital requirement because this factor does not significantly affect firms’ return on assets, even though it improves the sector’s soundness and stability.
One of the critical research questions investigated by Lelissa and Kuhil (Citation2018) was how bank-specific factors relate to bank performance. The model developed is based on CAMEL, a widely used supervisory tool for monitoring bank performance. Capital Adequacy, Asset Quality, Management, Earnings, and Liquidity are all factors to consider. It used five variables to represent each component and used fixed and random models to run a regression model. According to the findings, many of the bank’s specific factors have a significant statistical relationship with performance measures. Despite the mixed results of the various models, the study found that the bank’s capital position, asset quality, and business diversification, cost control, and liquidity positions are all important aspects of management decisions that impact performance.
The impact of CAMEL components on the financial performance of commercial banks in Vietnam was investigated by Nguyen et al. (Citation2020). Four of CAMEL’s key indicators (capital adequacy, asset quality, management effectiveness, and bank liquidity) are used as independent variables, while ROA, ROE, and net interest margin (NIM) are used as proxies for commercial banks’ financial performance as dependent variables. Over 6 years, from 2013 to 2018, the research sample included 31 Vietnamese commercial banks. The fixed-effects model (FEM) fits the research method better than the ordinary least squares (OLS) and random effects models (REM), according to the findings. The performance of Vietnamese commercial banks is influenced by capital adequacy, asset quality, liquidity, and management efficiency, according to the findings.
For the research period from 2007 to 2019, Nguyen and Dang (Citation2020) empirically examined the bank-specific determinants of loan growth in the Vietnamese banking system. Authors use dynamic panel regression to determine the effects of each CAMELS factor on bank lending using the CAMELS framework. They also use alternative variable definitions and specifications with the CAMELS components to ensure robust results. They discovered that banks with a large capital buffer expand their lending more quickly. They address that banks that are more profitable and have better competitive advantages may be able to expand their lending activities. Then, high asset quality may contribute to high loan growth positively; in other words, banks with a high credit risk are less likely to make loans. Less well-managed banks are more likely to pursue aggressive lending strategies, highlighting Vietnamese banks’ moral hazard incentives. Bank loan growth is positively related to liquidity. Because interest-rate-sensitive banks may be concerned about the harmful effects of unpredictably adverse interest rate changes in the future, perceived interest rate risk restricts loan growth.
According to the author’s review of related studies, the paper realize that previous researchers used the components of CAMEL or CAMELS to investigate their impact on bank’s performance. However, to address the differentiation with the studies of Anh Huu Nguyen et al. (Citation2020); Nguyen and Dang (Citation2020), ownership and leverage variables are added into the model.
3. Research methodology
3.1. Data collection and sampling
The researcher examines the data regularly from 2009 to 2020, with 2009 being the year when the State Bank issued legal documents to ensure the quality of banks’ assets and issues related to bank management activities, and 2020 being the most recent data available on the website and in banks’ annual reports.
At the beginning of 2020, the Vietnamese commercial banking system included 4 state-owned commercial banks, 31 joint-stock commercial banks, 9 full-foreign owned banks and 2 joint-venture banks. However, this research only focuses on commercial banks. Thus, the regression model’s sample size is 35 banks compared with 46 banks in Vietnam. Given that the dataset involves a large number of banks (N = 35) and a small number of years (T = 12), the Arellano-Bond estimation is also suitable for T < N. Listed banks are disclosed in Appendix E. With the secondary data of 35 commercial banks, including 31 joint-stock commercial banks and 4 state-owned commercial banks for the years 2009 to 2020, the research sample is 35 * 12 = 420 observations. Data for analysis are taken from financial statements and annual reports and websites of banks, and the FiinPro database.
3.2. Proposed model
Several ratios and pro-rata can measure bank performance. One valuable and practical tool for the evaluation and decision-making users is Tobin’s Q ratio (Rostami, Citation2015b; Vafeas & Theodorou, Citation1998). In this study, Tobin’s Q ratio is a measure of a bank’s performance and is used as an index of the dependent variable. It is calculated by the total market value and book value liabilities to its book value assets. This ratio is suggested by James Tobin of Yale University (Rostami, Citation2015b; Sadeghi & Kafash, Citation2009).
With a dynamic specification, the general Equationequation [1](1)
(1) is modified as follows:
From EquationEquation [1(1)
(1) ], model 2 is modified in detail as follows (EquationEquation [2]
(2)
(2) ):
The explanation of all variables in the research model is represented in as follows.
3.3. Methodology
With panel data, the OLS method’s estimation cannot be used because of autocorrelation, heteroskedasticity, and exogenous phenomenon. Instead, SGMM with instrument variables are used. This method will make the estimation results valid and reliable.
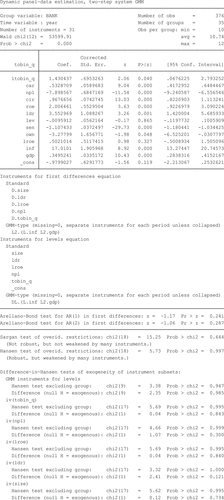
The model could have the endogeneity that must be solved for three reasons. Firstly, a two-way relationship exists between banks’ performance (tobin_q) and earnings (roe); NPLs (one component of CAMELS). Secondly, the same measurement of bank performance in the model (tobin_q and roe) will lead to endogeneity. Moreover, a correlation exists between the independent variables with the model’s residual as shown in Appendix C from the regression model.
The null hypothesis is that “resid” is zero; therefore, “npl” is exogenous. Considering that p-value = 0.000 less than 0.05, the null hypothesis is that “resid” is zero and thus “npl” is endogenous. Doing a similar test for the remaining variables, the author concludes that “roe, ldr, size” are endogenous (Appendix C). To overcome this issue, the author uses the Arellano-Bond two-step difference SGMM estimation with robust standard errors (Arellano & Bond, Citation1991). The Arellano Bond estimation combines the available lags of the dependent variables (ltobin_q) and the lagged (roe); ldr; size of the exogenous variables as instruments. The number of instruments is always kept below the number of groups in all our SGMM specifications. AR(1) and AR(2) are the Arellano-Bond tests for first- and second-order autocorrelations of the residuals. One should reject the null hypothesis of no first-order serial correlation and not reject the null hypothesis of no second-order serial correlation of the residuals. Test for AR(2) errors shows that endogeneity problem is solved at the AR(2) level. According to the Sargan test statistics, the null hypothesis is that the over-identifying restrictions are valid. The models’ test results do not reject the null hypothesis of valid instruments (because prob χ2 are greater than 0.05). The Wald (joint) test chi-square statistics (Bekana, Citation2020) show that the overall model of SGMM is fit.
The SGMM model (Arellano & Bond, Citation1991; Liu et al., Citation2018) is used significantly at 5 percent. In this model, The Sargan test and Arellano–Bond test are applied to test its results’ reliability. The endogeneity exists in the model discussed above. Accordingly, the author uses the SGMM method adopted and developed by Blundell and Bond (Citation1998). The advantage of the quantitative research method (SGMM) is to determine the strong instruments that have better Sargan p-value and Hansen p-value significantly to solve the endogeneity and test the validity of the model specifications. Therefore, an efficient two-step SGMM estimator is suitable for obtaining reliable and unbiased results in small samples.
According to Roodman (Citation2009), one rule of thumb in GMM is that the “number of instruments should not be larger than the number of groups” (Roodman, Citation2009). AR(1) and AR(2) denote the Arellano-Bond tests for the first- and second-order autocorrelations of the residuals. One should reject the null hypothesis of no first-order serial correlation and support the null hypothesis of no second-order serial correlation of the residuals.
4. Model analysis and discussion
4.1. Model analysis
The mean value of tobin_q is 4.34, with the standard deviation of 5.16. Its maximum and minimum values are 26.28 and 0.10, respectively ().
Regards to “car” variable, its maximum and minimum value are 0.23 and 0.05, respectively.
Non-performing loan and cost to income ratio have their maximum values are 0.82, 1.83. While their minimum values are in order of 0.01, −1.12.
For “roe” variable, the highest value and lowest value are 7.36 and −0.56, while “ldr” has taken the highest value and lowest value are 1.81 and 0.37.
The sensitive and leverage variables have maximum and minimum values are respectively 1.31, 23.95 and 0.01, 2.01.
The maximum and minimum values of size variable are 34.96, 28.83.
Because ownership is a dummy variable, it takes only two values 0 and 1. They are also the minimum and maximum values of this variable.
The maximum value of gdp is 0.09, with the standard deviation of 0.02. Its minimum value is 0.01. While the maximum value of inflation is 0.19, with the standard deviation of 2.01. Its minimum value is 0.04.
Next section presents the test of multi-collinear phenomenon, autocorrelation and heteroskedasticity after running the OLS between tobin_q (dependence variable) and all independent variables. The regression results are shown in the Appendix B.
Hair et al. (Citation1995) demonstrated that a VIF coefficient of less than 10 is acceptable. As a rule, if any VIF value exceeds 10, it means that the estimated regression coefficients are underestimated due to the multicollinearity phenomenon (Montgomery et al., Citation2001). According to , all VIF coefficients of variables are smaller than 10. Thus, the multi-collinear phenomenon does not exist.
Table 1. Variables in model
Table 2. Descriptive statistics
Table 3. Test of the multi-collinear phenomenon
Besides, according to the results of the correlation coefficient matrix (), after removing the variables that have correlation coefficients greater than 0.8 and the remaining correlation coefficients are all less than 0.8, the model has no defects of multicollinearity phenomenon.
Table 4. Correlation matrix
The tests for autocorrelation and heteroscedasticity will be used to claim the residuals are independent of each other and no systematic change in the spread of the residuals over the range of measured values ().
Table 5. Test of autocorrelation and heteroskedasticity
Regarding the Wooldridge test for autocorrelation in panel data, p-value is smaller than 5%; thus, we have enough evidence to reject H0: “There is no autocorrelation”. It means the model contains the autocorrelation issue. Furthermore, p-value of variance change test (Breusch-Pagan/ Cook-Weisberg test) has a value greater than 5%; thus, H0: “Residuals with variance unchanged” has insufficient evidence to be rejected. Therefore, the heteroskedasticity phenomenon does not exist. (Appendix B).
As mentioned above, the SGMM model will be used in the estimation with instrument variables. According to Arellano and Bond (Citation1991), the autocorrelation phenomena between the lag of dependent variable and error can be fixed by adding instrument variables into the dynamic panel data.
The author uses the Arellano and Bond tests to check the condition of no correlation in the error term. The AR(2) error test is rejected in the Arellano-Bond model because p-value = 0.287 larger than 0.05 with the Null hypothesis is H0: “Autocorrelation does not exist”. This result means that the probability of AR(2) is insignificant at 5%. Thus, the absence of serial autocorrelation in the errors can be confirmed in the model.
The following section discusses the Sargan and Hansen tests (), which aim to detect an overidentifying restriction problem related to the heterogeneity of the subsets of the instrumental variables and support the validity and reliability of the SGMM 2-step results. In this model, the p-value in the Sargan test (under the “H0: overidentifying restrictions are valid” hypothesis) is large (p-value = 0.644). Therefore, no sufficient evidence exists to reject hypothesis H0.
Table 6. SGMM results
also shows the difference-in-Hansen tests of the exogeneity of instrument subsets under the null hypothesis of the joint validity of a specific instrument subset. The test statistics are asymptotically chi-square distribution with degrees of freedom equal to the number of questionable instrumental variables (Nguyen et al., Citation2015). Roodman (Citation2009) discussed about the good practices in implementing the SGMM estimation and applying the difference-in-Hansen test to the subsets of SGMM-type instruments and standard instrumental variables for the level equation. also presents difference in Hansen tests of the exogeneity of instrument subsets under the null hypothesis (H0) of the joint validity of a given instrument subset. As a result of statistical evidence at 5%, the null hypothesis cannot be rejected. This finding leads to the suggestion that the subsets of instruments are econometrically exogenous. In this paper, the number of instruments is 31, which is less than the number of observations at 35. Therefore, the rule of thumb in Roodman (Citation2009), Al Marzouqi et al. (Citation2015) is satisfied. Hence, the instrument variables are adequate to deal with the endogeneity.
4.2. Discussions
The regression results show ten statistically significant variables at 5%, including all CAMELS model components. These variables are the lagged of banks performance (, capital adequacy, asset quality, management, earnings, liquidity, sensitivity, ownership, gross domestic product, and inflation. The variables that positively affect banks’ performance are capital adequacy ratio, management, earnings, liquidity and macro-variables. Conversely, asset quality, sensitivity have the reverse relationship to banks’ performance.
First, the capital adequacy ratio has a coefficient larger than 0 (0.533), so it positively affects the bank’s performance. This result is consistent with posited previous findings, namely Kaur (Citation2010), Sangmi and Nazir (Citation2010), Soni (Citation2012), and Rozzani and Rahman (Citation2013), and Rahman et al. (Citation2015). The capital adequacy ratio is the ratio that protects banks against solvency losses. Keeping at a required level of this ratio protects bank activities that provide enough bank capital for expanded business and absorbs any financial downturn without defaulting. In addition, the ratio can be used to determine the bank’s ability to deal with NPLs and other risks, such as credit risk, market risk, operational risk, and others (Fatima, Citation2014).
Management is also a CAMELS component that has a statistically significant positive effect on the bank’s performance. However, this result contrasts with the findings of Olweny and Shipho (Citation2011), Roman and Sargu (Citation2013), and Liu and Pariyaprasert (Citation2014). According to Neceur (Citation2003), there is a positive and significant relationship between overhead costs and profitability. In detail, the cost is transferred to depositors and lenders by way of lower deposit rates or higher lending rates. In a competitive market, banks have market power that makes costs pass on to customers; hence, there would be a positive correlation between overhead costs and profitability (Flamini et al., Citation2009).
Again, the study found a significant positive relationship between earnings and bank’s performance. According to Jha and Hui (Citation2012), Rozzani and Rahman (Citation2013), and Liu and Pariyaprasert (Citation2014), banks must generate sufficient earnings to stay in the market for a longer time, satisfy shareholders, and protect and improve their capital. Furthermore, earning allows a bank to increase its funds, expand its capital, and maintain its competitive position, proved by Atikogullari (Citation2009), Christopoulos et al. (Citation2011), and Peltonen et al. (Citation2015). Earnings are also one of the most critical determinants of performance when obtaining a source of assets and capital for the banking business’s benefit.
Regards to liquidity, the loan to deposit ratio has a significant positive relationship with bank’s performance. It means the bank with the higher loan to deposit ratio (which indicates lower liquidity), may have a higher performance. This finding differs from another previous studies which found a negative between liquidity and bank’s performance (Elyor, Citation2009; Golin, Citation2001; Jha & Hui, Citation2012; Liu & Pariyaprasert, Citation2014).
Inflation is a macro-economic variable has positive effect to bank’s performance. This conclusion is consistent with the following demonstrated studies, namely Guru et al. (Citation2002), Jiang et al. (Citation2003), Fadzlan (Citation2009), Miguel Á. et al. (Citation2018), and Gilbert and Jaya (Citation2019), and Almansour et al. (Citation2021).
Gross domestic product: Along with the inflation factor, GDP is a macro factor affecting organizations taking part in the financial market. Additionally, a growing economy enables businesses to operate more efficiently. GDP, in particular, has a significant positive effect on bank’s performance (Emase, Citation2017; Matar et al., Citation2018; Sufian & Habibullah, Citation2010; Tahsin & Gülşah, Citation2018).
In contrast, asset quality affects a bank’s performance negatively. Their correlation is statistically significant at 5%. In this research, the quality of assets is calculated based on non-performing loans. The low-quality assets imply a higher possibility for granted loans to become NPLs. Generally, most studies show that NPLs must be controlled and maintained at an acceptably low level to improve a bank’s performance. The findings are mentioned in the research of Olweny and Shipho (Citation2011), Dang (Citation2011), Rozzani and Rahman (Citation2013), Balango and Rao (Citation2017), and Kingu et al. (Citation2018), and Patwary and Tasneem (Citation2019).
Sensitivity is a sixth dimension that was added in 1997, which has negatively affected the bank’s performance. In previous studies, the sensitivity ratio was related to risk and the covering power of banks, which are defined and calculated to finalize their performance (Rostami, Citation2015a). Boungou (Citation2019) used sensitivity analysis to examine the impact of the interbank market rate on bank profitability and risk-taking. Hays et al. (Citation2009) also used sensitivity to assess market risk associated with changing interest rates and other factors, particularly during the financial crisis (Kandrac, Citation2014). Although CAMEL has evolved into CAMELS, it might not be applicable for all commercial banks to use sensitivity to measure a bank’s performance. The reason for this is that this ratio explains how changes in interest rates, foreign exchange rates, and commodity prices affect the profitability of institutions with international operations and trading activities (Grier, Citation2007). In this paper, the finding is consistent with the research of Bhattarai (Citation2019). It means the sensitivity coefficient is negatively correlated with the financial performance of commercial banks. While the following studies only demonstrated that sensitivity has a statistically significant impact on the bank’s performance (Avkiran & Cai, Citation2012; Kumari, Citation2017; Roman & Sargu, Citation2013; Sarker, Citation2006).
Especially, the research results show the statistically significant relationship between ownership type and bank performance. In this sense, a consistency exists in the impact direction between the two above factors in the research results of the paper and the previous experimental studies (concretely those of Su & He, Citation2012; Tsegba & Herbert, Citation2013; Robin et al., Citation2018; Haider et al., Citation2018; Shawtari, Citation2018). From the practice, some studies have demonstrated a reverse relationship between state-ownership and bank’s performance, concretely, in emerging markets (e.g., Barth et al., Citation2004; Cornett et al., Citation2010; Hasan & Marton, Citation2003; Jemric & Vujcic, Citation2002; La Porta et al., Citation2002; Lin & Zhang, Citation2009; Micco et al., Citation2007; Weill, Citation2003). State-owned banks have lower returns and higher costs in developing countries than private banks. The main reason is that state-owned banks cannot effectively control agency costs due to asymmetric information, hurting their performance. La Porta et al. (Citation2002), Jemric and Vujcic (Citation2002), Hasan and Marton (Citation2003), Weill (Citation2003), Barth et al. (Citation2004), Micco et al. (Citation2007), Lin and Zhang (Citation2009), and Cornett et al. (Citation2010) discovered a negative relationship between bank ownership and performance. It can be seen from the Vietnamese banking sector, the government and the state bank’s supervision and management are a considerable issue. Market fluctuations in finance, money, and securities, for example, have not been adequately reflected in policies and operational orientations … As a result, the state bank should speed up the commercial banking system’s restructuring by buying, selling, merging, and reducing government ownership of state-owned banks. Because these banks still have a mentality of relying on government protection, lack dynamism in business activities, and lack human resource preparation, they are limited in expanding their network and market share. Their service structure is still heavily reliant on traditional financial services. Furthermore, there are some visible flaws in managing resources, operating costs, and investment activities that make state-owned banks less effective. According to an SBV report in 2021, some Vietnamese state-owned commercial banks, such as Ocean Commercial One Member Limited Liability Bank and Construction Commercial One Member Limited Liability Bank, perform less efficiently than Asia Commercial Joint-Stock Bank, Lien Viet Post Joint-Stock Commercial Bank, and Joint-Stock Commercial Bank for Industry and Trade in a realistic environment.
5. Conclusions and recommendations
Using the quantitative method, the study has determined factors that affect Vietnamese commercial banks’ performance from 2009 to 2020. The statistically significant factors influencing banks’ performance are one year lagged of banks’ performance, capital adequacy ratio, asset quality, management, earnings, liquidity, sensitivity, ownership, gross domestic product, and inflation rate.
Moreover, the CAMELS framework is a rating system to proxy the internal (bank-specific) factors that affect banks’ performance in Vietnam. Compared to some previous studies, this paper uses the SGMM method with Sargan and Hansen tests to approve the valid instrument variables and unbiased estimated results.
Typically, valuable research results combine ownership variables with all CAMELS components in the model to estimate their effects on banks’ performance in Vietnam, including state-owned commercial banks and joint-stock commercial banks. Although the paper highlights the significant relationship between ownership type and banks’ performance, the different effects of each type of ownership on a bank’s performance have not been clarified.
Therefore, further research is recommended and merited to construct a model to estimate the different impacts of ownership types on a bank’s performance, investigated in previous studies. Last, further studies may focus on different banking industries globally, not only on the Vietnamese banking industry. The indicator of bank performance can also change from Tobin’s Q to other indicators such as net interest margin, economic value added to represent the bank’s performance from a different angle.
Disclosure statement
No potential conflict of interest was reported by the author(s).
Additional information
Funding
Notes on contributors

Nguyen Kim Quoc Trung
Ph.D. Nguyen Kim Quoc Trung is currently a lecturer of the Faculty of Accounting - Auditing; the University of Finance – Marketing, Vietnam. He is interested in researching the banking sector and finance and accounting. His fields of research and teaching are banking, finance, and governance. He has written a total of some articles in various international journals and conferences, including Productivity management, Cogent Business & Management, and has served as a reviewer of some international journals listed in Scopus, such as Cogent Economics and Finance.
References
- Al Marzouqi, R. N., Sami, B., & Kotak, A. (2015). What matters for financial development and stability? International Monetary Fund.
- Almansour, A. Y., Alzoubi, H. M., Almansour, B. Y., & Almansour, Y. M. (2021). The effect of inflation on performance: an empirical investigation on the banking sector in Jordan. Journal of Asian Finance, Economics and Business, 8(6), 0097–35. https://doi.org/https://doi.org/10.13106/jafeb.2021.vol8.no6.0097
- Arellano, M., & Bond, S. (1991). Some tests of specification for panel data: Monte Carlo evidence and an application to employment equations. The Review of Economic Studies, 58(2), 277–297. https://doi.org/https://doi.org/10.2307/2297968
- Arora, S., & Kaur, S. (2006). Financial performance of indian banking sector in post reforms era. The Indian Journal of Commerce, 59(1), 1–24.
- Atikogullari, M. (2009). An analysis of the Northern Cyprus banking sector in the post - 2001 period through the CAMELS approach. International Research Journal of Finance and Economics, 32, 212–229.
- Avkiran, N. K., & Cai, L. (2012). Predicting bank financial distress prior to crises. The University of Queensland, Australia.
- Babar, H. Z., & Zeb, G. (2011). CAMELS rating system for banking industry in Pakistan: Does CAMELS system provide similar rating as PACRA system in assessing the performance of banks in Pakistan? Umea School of Business, Umea Universitet.
- Balango, T. K., & Rao, K. (2017). The effect of NPL on profitability of banks with reference to commercial bank of Ethiopia. Business and Management Research Journal, 7(5), 45–50.
- Barker, D., & Holdsworth, D. G. (1993). The Causes of Bank Failures in the 1980s. Federal Reserve Bank of New York.
- Barth, J. R., Caprio, G., Jr., & Levine, R. (2001). Banking Systems Around the Globe: Do Regulation and Ownership Affect Performance and Stability? Prudential Supervision: What Works and What Doesn’t. University of Chicago Press.
- Barth, J., Caprio, G., & Levine, R. (2004). Bank supervision and regulation: What works best? Journal of Financial Intermediation, 13, 205–248. https://doi.org/https://doi.org/10.1016/j.jfi.2003.06.002
- Basel. (2010). Principles for enhancing corporate governance. Retrieved from Bank for International Settlements.
- Bashir, A., & Hassan, M. (2004). Determinants of Islamic banking profitability. ERF paper, 10th Conference.
- Bayyurt, N. (2013). Ownership effect on bank’s performance: Multi criteria decision making approaches on foreign and domestic Turkish banks. Procedia - Social and Behavioral Sciences, 99(2013), 919–928. https://doi.org/https://doi.org/10.1016/j.sbspro.2013.10.565
- Bekana, D. M. (2020). Innovation and economic growth in sub-Saharan Africa: Why institutions matter? An empirical study aross 37 countries. Journal of Economic Theory and Practice, 1–40. https://doi.org/https://doi.org/10.1177/0976747920915114
- Berger, A. N., & DeYoung, R. (1997). Problem loans and cost efficiency in commercial banks. Journal of Banking and Finance, 21(6), 849–870. https://doi.org/https://doi.org/10.1016/S0378-4266(97)00003-4
- Berger, A. N., Herring, R. J., & Szego, G. P. (1995). The role of capital in financial institutions. Journal of Banking and Finance, 19(3–4), 393–430. https://doi.org/https://doi.org/10.1016/0378-4266(95)00002-X
- Berger, A. N., & Mester, L. J. (1997). Inside the black box: What explains differences in the efficiencies of financial institutions? Journal of Banking and Finance, 21(7), 895–947. https://doi.org/http://dx.doi.org/10.1016/S0378-4266(97)00010-1
- Berle, A., & Means, G. (1932). The Modern Corporation and Private Property. Commerce Clearing House.
- Bhattarai, B. P. (2019). Effect of credit risk management on financial performance of commercial banks in Nepal. European Journal of Accounting, Auditing and Finance Research, 7 (5), 87–103. https://www.eajournals.org/wp-content/uploads/Effect-of-Credit-Risk-Management-on-Financial-Performance-of-Commercial-Banks-in-Nepal.pdf
- Bikker, J. A., & Hu, H. (2002). Cyclical patterns in profits, provisioning and lending of banks and procyclicality of the new basel capitak requirements. BNL Quarterly Review, 55(221), 143–175. https://ideas.repec.org/a/psl/bnlqrr/200222.html
- Blundell, R., & Bond, S. (1998). Initial conditions and moment restrictions in dynamic panel data models. Journal of Econometrics, 87, 115–143.
- Bonin, J., Mizsei, K., Szekely, I., & Wachtel, P. (1998). Banking in Transition Economies: Developing Market Oriented Banking Sectors in Eastern Europe. Edward Elgar.
- Booth, L., Aivazian, V., Demirguc-Kunt, A., & Maksimovic, V. (2001). Capital structures in developing countries. The Journal of Finance, 56(1), 87–130. https://doi.org/http://dx.doi.org/10.1111/0022-1082.00320
- Boungou, W. (2019). Negative interest rates, bank profitability and risk-taking. In Sciences PO OFCE working paper (Vol. 10, pp. 1–41). SSRN. www.ofce.sciences-po.fr/pdf/dtravail/WP2019-10.pdf
- Boyd, J., & Smith, B. (1998). Capital market imperfections in a monetary growth model. Economic Theory, 11(2), 241–273. https://doi.org/https://doi.org/10.1007/s001990050187
- Boyd, J. H., & Champ, B. (2006). Inflation, Banking, and Economic Growth. Federal Reserve Bank of Cleveland.
- Brainard, W. C., & Tobin, J. (1968). Pitfalls in financial model-building. Cowles Foundation Discussion Papers, 477, 1–30. https://elischolar.library.yale.edu/cowles-discussion-paper-series/477/
- Brigham, E. F., & Houston, J. F. (2006). Fundamentals of Financial Management (11 ed.). Thomson.
- Campbell, K., & Mínguez-Vera, A. (2008). Gender diversity in the boardroom and firm financial performance. Journal of Business Ethics, 83(3), 435–451. https://doi.org/https://doi.org/10.1007/s10551-007-9630-y
- Cetin, H. (2019). Inflation and bank profitability: G20 countries banks panel data analysis. In Phuket, Thailand: 2019 international conference on management science and industrial engineering (pp. 168–172). Association for Computing Machinery.
- Chaibi, H., & Ftiti, Z. (2015). Credit risk determinants: Evidence from a cross-country study. Research in International Business and Finance, 33(C), 1–16. https://doi.org/https://doi.org/10.1016/j.ribaf.2014.06.001
- Chandani, A., Mehta, M., & Chandrasekaran, K. B. (2014). A working paper on the impact of gender of leader on the financial performance of the bank: A case of ICICI bank. Procedia Economics and Finance, 11(2014), 459–471. https://doi.org/https://doi.org/10.1016/S2212-5671(14)00212-3
- Chen, C. R., Guo, W., & Mande, V. (2006). Corporate value, managerial stockholdings and investments of Japanese firms. Journal of International Financial Management & Accounting, 17(1), 29–51. https://doi.org/https://doi.org/10.1111/j.1467-646X.2006.00120.x
- Christopoulos, A. G., Mylonakis, J., & Diktapanidis, P. (2011). Could Lehman brothers collapse be anticipated? an examination using CAMELS rating system. International Business Research, 4(2), 11–19. https://doi.org/https://doi.org/10.5539/ibr.v4n2p11
- Claessens, S., & Horen, N. V. (2014). The Impact of the Global Financial Crisis on Banking Globalization. International Monetary Fund.
- Copeland, T. E., Weston, J. F., & Shastri, K. (2005). Financial Theory and Corporate Policy (4 ed.). Pearson Education, Inc.
- Cornett, M. M., Guo, L., Khaksari, S., & Tehranian, H. (2010). The impact of state ownership on performance differences in privately-owned versus state-owned banks: An international comparison. Journal of Financial Intermediation, 19, 74–94.
- Cornett, M. M., McNutt, J. J., & Tehranian, H. (2009). Corporate governance and earnings management at large US bank holding companies. Journal of Corporate Finance, 15(4), 412–430. https://doi.org/https://doi.org/10.1016/j.jcorpfin.2009.04.003
- Crystal, J. S., Dages, G., & Goldberg, L. S. (2002). Has foreign bank entry led to sounder banks in Latin America? Federal Reserve Bank of New York Current Issues in Economics and Finance, 8(1), 2–5. https://www.newyorkfed.org/medialibrary/media/research/current_issues/ci8-1.html
- Dang, U. (2011). The CAMEL rating system in banking supervision: A case study of Arcada. University of Applied Sciences, International Business.
- Demirgüç-Kunt, A., & Huizinga, H. (1999). Determinants of commercial bank interest margins and profitability: Some international evidence. The World Bank Economic Review, 13(2), 379–408. https://doi.org/https://doi.org/10.1093/wber/13.2.379
- Derviz, A., & Podpiera, J. (2008). Predicting bank CAMELS and S&P ratings: The case of the Czech Republic. Emerging Markets Finance and Trade, 44(1), 17–130. https://doi.org/https://doi.org/10.2753/REE1540-496X440107
- Doumpos, M., & Zopounidis, C. (2010). A multicriteria decision support system for bank rating. Decision Support Systems, 50(1), 55–63. https://doi.org/https://doi.org/10.1016/j.dss.2010.07.002
- Drake, P. P., & Fabozzi, F. J. (2010). Financial Ratio Analysis. In P. P. Drake (Ed.), The Basics of Finance: An Introduction to Financial Markets, Business Finance, and Portfolio Management (pp. 258–260). John Wiley & Sons, Inc.
- Elyor, S. (2009). Factors affecting the performance of foreign banks in Malaysia. Universiti Utara Malaysia.
- Emase, M. A. (2017). Effect of macroeconomic factors on the profitability of commercial banks listed at the Nairobi securities exchange in Kenya. The School of Business And Public Management, KCA University. http://41.89.49.13:8080/xmlui/handle/123456789/1325
- Fadzlan, S. (2009). Determinants of bank profitability in a developing economy: Empirical evidence from the China banking sector. Journal of Asia-Pacific Business, 10(4), 201–307. https://doi.org/https://doi.org/10.1080/10599230903340205
- Fatima, N. (2014). Capital adequacy: A financial soundness indicator for banks. Global Journal of Finance and Management, 6(8), 771–776. https://www.ripublication.com/gjfm-spl/gjfmv6n8_12.pdf
- Ferrouhi, E. M. (2018). Determinants of banks’ profitability and performance: An overview. MPRA Paper, 89470, 1, 1–15. https://mpra.ub.uni-muenchen.de/89470/
- Flamini, V., McDonald, C., & Schumacher, L. (2009). Determinants of profitability in Sub-Shaharan Africa (pp. 1–30). IMF: IMF Working Paper NO 09/15. International Monetary Fund. https://doi.org/https://doi.org/10.5089/9781451871623.001
- Gilbert, B., & Jaya, S. (2019). Inflation and Profitability of Commercial Banks in Rwanda: A Case Study of Bank of Kigali. International Journal of Business and Management, 14(10), 35–43. https://doi.org/https://doi.org/10.5539/ijbm.v14n10p35
- Goddard, J., Molyneux, P., & Wilson, J. O. S. (2004). The profitability of European banks: A cross-sectional and dynamic panel analysis. Manchester School, 721, 363–381. https://doi.org/https://doi.org/10.1111/j.1467-9957.2004.00397.x
- Golin, J. (2001). The bank credit analysis handbook: A guide for analysts, bankers and investors. John Wiley & Sons Pre Ltd.
- Grier, W. A. (2007). Credit analysis of financial institutions (2 ed.). Euromoney.
- Guru, B., Staunton, J., & Balashanmugam, B. (2002). Determinant of commercial bank profitability in Malaysia. Sydney: 12th Annual Australian Finance and Banking Conference.
- Haider, Z. A., Liu, M., Wang, Y., & Zhang, Y. (2018). Government ownership, financial constraint, corruption, and corporate performance: International evidence. Journal of International Financial Markets, Institutions and Money, 53(C), 76–93. https://doi.org/https://doi.org/10.1016/j.intfin.2017.09.012
- Hair, J. F., Jr., Anderson, R. E., Tatham, R. L., & Black, W. C. (1995). Multivariate Data Analysis (3 ed.). Macmillan.
- Hasan, I., & Marton, K. (2003). Development and efficiency of the banking sector in a transitional economy: Hungarian experience. Journal of Banking & Finance, 27(12), 2249–2271. https://doi.org/https://doi.org/10.1016/S0378-4266(02)00328-X
- Hays, F. H., De Lurgio, S. A., & Gilbert, A. H. (2009). Efficiency ratios and community bank performance. Journal of Finance and Accountancy, 1(1), 1–15. http://www.aabri.com/manuscripts/09227.pdf
- Hirtle, B. J., & Lopez, J. A. (1999). Supervisory information and the frequency of bank examinations. FRBNY Economic Policy Review, 5(1), 1–19. https://ssrn.com/abstract=1004357
- Iavorskyi, M. (2013). The impact of capital structure on firm performance: Evidence from Ukraine. Thesis. Kyiv School of Economics.
- IMF. (2009). Lessons of the global crisis for macroeconomic policy. IMF Staff Paper No. 09/37. Washington, DC: International Monetary Fund.
- Jemric, I., & Vujcic, B. (2002). Efficiency of banks in Croatia: A DEA approach. Comparative Economic Studies, 44(2–3), 169–193. https://doi.org/https://doi.org/10.1057/ces.2002.13
- Jensen, M. C., & Meckling, W. H. (1976). Theory of the firm: Managerial behavior, agency costs and ownership structure. Journal of Financial Economics, 3(4), 305–360. https://doi.org/https://doi.org/10.1016/0304-405X(76)90026-X
- Jha, S., & Hui, X. (2012). A comparison of financial performance of commercial banks: A case study of Nepal. African Journal of Business Management, 6(25), 7601–7611. https://doi.org/https://doi.org/10.5897/AJBM11.3073
- Jiang, G., Tang, N., Law, E., & Sze, A. (2003). Determinants of Bank Profitability in Hong Kong.
- Kandrac, J. (2014). Modelling the causes and manifestation of bank stress: An example from the financial crisis. Applied Economics, 46(35), 4290–4301. https://doi.org/https://doi.org/10.1080/00036846.2014.955257
- Kasman, A., & Yildirim, C. (2006). Cost and profit efficiencies in transition banking: The case of new EU members. Applied Economics, 38(9), 1079–1090. https://doi.org/https://doi.org/10.1080/00036840600639022
- Kaur, H. V. (2010). Analysis of banks in India - A CAMEL approach. Global Business Review, 11(2), 257–280. https://doi.org/https://doi.org/10.1177/097215091001100209
- Keynes, J. M. (1936). The general theory of employment interest and money. Palgrave Macmillan.
- Kingu, P. S., Macha, D. S., & Gwahula, D. R. (2018). Impact of non-performing loans on bank’s profitability: Empirical evidence from commercial banks in Tanzania. International Journal of Scientific Research and Management, 6(1), 71–79. https://doi.org/https://doi.org/10.18535/ijsrm/v6i1.em11
- Kosmidou, K. (2008). The determinants of banks’ profits in Greece during the period of EU financial integration. Managerial Finance, 34(3), 146–159. https://doi.org/https://doi.org/10.1108/03074350810848036
- Koutsomanoli–Filippaki, A., Margaritis, D., & Staikouras, C. (2009). Efficiency and productivity growth in the banking industry of Central and Eastern Europe. Journal of Banking & Finance, 33(3), 557–567. https://doi.org/https://doi.org/10.1016/j.jbankfin.2008.09.009.
- Kumar, S., & Gulati, R. (2008). Evaluation of technical efficiency and ranking of public sector banks in India: An analysis from cross-sectional perspective. International Journal of Productivity and Performance Management, 57(7), 540–568. https://doi.org/https://doi.org/10.1108/17410400810904029
- Kumari, I. G. (2017). A study of the financial performance on foreign commercial banks in Sri Lanka: An application of CAMEL Rating System. Economics, Commerce and Trade Management: An International Journal, 1 (1), 59–70. https://airccse.com/ectij/papers/1117ectij05.pdf
- La Porta, R., Lopez‐de‐Silanes, F., & Shleifer, A. (2002). Government ownership of banks. The Journal of Finance, 57(1), 265–301. https://doi.org/https://doi.org/10.1111/1540-6261.00422
- Lang, L., Stulz, R., & Walkling, R. A. (1989). Managerial performance, Tobin’s q and the gains from successful tender offers. Journal of Financial Economics, 24(1), 137–154. https://doi.org/https://doi.org/10.1016/0304-405X(89)90075-5
- Lelissa, T. B., & Kuhil, A. M. (2018). Empirical evidence on the impact of bank-specific factors on the commercial banks performance: The CAMEL model and case of Ethiopian banks. Global Journal of Management and Business Research (C): Finance, 18(4), 37–48. https://doi.org/https://doi.org/10.26643/gis.v13i3.3287
- Lin, X., & Zhang, Y. (2009). Bank ownership reform and bank performance in China. Journal of Banking & Finance, 33, 20–29. https://doi.org/https://doi.org/10.1016/j.jbankfin.2006.11.022
- Liu, L., Liu, Q., Tian, G., & Wang, P. (2018). Government connections and the persistence of profitability: Evidence from Chinese listed firms. Emerging Markets Review, 36, 110–129.
- Liu, J., & Pariyaprasert, W. (2014). Determinants of bank performance: The application of the CAMEL model to banks listed in China’s stock exchanges from 2008 to 2011. AU-GSB e-JOURNAL, 7(2), 80–95. http://www.assumptionjournal.au.edu/index.php/AU-GSB/article/view/1067
- Magweva, R., & Marime. (2016). Bank specific factors and bank performance in the multi-currency era in Zimbabwe. African Journal of Business Management 10(15), 373–383. https://doi.org/https://doi.org/10.5897/AJBM2016.8076
- Masood, O., Ghauri, S. M. K., & Aktan, B. (2016). Predicting Islamic banks performance through CAMELS rating model. Banks and Bank Systems, 11(3), 37–43. https://doi.org/https://doi.org/10.21511/bbs.11(3).2016.04
- Matar, A., Al-Rdaydeh, M., & Odeh, M. (2018). Factors affecting the corporate performance: Panel data analysis for listed firms in Jordan. Academy of Accounting and Financial Studies Journal, 22(6), 1–10. https://www.abacademies.org/articles/Factors-Affecting-the-Corporate-Performance-Panel-Data-Analysis-for-Listed-Firms-in-Jordan-1528-2635-22-6-315.pdf
- Mbabazize, R. N., Turyareeba, D., Ainomugisha, P., & Rumanzi, P. (2020). Monetary policy and profitability of commercial banks in Uganda. Open Journal of Applied Sciences, 10(10), 625–653. https://doi.org/https://doi.org/10.4236/ojapps.2020.1010044
- McConnell, J. J., & Servaes, H. (1990). Additional evidence on equity ownership and corporate value. Journal of Financial Economics, 27(2), 595–612. https://doi.org/https://doi.org/10.1016/0304-405X(90)90069-C
- Mester, L. (1996). A study of bank efficiency taking into account risk-preferences. Journal of Banking and Finance, 20(6), 1025–1045. https://doi.org/https://doi.org/10.1016/0378-4266(95)00047-X
- Micco, A., & Panizza, U. (2006). Bank ownership and lending behaviour. Economics Letters, 93(2), 248–254. https://doi.org/https://doi.org/10.1016/j.econlet.2006.05.009
- Micco, A., Panizza, U., & Yañez, M. (2007). Bank ownership and performance. Does politics matter? Journal of Banking & Finance, 31(1), 219–241. https://doi.org/https://doi.org/10.1016/j.jbankfin.2006.02.007
- Miguel Á., T.-Z., Martínez, F. V., & Preciado, V. H. T. (2018). Effects of inflation on financial sector performance: New evidence from panel quantile regressions. Investigación Económica, LXXVII, (303), 94–129. https://doi.org/https://doi.org/10.22201/fe.01851667p.2018.303.64156
- Mileris, R. (2012). Macroeconomic determinants of loan portfolio credit risk in banks. Inzinerine Ekonomika-Engineering Economics, 23(5), 496–504. https://doi.org/https://doi.org/10.5755/j01.ee.23.5.1890
- Milne, A., & Wiley, A. E. (2001). Bank capital regulation and incentives for risk-taking. Cass Business School Research Paper, 17, 1–52. https://doi.org/http://dx.doi.org/10.2139/ssrn.299319
- Mishra, A. K., Harsha, G. S., Anand, S., & Dhruva, N. R. (2012). Analyzing soundness in Indian banking: A CAMEL approach. Research Journal of Management Sciences, 1 (3), 9–14. http://www.isca.in/IJMS/Archive/v1/i3/2.ISCA-RJMS-2012-028.pdf
- Mohan, N., & Ruggiero, J. (2007). Influence of firm performance and gender on CEO compensation. Applied Economics, 39(9), 1107–1113. https://doi.org/https://doi.org/10.1080/00036840500474264
- Montgomery, D. C., Peck, E. A., & và Vining, G. G. (2001). Introduction to Linear Regression Analysis (3 ed.). Jon Wiley and Sons.
- Morck, R., Andrei, S., & Robert, W. V. (1990). Do managerial objectives drive bad acquisitions? The Journal of Finance, 45(1), 31–48. https://doi.org/https://doi.org/10.1111/j.1540-6261.1990.tb05079.x.
- Myers, S. C., & Majluf, N. (1984). Corporate financing and investment decisions when firms have information that investors do not have. Journal of Financial Economics, 13(2), 187–221. https://doi.org/https://doi.org/10.1016/0304-405X(84)90023-0
- Narwal, K. P., & Pathneja, S. (2016). Effect of bank-specific and governance-specific variables on the productivity and profitability of banks. International Journal of Productivity and Performance Management, 65(8), 1057–1074. https://doi.org/https://doi.org/10.1108/IJPPM-09-2015-0130
- Nathan, S., Ibrahim, M., & Tom, M. (2020). Determinants of non-performing loans in Uganda’s commercial banking sector. African Journal of Economic Review, 8(1), 26–47.
- Neceur. (2003). The determinants of the Tunisian banking industry profitability: Panel evidence. Retrieved from https://www.mafhoum.com/press6/174E11.pdf
- Nguyen, A. H., Nguyen, H. T., & Pham, H. T. (2020). Impact of working capital management on firm’s profitability: Empirical evidence from Vietnam. The Journal of Asian Finance, Economics and Business, 7(3), 115–125. https://doi.org/https://doi.org/10.13106/jafeb.2020.vol7.no3.115
- Nguyen, H. D. H., & Dang, V. D. (2020). Bank-specific determinants of loan growth in Vietnam: Evidence from the CAMELS approach. The Journal of Asian Finance, Economics and Business, 7(9), 179–189. https://doi.org/https://doi.org/10.13106/jafeb.2020.vol7.no9.179
- Nguyen, H. T., Nguyen, H. T., & Pham, H. T. (2020). Applying the CAMEL model to assess performance of commercial banks: Empirical evidence from Vietnam. Banks and Bank Systems, 15(2), 177–186. https://doi.org/http://dx.doi.org/10.21511/bbs.15(2).2020.16
- Nguyen, T., Locke, S., & Reddy, K. (2014). A dynamic estimation of governance structures and financial performance for Singaporean companies. Economic Modelling, 40(C), 1–11. https://doi.org/https://doi.org/10.1016/j.econmod.2014.03.013
- Nguyen, T., Locke, S., & Reddy, K. (2015). Does boardroom gender diversity matter? Evidence from a transitional economy. International Review of Economics and Finance, 37, 184–202. https://doi.org/https://doi.org/10.1016/j.iref.2014.11.022
- Nimalathasan, B. (2008). A comparative study of financial performance of banking sector in Bangladesh–an application of CAMELS rating system. Economic and Administrative Series, 2(2008), 141–152. https://ssrn.com/abstract=2117189
- Niu, X. (2008). Theoretical and practical review of capital structure and its determinants. International Journal of Business and Management, 3(3), 133–139. https://doi.org/https://doi.org/10.5539/ijbm.v3n3p133
- Obamuyi, T. (2013). Determinants of bank profitability in Nigeria. Organizations and Markets in Emerging Economies, 4(2), 7–109. https://doi.org/https://doi.org/10.15388/omee.2013.4.2.14251
- Olweny, T., & Shipho, T. M. (2011). Effects of banking sectoral factors on the profitability of commercial banks in Kenya. Economics and Finance Review, 1(5), 1–30. http://wwww.businessjournalz.org/efr
- Onaolapo, A. A., & Kajola, S. O. (2010). Capital structure and firm performance: Evidence from Nigeria. European Journal of Economics, Finance and Administrative Sciences, 25, 70–82.
- Oztorul, G. (2011). Performance evaluation of banks and banking groups: A Turkey case. Doctoral Dissertation. Middle East Technical University.
- Pasiouras, F., & Kosmidou, K. (2007). Factors influencing the profitability of domestic and foreign commercial banks in the European Union. Research in International Business and Finance, 21(2), 222–237. https://doi.org/https://doi.org/10.1016/j.ribaf.2006.03.007
- Patwary and Tasneem. (2019). Impact of non-performing loan on profitability of banks in Bangladesh: A study from 1997 to 2017. Global Journal of Management and Business Research: C Finance, 19(1), 13–27.
- Peltonen, T., Piloiu, A., & Sarlin, P. (2015). Network linkages to predict bank distress. European Central Bank Working Paper, 1828, 1–35. https://www.ecb.europa.eu/pub/pdf/scpwps/ecbwp1828.en.pdf
- Petersson, J., & Wadman, I. (2004). Non Performing Loans - The markets of Italy and Sweden. Department of Business Studies - UPPSALA UNIVERSITY.
- Phung, D. N., & Mishra, A. V. (2016). Ownership structure and firm performance: Evidence from Vietnamese listed firms. Australian Economic Papers, 55(1), 63–98. https://doi.org/https://doi.org/10.1111/1467-8454.12056
- Rahman, M. M., Hamid, M. K., & Khan, M. A. M. (2015). Determinants of bank profitability: Empirical evidence from Bangladesh. International Journal of Business and Management, 10(8), 135–149. https://doi.org/https://doi.org/10.5539/ijbm.v10n8p135
- Raiyani, J. R. (2010). Effect of mergers on efficiency and productivity of Indian banks: A CAMELS analysis. Asian Journal of Management Research, 772–794. http://citeseerx.ist.psu.edu/viewdoc/download;jsessionid=DA88D0B70B4878EE6BC1C85BEBC2B1A3?doi=10.1.1.298.3492&rep=rep1&type=pdf
- Rajan, R., & Zingales, L. (1995). What do we know about capital structure? Some evidence from international data. The Journal of Finance, 50(5), 1421–1460. https://doi.org/https://doi.org/10.1111/j.1540-6261.1995.tb05184.x
- Reddy, K., Locke, S., Scrimgeour, F., & Gunasekarage, A. (2008). Corporate governance practices of small cap companies and their financial performance: An empirical study in New Zealand. International Journal of Business Governance and Ethics, 4(1), 51–78. https://doi.org/https://doi.org/10.1504/IJBGE.2008.017891
- Robin, I., Salim, R., & Bloch, H. (2018). Financial performance of commercial banks in the post-reform era: Further evidence from Bangladesh. Economic Analysis and Policy, 58(C), 43–54. https://doi.org/https://doi.org/10.1016/j.eap.2018.01.001
- Rodica-Oana, I. (2014). The evolution of Romania’s financial and banking system. Procedia Economics and Finance, 15(2014), 760–768. https://doi.org/https://doi.org/10.1016/S2212-5671(14)00467-5
- Roman, A., & Sargu, A. C. (2013). Analysing the financial soundness of the commercial banks in Romania: An approach based on the camels framework. Procedia Economics and Finance, 6(2013), 703–712. https://doi.org/https://doi.org/10.1016/S2212-5671(13)00192-5
- Roodman, D. (2009). How to do xtabond2: An introduction to “difference” and “system” GMM in Stata. The Stata Journal: Promoting Communications on Statistics and Stata, 9(1), 86–136. https://doi.org/https://doi.org/10.1177/1536867X0900900106
- Rose, C. (2007). Does female board representation influence firm performance? The Danish evidence. Corporate Governance: An International Review, 15(2), 404–413. https://doi.org/https://doi.org/10.1111/j.1467-8683.2007.00570.x
- Rostami, M. (2015a). CAMELS’ analysis in banking industry. Global Journal of Engineering Science and Research Management, 2(11), 10–26. http://www.gjesrm.com/November-2015.html
- Rostami, M. (2015b). The effect of ownership structure on Tobin’s Q Ratio. Journal of Research in Business, Economics and Management, 3 (2), 161–171. Retrieved from http://scitecresearch.com/journals/index.php/jrbem/article/view/247
- Rozzani, N., & Rahman, R. A. (2013). Camels and performance evaluation of banks in Malaysia: Conventional versus Islamic. Journal of Islamic Finance and Business Research, 2(1), 36–45.
- Sabi, M. (1996). Comparative analysis of foreign and domestic bank operations in Hungary. Journal of Comparative Economics, 22(2), 179–188. https://doi.org/https://doi.org/10.1006/jcec.1996.0017
- Sadeghi, S. S. J., & Kafash, P. S. M. (2009). Shareholders effect on productivity. Review of Accounting and Auditing, 16(55), 51–66.
- Salhuteru, F., & Wattimena, F. (2015). Bank performance with CAMELS Ratios towards earnings management practices in state banks and private banks. Advances in Social Sciences Research Journal, 2(4), 301–314. https://doi.org/https://doi.org/10.14738/assrj.24.940
- Salim, M., & Yadav, R. (2012). Capital structure and firm performance: Evidence from Malaysian listed companies. Procedia - Social and Behavioral Sciences, 65(2012), 156–166. https://doi.org/https://doi.org/10.1016/j.sbspro.2012.11.105
- Sangmi, M., & Nazir, T. (2010). Analyzing financial performance of commercial banks in India: Application of CAMEL model. Pakistan Journal Commercial Social Sciences, 1(2010), 1–10. https://www.econstor.eu/handle/10419/187999
- Sarker, A. (2006). CAMELS rating system in the context of Islamic banking: A proposed ‘S’ for Shariah framework. Journal of Islamic Economics, Banking and Finance, 2(2), 1–26. https://ibtra.com/pdf/journal/v2_n2_article4.pdf
- Schwartz, R. A. (1974). An economic model of trade credit. The Journal of Financial and Quantitative Analysis, 9(4), 643–657. https://doi.org/https://doi.org/10.2307/2329765
- Servaes, H. (1991). Tobin’s Q and the gains from takeovers. The Journal of Finance, 46(1), 409–419. https://doi.org/https://doi.org/10.1111/j.1540-6261.1991.tb03758.x
- Shawtari, F. A. (2018). Ownership type, bank models, and bank performance: The case of the Yemeni banking sector. International Journal of Productivity and Performance Management, 67(8), 1271–1289. https://doi.org/https://doi.org/10.1108/IJPPM-01-2018-0029
- Skinner, D. J. (1993). The investment opportunity set and accounting procedure choice: Preliminary evidence. Journal of Accounting and Economics, 16(4), 407–445. https://doi.org/https://doi.org/10.1016/0165-4101(93)90034-D
- Solomon, E. (1959). The Management of Corporate Capital. The Free Press of Glencoe, Illinois.
- Soni, R. (2012). Applicability of CAMELS rating for supervisory regulation of the Indian banking system. Vishwakarma Business Review, 2(2), 14–20.
- Su, D., & He, X. (2012). Ownership structure, corporate governance and productive efficiency in China. Journal of Productivity Analysis, 38(3), 303–318. https://doi.org/https://doi.org/10.1007/s11123-011-0257-8
- Sufian, F., & Chong, R. R. (2008). Determinants of bank profitability in a developing economy: Empirical evidence from the Philippines. Asian Academy of Management Journal of Accounting and Finance, 4(2), 91–112.
- Sufian, F., & Habibullah, M. S. (2010). Assessing the impact of financial crisis on bank performance, empirical evidence from Indonesia. ASEAN Economic Bulletin, 27(3), 245–262. https://doi.org/https://doi.org/10.1355/ae27-3a
- Suresh, P., & Paul, J. (2010). Management of banking and financial services (2 ed.). Pearson.
- Tahsin, K., & Gülşah, Ş. (2018). Analysis of macroeconomic factors which affect performance of global finance centers. Asian Economic and Financial Review, 8(1), 63–70. https://doi.org/https://doi.org/10.18488/journal.aefr.2018.81.63.70
- Tobin, J. (1969). A general equilibrium approach to monetary theory. Journal of Money, Credit and Banking, 1(1), 15–29. https://doi.org/https://doi.org/10.2307/1991374
- Tsegba, I. N., & Herbert, W. E. (2013). Corporate governance, ownership structure and firm performance in Nigeria. Research Journal of Finance and Accounting, 4(5), 23–38. Retrieved from https://www.iiste.org/Journals/index.php/RJFA/article/view/5070
- Tuyet, P. A. (2017). Analysis of factors affecting the business performance of joint stock commercial banks in Vietnam. Journal Of Asian Business And Economic Studies, 1. https://digital.lib.ueh.edu.vn/handle/UEH/56770
- Vafeas, N., & Theodorou, E. (1998). The relationship between board structure and firm performance in the UK. The British Accounting Review, 30(4), 383–407. https://doi.org/https://doi.org/10.1006/bare.1998.0075
- Venkatesh, J., & Suresh, C. (2014). Comparative performance evaluation of selected commercial banks in kingdom of Bahrain using CAMELS method. SSRN Electronic Journal, 1–32. https://doi.org/https://doi.org/10.2139/ssrn.2418144
- Waqas, M., Fatima, N., Khan, A., & và Arif, M. (2017). Determinants of Non-performing Loans: A Comparative Study of Pakistan, India, and Bangladesh. Journal of Finance & Banking Studies, 6(1), 51–68. https://doi.org/https://doi.org/10.20525/ijfbs.v6i1.617
- Weill, L. (2003). Banking efficiency in transition economies. Economics of Transition, 11(3), 569–592.
- White, L. H. (1999). The Theory of Monetary Institutions. Blackwell.
Appendix A. Unit-root test


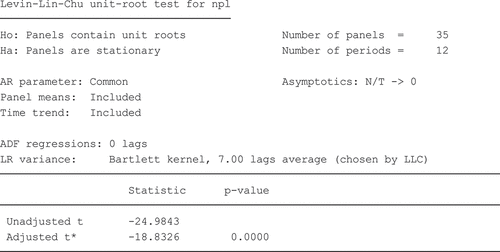


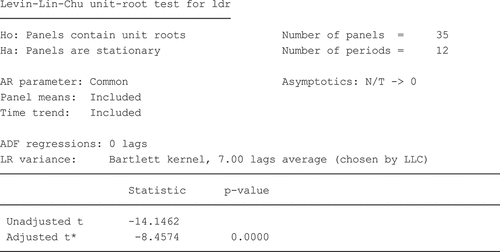


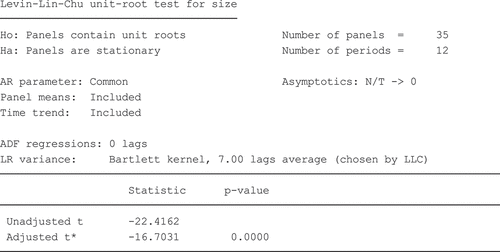
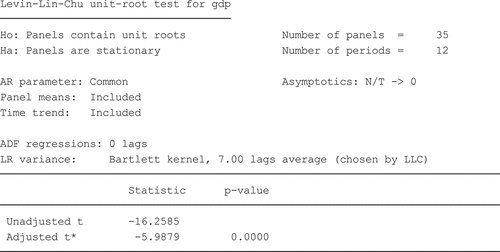

Appendix B. OLS regression model and Test of autocorrelation, heteroskedasticity
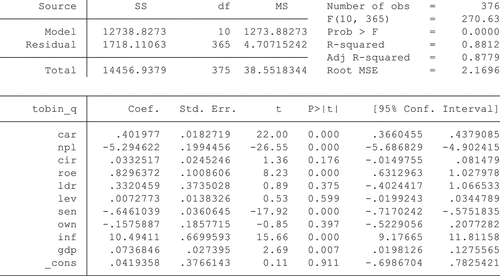
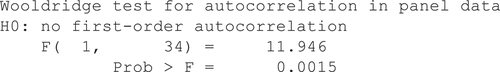

Appendix C. Test of endogeneity
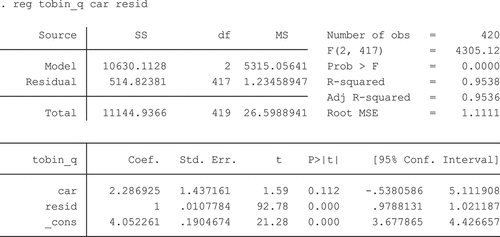
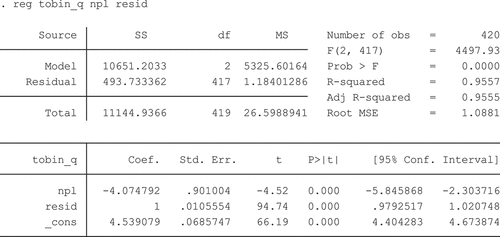

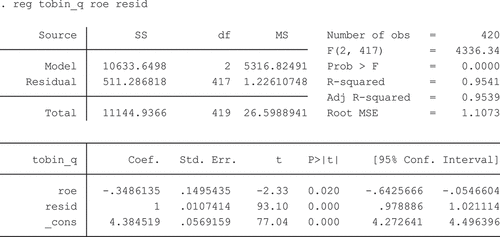
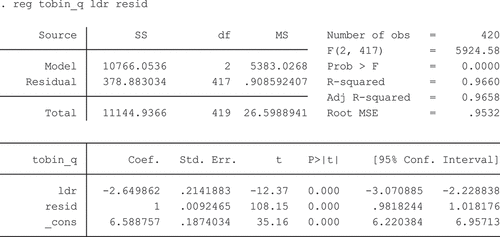
Appendix D. Regression model by using SGMM