
Abstract
The paper validates a framework which is based on EFQM and associates quality criteria to results and outputs, reflecting the organization readiness and efficiency. The paper studies the views of school principals of Kindergarten and Elementary Schools in Greece. A nationwide survey provides a representative sample of 231 school principals who were administered an online questionnaire. The questionnaire was constructed by applying the EFQM framework as the basic pattern. Based on previous approaches which use PLS models in the education context, the paper provides findings on how key criteria of EFQM associate to each other when applied to the elementary education context in Greece. Findings provide evidence that EFQM criteria are indeed associated both directly and indirectly. The validation of the proposed model supports that the particular instrument can be used as a tool for continually assess, measure and improve the management procedures of elementary education organizations in order to have improved measures of key results criteria.
PUBLIC INTEREST STATEMENT
The EFQM Model is considered to create a strong culture of aiming excellence and can help raising levels of performance, while emphasizing continuous improvement. Generally, both the original EFQM model and some derivative models have been studied in order to make clear how key managerial characteristics such as leadership and strategy affect results and outputs of the organization. In this paper, a variation of EFQM which considers some more specific associations between the key variables and the results variables is used to study managerial and organizational readiness in elementary education in Greece. It uses a representative nationwide sample of school principals who are addressed an online questionnaire. The findings reveal strong relationships among variables. The People of the School Unit, Partnerships & Resources, Pupils’ and Parents’ expectations, the leadership, and the strategy of the organization are strongly associated. The study of the associations of these key characteristics can offer a framework of self-evaluation and may lead to continuous improvements of the school unit organization.
1. Introduction
Implementing TQM principles in the field of education is widely accepted. The more people realize that the cause of failure in education is the problems in planning, TQM can be seen as the ideal process for achieving changes in public education with a systematic way (Frazier, Citation1997).
Over the past decades, most of the educational systems in European countries have adopted the evaluation procedures. In Greece evaluation appeared in 1982, and in general its implementation faced strong resistance. It started to be implemented in 2013 and since then it is in suspension.
EFQM is a well-known model based on TQM, which offers the organizations the path for improving their performance, through the relationships between Enablers and Results-cause and effect (Calvo-Μora et al., Citation2015). This study reflects the attitudes of the Primary Education School Units Principals & Supervisors in the light of the EFQM model as a self-assessment tool, customized for the Greek education context. Our goals are to propose this specific model for the improvement of the Administrative, Educational and Pedagogical Processes of the provided Primary Education. Validity, reliability and model fit are analysed using PLS models. The study emphasizes the relationship among key variables of EFQM (Enablers & Results) as they are measured using a multilevel stratified sample of 231 Principles of primary education units across the country.
1.1. The EFQM Model
The EFQM Model is based on TQM principles (G. K. Kanji et al., Citation1999), and is well-known and appreciated throughout Europe for aiming excellence, self-evaluation tool (Eskildsen & Dahlgaard, Citation2000; G.K. Kanji, Malek, et al., Citation1999; Kim et al., Citation2010; Westlund, Citation2001). EFQM Model consists of 9 Criteria, 2 categories “Enablers & Results”, and introduces a holistic approach where partial success is not enough (Naylor, Citation1999).
For years the relationships between “Enablers & Results” has been on a field of study for many researchers (Eskildsen et al., Citation2001; Ernest Osseo-Asare & Longbottom, Citation2002; Hides et al., Citation2004; Bou-llusar, Escrig-Tena, Roca-Puig, & Beltrán-Martín, Citation2005; Joao & Amaral, Citation2007; Tarí & De Juana-Espinosa, Citation2007; Safari et al., Citation2012;; Gómez et al., Citation2015; Anastasiadou, Citation2015; Adel & Transport, Citation2009; Platis & Fragouli, Citation2019). According to Tarí (Citation2006) EFQM is considered as a general tool applied for improvement, if only it undergoes with the appropriate adaptation-environment of each country such as culture, language, traditions and the framework of the education system organization.
1.2. Research model and hypotheses
This research is based on EFQM Excellence Model 2013, and focuses at understanding the procedures where organizations using the skills of their Employees aim to have the expected results: Results of People, Customers and Society. In order to lead to excellent Key Results, Leadership plays an important role along with the implementation of the Strategy and the effect of Partnerships & Resources (García-Bernal, Gargallo-Castel, Pastor-Agustín, & Ramírez-Alesón,(Citation2004). All the above, being implemented holistically and not partially (Tamimi, Citation1998), provided that the philosophy of the organization is also communicated by all the stakeholders, concerning the fundamental principles of the model. These are called vision, mission and strategy of the organization (Powell, Citation1995). The research applies and extends the principles of a conceptual framework introduced by Calvo-Mora et al. (Citation2005) in their study
of the Spanish Universities.
In the model under consideration along with the Hypotheses, which are described below, is presented.
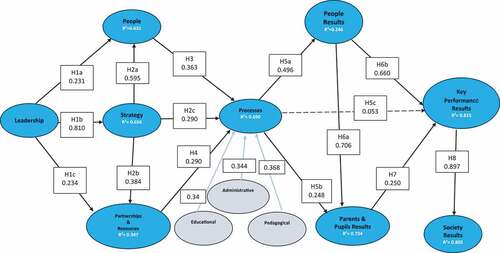
Figure 1. The research model and the direct effects after applying PLS algorithm.
1.3. Leadership
Among the factors that determine the structure of a management system for optimal quality, leadership management is considered the top (Anastasiadou & Zirinoglou, Citation2015; Fotopoulos & Psomas, Citation2010; Ravichandran & Rai, Citation2000) in achieving goals
(Ghobadian & Woo, 1994) with actions of particular importance (Gatewood & Riordan, Citation1997), aiming the supreme satisfaction of customers, society and organizational key results achievements . Leadership works with everyone involved, instilling a culture of excellence (Tarí et al., Citation2006) which can be characterized as the personality of the organization (Petridou, Citation2011) and capturing its mark on the activities that are taking place.
From the above, we formulate the following research hypotheses:
H1a. Leadership has a direct positive effect on People management.
H1b. Leadership has a direct positive effect on Strategy.
H1c. Leadership has a direct positive effect on Partnerships & Resources.
1.4. Strategy
According to the literature it has been verified that there is a strong relationship between
“Strategy”, “People”, “Partnerships & Resources” and “Processes” (Anastasiadou, Citation2015; Calvo-Mora et al., Citation2005; Eskildsen & Dahlgaard, Citation2000). Strategy involves the consolidating of a strategic processes’ planning in order to achieve the goals (Porter & Parker, Citation1993; Sun & Hong, Citation2002), taking into account the requirements of the organization’s internal and external customers. Problems in strategy affects efforts for optimum organizational performance (Petridou, Citation2011) where heart and soul in strategy formulation are actions that can produce a competitive advantage over opponents, driven by attractiveness, competitiveness and innovation (Porter, Citation1990; Sölvell, Citation2015).
From the above, we define the following research hypotheses:
H2a. Strategy has a direct positive effect on People management.
H2b. Strategy has a direct positive effect on Partnerships & Resources.
H2c. Strategy has a direct positive effect on Processes.
Regarding this final hypothesis, we distinguish the processes to be Administrative, Educational, and Pedagogical, in order to in detail comprehend and adjust to the nature of management processes of Primary Education Management in
Greece. This is further explained in the Process section below.
1.5. People
The organization’s commitment to promote the employees’ skills and the processes that are used to be achieved, are perspectives that characterize the organizational management (Ravichandran & Rai, Citation2000), since employees are the ones who carry through with the processes and serve as the key element of a company or an organization (Ahmad & Schroeder, Citation2002; Tarí et al., Citation2006). In parallel, proper human resources management is also critical to process management (Calvo-Mora et al., Citation2005).
We define the following research hypothesis:
H3. People have a direct positive effect on Processes.
1.6. Partnerships & Resources
Proper infrastructure and assurance of financial and sustainable success guarantee the implementation of scheduled processes (Yousefie et al., Citation2011) and they are playing an important role on any performance or development, due to the company’s proper financial resources management (De Beer & Friend, Citation2006). The technological upgrade is not only a crucial fact that offers competition to the market field (Gyves & O’Higgins, Citation2008; Lawrence et al., Citation2005) but also can contribute to sustainability and be highly effective on communication. Partnerships & Resources, that are also being referring to the environmental and social management and impact with a sustainability view, seem to have a significant influence to the process management (Calvo-Mora et al., Citation2006) and the Key Performance Results (Calvo-Mora et al., Citation2005).
From the above, we define the following research hypothesis:
H4. Partnerships & Resources have a direct positive effect influence on
Processes.
1.7. Processes
The processes and their implementation mediate between the Enablers & Results of the EFQM model (Suárez et al., Citation2014). Obstacles to effective processes are the lack of communication between the departments (Erturgut & Soyşekerci, Citation2009; Osseo-Asare et al., Citation2005; Tarí & De Juana-Espinosa, Citation2007), the lack of knowledge and experience for improvement actions (Kauppila et al., Citation2015; Tarí, Citation2008, Citation2011; Tarí & Madeleine, Citation2012), the adequate number of human resources and also Partnerships & Resources (Campatelli et al., Citation2011).
In our research, “Processes” are divided into three sectors: Administrative, Educational and Pedagogical. According to Petridou (Citation2000), the content of these three sectors is mentioned on the educational statutory legislation in Greece from 1985 and afterwards. It reflects the fields of engagement for all the stakeholders in a School Unit, such as Principals & Supervisors, Educators, Pupils, Parents & Guardians, etc.—directly or indirectly affected by the impacts of the current school system. A school system with a systemic approach and interactive relationships, both among its sections and environment, exchanging each other substantial and insubstantial resources – known as inflow and outflow. This segmentation also contributes to the planning and establishment of the goals, aims and standards generally, in order for them to be implemented in the best possible way and to maintain quality.
The Administrative Processes are referring to:
Building infrastructure issues such as operation, maintenance, renewal, etc. (in classrooms, activity and event rooms, auxiliary spaces, staff offices, workshops, libraries, courtyard space, etc.), and educational infrastructure issues, such as teaching and learning materials, and
Issues of administrative and secretarial support such as: keeping class books, staff issues, correspondence, cooperation with other organizations, etc.
The Educational Processes are related to:
Teaching and learning practices: Collaboration with: pupils, parents & guardians, School Counsellors, Directors of Education, Parents & Guardians Association, Centres for Children with special educational needs, Local Communities and Authorities and
Teachers training such as short-term or long-term educational programs for professional development.
Finally, the Pedagogical Processes include:
Cultural activities such as artistic, sportive, social, entertainment School
Events and
Educational Programs such as European, global, social, health education, etc.
From the above, we define the following research hypotheses:
Η5a. Processes have a direct positive effect on People Results.
Η5b. Processes have a direct positive effect on Parents and Pupils’ Results.
Η5c. Processes have a direct positive effect on Key Performance Results.
2. Methodology
The PLS modelling using SmartPLS v.3.3.3 was implemented (Hair et al., Citation2017, Citation2018; Ringle et al., Citation2015). PLS modelling uses partial regression models that allow:
Smaller samples to be used, while to use covariance methods in SEM models, large samples are required.
Estimation of regression models converges in most of the cases.
Models may contain both reflective and formative constructs.
Using SmartPLS, discriminant validity can be validated through a range of methods: Fornell and Larcker criterion, cross-loadings criterion, and heterotrait-monotrait ratio of correlations criterion (HTMT).
Nine constructs were constructed using the items of the questionnaire as indicators. Most of them are reflective in the sense that they reflect the constructs they represent. These constructs are associated with their relative indicators with arrows that start from the constructs and head to the indicators. However, the construct “Processes” in the primary education management context as mentioned is formed as a combination of three types of processes, namely Administrative Processes, Educational Processes and Pedagogical Processes. Each one is a reflective construct of seven indicators which were included in the questionnaire as separate groups of items by rephrasing the original set of items of EFQM three times to reflect the meaning of each construct. Next, these three constructs were combined in a formative way to form the overall concept of Processes as described in EFQM. So finally, Processes is formed by three constructs which in detail measure Administrative Processes, Educational Processes and Pedagogical Processes. Each one is reflectively associated with a set of seven indicators. This is a second-order reflective-formative model which was implemented using repeated indicators two-stage approach (Sarstedt et al., Citation2019). Overall, the total framework includes nine constructs, one of them being the second-order formative outcome of three constructs: Administrative Processes, Educational Processes and Pedagogical Processes.
All tests of significance were performed using the Boostrap method with 5000 replications.
2.1. Reliability and validity
Construct reliability and validity were examined using Cronbach’s alpha, rho_A, Composite Reliability and Average Variance Extracted (AVE). For Cronbach’s alpha, rho_A, Composite Reliability the threshold in order for a scale to be considered reliable is 0.70, while for AVE the threshold for a scale to be valid is 0.50. presents the findings as they are produced by SmartPLS. All values are well above the thresholds with no exceptions.
Table 1. Construct reliability and validity
To verify discriminant validity three criteria were used: the Fornell-Larcker criterion (Fornell & Larcker, Citation1981), the cross-loadings criterion and the heterotraitmonotrait ratio of correlations (HTMT) criterion (Farrell, Citation2010); Henseler et al., Citation2015). For the Fornell-Larcker criterion the correlation matrix of all the constructs is calculated. In order to have discriminant validity the correlations should be smaller than the square root of AVE for every construct. For the cross-loadings criterion the loadings of the indicators that reflect a construct should be higher than the loadings that these indicators have with any other construct, and this should be true for each set of indicators that reflect each construct. For the heterotrait-monotrait ratio of correlations (HTMT) criterion, the average correlations of indicators measuring the same construct relative to the average correlations of indicators across constructs measuring different phenomena, is calculated. Values close to unity indicate a lack of discriminant validity. The values of 0.85 and 0.95 are considered as the thresholds, the premier being more conservative. If the HTMT is under 0.85 or at least under 0.95 we conclude that discriminant validity is evident. But because this criterion is more restrictive than the other two, in case that HTMT is over 0.95 then Boostrap intervals are used to see if HTMT confidence interval include the value 1. If not then we can conclude that we have discriminant validity.
Cross-loadings were calculated and the second criterion is satisfied, but for economy the findings are not presented here. For the Fornell-Larcker criterion is constructed. In all correlations are smaller than the square roots of AVE. As for the HTMT criterion, the findings are presented in . Most HTMT indices are smaller than 0.85. For six cases, the index is over 0.85 but not over 0.95. Further, Boostrap intervals (5000 replications) do not contain the value of 1. So, eventually there is evidence that discriminant validity is present with respect to each one of the three criteria used.
Table 2. Discriminant validity coefficients (Fornell-Larker criterion) (AVE on the diagonal)
Table 3. The heterotrait-monotrait ratio of correlations (HTMT)
2.2. Model evaluation
presents the path diagram that describes the framework of the EFQM as adapted to fit the specific context and with reference to similar studies. The diagram presents the constructs, the effects on each arrow and the R2. Administrative Processes, Educational Processes and Pedagogical Processes, form the Processes construct. In cases that the effects are not statistically significant (p = 0.05) the arrows are presented as dotted lines.
All R2 are over 0.60 except for Partnerships & Resources (R2 = 0.347) and People Results (R2 = 0.246). Overall, there is evidence that regression models have a high degree of goodness of fit.
Regarding the effects of the constructs with reference to the hypotheses ():
Almost all direct effects are statistically significant with the exception of
Table 4. Estimated effects and significance
PROCESSES → KEY PERFORMANCE RESULTS. However, all indirect effects and
total effects are indeed statistically significant. So, all hypotheses but one are supported. For hypothesis H5c, while direct effect is not statistically significant, so Process have not a direct impact on Key Performance Results, the indirect effect and total effect are statistically significant and provide evidence of a significant overall effect of the
2.3. Processes on Key Performance Results
In detail, Leadership has a positive direct effect on People thus H1a is supported. The direct effect is 0.231. In addition, the indirect effect is more than twice the direct effect, resulting in this way to a total effect of 0.713 in which the ratio of direct to indirect effects is 1:2. Leadership affects People management in many ways and indirect effects are even larger than the direct effects.
Leadership has only a direct effect on Strategy (0.810), so H1b is supported. The effect is the second larger total effect within the specific framework.
Leadership has a significant direct effect on Partnerships & Resources and an even larger indirect effect. H1c is supported.
Strategy has significant direct effects on People management (a high value of 0.595) and on Partnerships & Resources (0.384). The effects on Processes are direct and indirect, the indirect effect being larger, resulting to a total significant effect of 0.617. Hypotheses H2a, H2b and H2c are supported.
People management and Partnerships & Resources only have direct effects on Processes (0.290 and 0.363 respectively). They are small-to-medium size effects and statistically significant. Hypotheses H3 and H4 are supported.
Hypothesis H5a is about the effect of Process on People Results and it can be separated by construction, to the effect of Administrative, Educational and Pedagogical processes. The effect of the second-order construct Processes is only direct, the effects of Administrative, Educational and Pedagogical processes are indirect through Process construct. Hypothesis H5a is supported since the direct effect is 0.496 and statistically significant. The first-order constructs in turn, have significant indirect effects of nearly the same size on People Results.
Hypothesis H5b is about the effect of Process on Parents & Pupils Results. The hypothesis is supported since the direct effect is positive and statistically significant. Further, the indirect effect is larger than the direct effect and added together they result to a significant and medium size total effect (0.248, 0.350 and 0.598 respectively).
When the effects are attributed to the original first-order constructs of Administrative, Educational and Pedagogical processes, we can see that there are significant but small-sized effects.
H5c hypothesis addresses the effect of Processes on Key Performance Results.
As mentioned, the direct effect is not statistically significant, and so are the effects of Administrative, Educational and Pedagogical processes. So, the hypothesis is not supported. However, indirect effect is much larger than the direct effect (0.476) and indeed it is statistically significant, resulting to a statistically significant total effects of all the constructs on Key Performance Results.
People Results have a high and statistically significant direct effect on Parents & Pupils Results (0.706). It is one of the highest effects within this framework and provides enough evidence that staff management directly affects the “customers” results to a high degree. Hypothesis H6a is supported.
Hypothesis H6b is also supported because People Results have a high and significant effect on Key Performance Results. There is also an indirect effect, so added together they result to a large and significant total effect of 0.836.
Finally, hypothesis H8 is supported. Key Performance Results have a direct effect on Society Results, 0897. This is statistically significant, and it is the highest effect between the constructs of the specific framework.
3. Results
The measurement for Customers, People and Society Satisfaction as well as the Overall Results are performed, according to the EFQM model (2013) in two ways: a) with the perception indicators (external) and b) the performance indicators (internal).
3.1. People results
People Results have an effect on Student Results and in addition these two have an impact on Overall Organization Results (Calvo-Mora et al., Citation2005).
We define the following research hypotheses:
Η6a. People Results have a direct positive effect on Parents and Pupils Results.
H6b. People Results have a direct positive effect on Key Performance Results.
3.1.1. Customer results (parents and pupils results)
The Enablers are directly related to Customer Satisfaction and in particular, any improvement leads to significant results in Customer satisfaction (Sadeh & Garkaz, Citation2015; Tarí & Madeleine, Citation2012). The Key Performance Results depend directly on those which have been identified as the most important Enablers. Specifically, the Processes first and secondly the Partnerships & Resources (Adel & Transport, Citation2009).
We define the following research hypotheses:
Η7. Parents and Pupils Results have a direct positive effect on Key Performance Results.
3.1.2. Key performance results and Society results
Society Results satisfactorily reflect the achievements of an organization, being in line with the expectations and the needs of the community (Madan, Citation2010); the positive and the negative impacts that a business or an organization can have on its social and physical environment (Conti, Citation2007).
We define the following research hypotheses:
H8. Key Performance Results have a direct positive effect on Society Results.
3.2. Survey and sample
At first, the original EFQM questionnaire was translated to Greek and back translated to English so that it would be properly adapted to the specific context. Next, a group of seven school principals checked the content of the translated questionnaire to see if it is suitable for a research in the specific context. Minor modifications and improvements were made.
The questionnaire was administered to a sample which consisted of Principals &
Supervisors of selected Greek Primary Education School Units (Preschool & Primary Schools) during March and April 2019. The authors had promptly applied for permission to the committee of the Ministry of Education (53/08-11-2018) for approval with respect to methodological and ethical issues, and the permission was granted (Φ.15/194,658/204,175/Δ1/27–11-2018). The sample included 29% of the School Units of Primary Education nationwide, and is representative and proportionate of the school population. The questionnaire was completed after sending an email to the e-mail addresses of the selected Greek Primary Education School Units. The survey was conducted by the online survey platform Question Pro. A total of 231 completed questionnaires were recorded through a two-wave process. Online questionnaires allow to create items having obligatory responses, so three were no missing values.
The questionnaire consists of two groups of items, besides those that record the demographic characteristics. The first group includes five subgroups of items (Enablers: Leadership, Strategy, People, Partnerships & Resources and Administrative,
Educational and Pedagogical Processes), a total of 50 items. The second group consists of four subgroups of items (Results: Parents & Pupils Results, People Results, Society Results and Key Performance Results), totally 32 items. Totally, the questionnaire consists of 82 items, based on the EFQM questionnaire (2013). Five-point Likert type scales were used with the following options: “We have no opinion”, “We have some plans”, “We have started it”, “We are close to completing it”, “We have completed it”.
3.3. Discussion
The EFQM model is modified in the research to adjust to previous quantitative research, to further validate the models that are already introduced, and to provide more insights in the specific context. The model is analysed using PLS modelling. Constructs represent the initial EFQM criteria. After analysing the direct and indirect effects between the constructs, their associations are confirmed and the findings are in accordance with those of previous research (Calvo-Mora, Leal, & Roldan, Citation2005; Anastasiadou & Zirinoglou, Citation2015).
Processes are not affecting school unit results directly as stated by the answers of school principals. However, affecting staff on the one hand and students and parents on the other, Processes have a significant impact measured as a total statistically significant effect. As a result, different measures of the Results are not only directly affected by Processes but also indirectly through several paths through the relationships between the Criteria as a whole (García-Bernal et al., Citation2018), so the findings provide evidence that they are being implemented holistically and not partially (Naylor, Citation1999; Tamimi, Citation1998). Furthermore, there is an internal logical connection between the Results (People Results, Customers Results, Key Performance Results and Society Results) of the EFQM Model as Calvo-Mora et al. (Citation2005) and Ghobadian and Seng Woo (Citation1996) had already mentioned. In particular, it has been claimed that the Enablers are directly related to Customer Satisfaction (Sadeh & Garkaz, Citation2015; Tarí & Madeleine, Citation2012), People Results have an effect on Student
Results and in addition these two have an impact on Overall Organization Results
(Calvo-Mora et al., Citation2005) and Society Results satisfactorily reflect the achievements of an organization (Conti, Citation2007; Madan, Citation2010). Taking also into consideration the indirect effects, the existence of this connection is strongly confirmed.
In addition, Leadership in a School Unit can act as a driving force (Calvo-Mora, Leal, & Roldan, Citation2005) for the whole administration as well as for the improvement processes that are taking place. In public School Units, due to the bureaucracy and the complexity of the management procedures, it is a common place the inefficient communication processes, the difficulty in planning, controlling, analysing and improving procedures, the lack of prior knowledge and experience and finally the lack of human resources – lead all together to difficulties in decision making and to the obstacles constantly. Hence, if the leadership of a School Unit develop and extent the appropriate school culture among the education staff, the dynamics towards the Processes can be increased.
All the previous mentioned, with the aim of expedient Strategy and Partnerships & Resources, efficiency and sustainability as well as opportunities for innovation can arise.
The adaptability of the Procedures of a School Unit to fulfil and also exceed the requirements and the expectations of the pupils and the parents, and additionally to empower the educational staff to take specific actions towards improving these processes is greatly demanding and as Zavlanos (Citation2006) highlighted, extremely difficult to be measured. Thus, specific actions in School Units must be performed, which can contribute to the gathering of data and measurements for Customers, People and Society Satisfaction, as well as for the Overall Results, in two ways—with the perception indicators (external) and the performance indicators (internal). A statutory legislation based on this, could give a strong boost to this procedure.
Therefore, self-assessment is an exceptional operation that not only identifies the current position of an organization but also determines and gives feedback for the future directions and priorities—meaning that the right supporting tool during this procedure is so crucial for its sustainability. The EFQM Model can be used as a tool for continually measuring and improving the measures of assessment and to an extend improving the decision processes of the organizations.
4. Conclusions
Both the EFQM model and the derivative models as the one studied in this paper, assume a specific causal relationship among key variables. These cause and effects relations should be studied and measured only when theory supports them. This paper adopts models found in previous research in literature and offers further evidence on validating them. However, the initial support of a model or framework is crucial and only well-documented models should be studied, as statistical analyses only validates models that are already introduced and supported theoretically in literature. So, this analysis has some merits as far as the initial model and its modification to fit PLS analysis, is accepted to serve as a framework.
EFQM Model by creating a strong culture of aiming excellence among School Units, can help raising levels of performance, while emphasizing continuous improvement. When implementing a strategic planning taking into account all the stakeholders, EFQM framework can act as a blueprint to reinforce, and help responding effectively to opportunities and efficiently, and with flexibility, to threats in a sustainable way. The People of the School Unit by clarifying their job roles, managing successfully Partnerships & Resources and applying appropriate measures and metrics, can fulfil their operational tasks, empower their responsibilities and actively seek solutions, achieving personal and organizational goals. Teamwork can add value for Pupils’ and Parents’ expectations and by developing the same principles and beliefs with the contribution of the leadership, a continuous administrative, educational and pedagogical path of innovation and creativity can emerge. The EFQM Model’s infrastructure, among the existence of the inter-relations between the Enablers & Results—besides, with a bottom-up approach, offers a comparative advantage on understanding these relations and effects. EFQM Model is a practical tool that supports teamwork, professional self-improvement prospects as well as a highly promising environment (Davies et al., Citation2007). Studies as this one demonstrate that it is flexible and easy to customize and implement in various fields, education included. Models as the one used, provide evidence that EFQM can be used as a good practice for self-evaluation.
Disclosure statement
No potential conflict of interest was reported by the author(s).
Additional information
Funding
Notes on contributors
Kostas Zafiropoulos
Gianna Kaplani is a PhD candidate at the Department of International and European Studies, University of Macedonia, Greece and a kindergarten headmaster at Thessaloniki, Greece. She holds an MA in European Education and Youth Policies, University of Macedonia. Kostas Zafiropoulos, PhD in statistics, is Professor (Quantitative Methods) at the Department of International and European Studies, University of Macedonia, Greece. They are jointly working on the evaluation of education using quantitative and qualitative methods. Among their key research interests is the application and validation of established quantitative instruments on the process of school and education evaluation. The use of EFQM reported in this paper is part of this general field of research.
References
- Adel, R., & Transport, M. (2009). Achieving Egyptian higher education institutions’ excellence through the application of the EFQM model: An investigative study. International Journal of Business Excellence (IJBEX), 2(2), 157–18. https://doi.org/10.1504/IJBEX.2009.022723
- Ahmad, S., & Schroeder, R. G. (2002). The importance of recruitment and selection process for sustainability of total quality management. International Journal of Quality and Reliability Management, 19(5), 540–550. https://doi.org/10.1108/02656710210427511
- Anastasiadou, S. D., & Zirinoglou, P. A. (2015). EFQM dimensions in greek primary education system. Procedia Economics and Finance, 33, 411–431. https://doi.org/10.1016/S2212-5671(15)01725-6
- Anastasiadou, S. D. (2015). The roadmaps of total quality management in the greek education system according to Deming, Juran, and Crosby in light of the EFQM model. Procedia Economics and Finance, 33, 562–572. https://doi.org/10.1016/S2212-5671(15)01738-4
- Calvo-Mora, A., Leal, A., & Roldán, J. L., et al. (2005). Relationships between the EFQM model criteria: A study in Spanish universities. Total Quality Management and Business Excellence, 16(6), 741–770. https://doi.org/10.1080/14783360500077708
- Calvo-Mora, A., Leal, A., & Rolden, J. L., et al. (2006). Using enablers of the EFQM model to manage institutions of higher education. Quality Assurance in Education, 14(2), 99–122. https://doi.org/10.1108/09684880610662006
- Calvo-Μora, A., Navarro-García, A., & Periañez-Cristobal, R., et al.(2015). ScienceDirect project to improve knowledge management and key business results through the EFQM excellence model. International Journal of Project Management, 33(8), 1638–1651. https://doi.org/10.1016/j.ijproman.2015.01.010
- Campatelli, G., Citti, P., & Meneghin, A., et al.(2011). Total quality management & business excellence development of a simplified approach based on the EFQM model and six sigma for the implementation of TQM principles in a university administration. Total Quality Management & Business Excellence, 22(7), 691–704. https://doi.org/10.1080/14783363.2011.585755
- Carlos Bou‐Llusar J, Escrig‐Tena A B, Roca‐Puig V and Beltrán‐Martín I. (2005). To what extent do enablers explain results in the EFQM excellence model?. Int J Qual & Reliability Mgmt, 22(4), 337–353. 10.1108/02656710510591192
- Conti, T. A. (2007). A history and review of the European quality award model. TQM Magazine, 19(2), 112–128. https://doi.org/10.1108/09544780710729962
- Davies, J., Douglas, A., & Douglas, J., et al.(2007). The effect of academic culture on the implementation of the EFQM excellence model in UK universities. Quality Assurance in Education, 15(4), 382–401. https://doi.org/10.1108/09684880710829965
- De Beer, P., & Friend, F. (2006). Environmental accounting: A management tool for enhancing corporate environmental and economic performance. Ecological Economics, 58(3), 548–560. https://doi.org/10.1016/j.ecolecon.2005.07.026
- Ernest Osseo-Asare, A., & Longbottom, D. (2002). The need for education and training in the use of the EFQM model for quality management in UK higher education institutions. Quality Assurance in Education, 10(1), 26–36. https://doi.org/10.1108/09684880210416085
- Erturgut, R., & Soyşekerci, S. (2009). The problem of sustainability of organizational success in public educational institutions: A research on the education administrators in Turkey. Procedia - Social and Behavioral Sciences, 1(1), 2092–2102. https://doi.org/10.1016/j.sbspro.2009.01.368
- Eskildsen, J. K., & Dahlgaard, J. J. (2000). A causal model for employee satisfaction. Total Quality Management, 11(8), 1081–1094. https://doi.org/10.1080/095441200440340
- Eskildsen, J. K., Kristensen, K., & Jørn Juhl, H., et al.(2001). The criterion weights of the EFQM excellence model. International Journal of Quality & Reliability Management, 18(8), 783–795. https://doi.org/10.1108/EUM0000000006033
- Evaluation of the educational work (EEW)-self-evaluation of the school unit. (in Greek). 17/Jan/2021. Accessed http://aee.iep.edu.gr/
- Farrell, A. M. (2010) Insufficient discriminant validity: A comment on Bove, Pervan, Beatty, and Shiu (2009). Journal of Business Research, 63(3), 324–327doi: https://doi.org/10.1016/j.jbusres.2009.05.003
- Fornell, C., & Larcker, D. F. (1981). Evaluating structural equation models with unobservable variables and measurement error. Journal of Marketing Research, 18(1), 39–50. https://doi.org/10.1177/002224378101800104
- Fotopoulos, C. V., & Psomas, E. L. (2010). The structural relationships between TQM factors and organizational performance. The TQM Journal, 22(5), 539–552. https://doi.org/10.1108/17542731011072874
- Frazier, A. (1997). A Roadmap for Quality Transformation in Education. CRC Press. https://doi.org/10.4324/9781003075981.
- García-Bernal J, Gargallo-Castel A, Pastor-Agustín G and Ramírez-Alesón M. (2004). Total Quality Management in Firms: Evidence from Spain. Quality Management Journal, 11(3), 20–34. 10.1080/10686967.2004.11919119
- García-Bernal, J., Gargallo-Castel, A., & Pastor-Agustín, G., et al.(2018). Total quality management in firms: evidence from Spain. Quality Management Journal, 11(3), 2034. https://doi.org/10.1080/10686967.2004.11919119
- Gatewood, R. D., & Riordan, C. M. (1997). The development and test of a model of total quality: organizational practices, TQ principles, employee attitudes and customer satisfaction. Journal of Quality Management, 2(1), 41–65. https://doi.org/10.1016/S1084-8568(97)90021-3
- Ghobadian, A., & Seng Woo, H. (1996). Characteristics, benefits and shortcomings of four major quality awards. International Journal of Quality & Reliability Management, 13(2), 10–44. https://doi.org/10.1108/02656719610109999
- Gómez, J. G., Costa, M. M., & Martínez Lorente, A. R., et al.(2015). An in-depth review of the internal relationships of the EFQM model. TQM Journal, 27(5), 486–502. https://doi.org/10.1108/TQM-05-2013-0056
- Gyves, S., & O’Higgins, E. (2008). Corporate social responsibility: An avenue for sustainable benefit for society and the firm? Society and Business Review, 3(3), 207–223. https://doi.org/10.1108/17465680810907297
- Hair, J. F., Hult, G. T. M., Ringle, C. M., & Sarstedt, M., et al.(2017). A Primer on Partial Least Squares Structural Equation Modeling (PLS-SEM) (2nd Edition). Sage.
- Hair, J. F., Sarstedt, M., Ringle, C. M., & Gudergan, S. P., et al.(2018). Advanced Issues in Partial Least Squares Structural Equation Modeling. Sage.
- Henseler, J., Ringle, C. M., & Sarstedt, M., et al.(2015). A new criterion for assessing discriminant validity in variance-based structural equation modeling. J Of the Acad Mark Sci, 43(1), 115–135. https://doi.org/10.1007/s11747-014-0403-8
- Hides,M.T., Davies,J., & Jackson,S., etal.(2004). Implementation of EFQM excellence model self-assessment in the UK higher education sector - lessons learned from other sectors. TQM Magazine, 16(3), 194–201. https://doi.org/10.1108/09544780410532936
- Joao,M.R., & Amaral,A. (2007). A Self-Assessment of Higher Education Institutions from the Perspective of the EFQM Excellence Model. In D.F.Westerheijden, B.Stensaker, and M.J.Rosa (Eds.), Quality Assurance In Higher Education. Higher Education Dynamics 20 (Springer) (pp. 181–207).
- Kanji,G.K., Malek,A., & Tambi, B.A., etal.(1999). Total quality management in UK higher education institutions. Total Quality Management, 10(1), 129–153. https://doi.org/10.1080/0954412998126
- Kauppila, O., Mursula, A., Harkonen, J., & Kujala, J., et al.(2015). Evaluating university– Industry collaboration: The European foundation of quality management excellence model-based evaluation of university–industry collaboration. Tertiary Education and Management, 21(3), 229–244. https://doi.org/10.1080/13583883.2015.1045550
- Kim, D. Y., Kumar, V., & Murphy, S. A., et al.(2010). European foundation for quality management business excellence model: an integrative review and research agenda. International Journal of Quality and Reliability Management, 27(6), 684–701. https://doi.org/10.1108/02656711011054551
- Lawrence, A. T., Weber, J., & Post, E. L., et al.(2005). Business and Society. McGraw-Hill.
- Madan, P. (2010). An award journey for business excellence: the case study of a public sector unit. Total Quality Management and Business Excellence, 21(12), 1343–1364. https://doi.org/10.1080/14783363.2010.530774
- Naylor, G. (1999). Using the business excellence model to develop a strategy for a healthcare organization. International Journal of Health Care Quality Assurance, 12(2), 37–44. https://doi.org/10.1108/09526869910261240
- Osseo-Asare, A. E., Longbottom, D., & Murphy, W. D., et al.(2005). Leadership best practices for sustaining quality in UK higher education from the perspective of the EFQM excellence model. Quality Assurance in Education, 13(2), 148–170. https://doi.org/10.1108/09684880510594391
- Petridou, E. (2011). Management: An Introductory Approach (3rd ed). Sofia Publications. (In Greek).
- Petridou, E. (2000). An introduction of a model procedure of planning the school unit work. In Z. Papanaoum (Ed.), Planning the educational work in school units. Greek Pedagogical Institute and Aristotle University of Thessaloniki, 49–57. (In Greek).
- Platis, C., & Fragouli, E. (2019). TQM in higher education institutions: the case of HSJ. International Journal of Higher Education Management, 6(1), 21–46. https://doi.org/10.24052/IJHEM/V06N01/ART-3
- Porter, L. J., & Parker, A. J. (1993). Total quality management-the critical success factors. Total Quality Management, 4(1), 13–22. https://doi.org/10.1080/09544129300000003
- Porter, M. E. (1990). The Competitive Advantage of Nations. Free Press.
- Powell, T. C. (1995). Advantage: A review and empirical study. Strategic Management Journal, 16(1), 15–37. https://doi.org/10.1002/smj.4250160105
- Ravichandran, T., & Rai, A. (2000). Quality management in systems development: an organizational system perspective. MIS Quarterly, 24(3), 381–415. Retrieved from https://doi.org/10.2307/3250967https://doi.org/10.2307/3250967
- Ringle, C. M., Wende, S., & Becker, J.-M., et al.(2015). SmartPLS 3. SmartPLS GmbH. http://www.smartpls.com.
- Sadeh, E., & Garkaz, M. (2015). Explaining the mediating role of service quality between quality management enablers and students’ satisfaction in higher education institutes: The perception of managers. Total Quality Management and Business Excellence, 26(11–12), 1335–1356. https://doi.org/10.1080/14783363.2014.931065
- Safari, H., Abdollahi, B., & Ghasemi, R., et al. (2012). Canonical correlation analysis between people criterion and people results criterion in EFQM model. Total Quality Management and Business Excellence, 23(5–6), 541–555. https://doi.org/10.1080/14783363.2012.669540
- Sarstedt, M., Hair, J. F., Jun-Hwa, C., Becker, J.-M., & Ringle, C. M., et al.(2019). How to specify, estimate, and validate higher-order constructs in PLS-SEM. Australasian Marketing Journal, 27(3), 197–211. https://doi.org/10.1016/j.ausmj.2019.05.003
- Sölvell, Ö. (2015). The competitive advantage of nations 25 years – Opening up new perspectives on competitiveness. Competitiveness Review, 25(5), 471–481. https://doi.org/10.1108/CR-07-2015-0068
- Suárez, E., Roldán, J. L., & Calvo-Mora, A., et al. (2014). A structural analysis of the EFQM model: An assessment of the mediating role of process management. Journal of Business Economics and Management, 15(5), 862–885. https://doi.org/10.3846/16111699.2013.776627
- Sun, H., & Hong, C. (2002). The alignment between manufacturing and business strategies: its influence on business performance. Technovation, 22(11), 699–705. https://doi.org/10.1016/S0166-4972(01)00066-9
- Tamimi, N. (1998). A second-order factor analysis of critical TQM factors. International Journal of Quality Science, 3(1), 71–79. https://doi.org/10.1108/13598539810196886
- Tarí, J. J., & De Juana-Espinosa, S. (2007). EFQM model self-assessment using a questionnaire approach in university administrative services. TQM Magazine, 19(6), 604–616. https://doi.org/10.1108/09544780710828449
- Tarí, J. J., & Madeleine, C. (2012). Introducing management models in service organisations in developed and developing countries. Service Industries Journal, 32(5), 789–806. https://doi.org/10.1080/02642069.2010.540755
- Tarí, J. J., Molina, J. F., & Castejón, J. L., et al. (2006). The relationship between quality management practices and their effects on quality outcomes. European Journal of Operational Research, 183(2), 483–501. https://doi.org/10.1016/j.ejor.2006.10.016
- Tarí, J. J. (2006). An EFQM model self-assessment exercise at a Spanish university. Journal of Educational Administration, 44(2), 170–188. https://doi.org/10.1108/09578230610652051
- Tarí, J. J. (2008). Self-assessment exercises: A comparison between a private sector organisation and higher education institutions. International Journal of Production Economics, 114(1), 105–118. https://doi.org/10.1016/j.ijpe.2008.01.005
- Tarí, J. J. (2011). Research into quality management and social responsibility. Journal of Business Ethics, 102(4), 623–638. https://doi.org/10.1007/s10551-011-0833x
- Westlund, A. H. (2001). Measuring environmental impact on society in the EFQM system. Total Quality Management, 12(1), 135. https://doi.org/10.1080/09544120020010147
- Yousefie, S., Mohammadi, M., & Monfared, J. H., et al. (2011). Selection effective management tools on setting European foundation for quality management (EFQM) model by a quality function deployment (QFD) approach. Expert Systems with Applications, 38(8), 9633–9647. https://doi.org/10.1016/j.eswa.2011.01.166
- Zavlanos, M. (2006). On quality of services and products. Stamoulis Publications. (in Greek).