
 ?Mathematical formulae have been encoded as MathML and are displayed in this HTML version using MathJax in order to improve their display. Uncheck the box to turn MathJax off. This feature requires Javascript. Click on a formula to zoom.
Abstract
Today’s omnichannel business models incorporate physical and digital touchpoints interacting with customers. A hyper-personalization strategy relies on the organization’s capability to gather and transform customer data into personalized experiences; therefore, when a hyper-personalization organizational plan is put in place, it serves two main functions: to deliver personalized experiences and increase the number of customers receiving such experiences. For this to happen, four elements are required for a hyper-personalization strategy: data foundation, decisions, design, and distribution. While customer master data management relies on the correct identification of a customer, a real customer insight can only be achieved when three types of customer data are gathered: Identity, Contactability, and Traceability (I, C, T)- fulfilling the first element of a hyper-strategy. This article aims to identify the benefits in the total number of customers that can receive a hyper-personalization strategy when real-time touchpoints are linked to a customer Master Data Management that integrates the three types of customer data.
PUBLIC INTEREST STATEMENT
The growing volumes of consumer data have turned its analysis into a powerful tool to increase productivity and develop focused strategies for the target consumer. Consumer data is crucial for decision-making and strengthening the companies-customers relationship from the companies’ perspective. Although big data plays a more critical role in decision-making, there is still necessary to analyze data with the appropriate techniques depending on the final purpose.This paper focuses on identifying the benefit of customer data integration from digital and physical touchpoints by filling incomplete customer information in databases. The effectiveness of customer database migration and strategies transformation of anonymized records into complete customer records are analyzed to identify the benefits in the total number of customers that can receive a hyper-personalization strategy in real-time.
1. Introduction
Today, organizations must aspire to an institutional and comprehensive knowledge of all interactions between them and their customers (Jain et al., Citation2018; Kalia & Paul, Citation2021; Low, Citation2000). In addition, the need to deliver personalized communication and services is a challenge that organizations face due to the introduction of digital channels while expanding traditional ones (Andreassen et al., Citation2018; Bleier & Eisenbeiss, Citation2015; Wolny & Charoensuksai, Citation2014).
Each interaction between the organization’s touchpoints and its customers generates data, and those touchpoints offer companies the opportunity to record the customers’ data that can generate value for them (Erevelles et al., Citation2016; Rekettye & Rekettye, Citation2019). Each touchpoint is supported by platforms or systems, which ingest that data into their databases (Ducange et al., Citation2018).
Customer information must be available for all touchpoints and source systems to deliver hyper-personalized experiences through an omnichannel business model (Kalia & Paul, Citation2021). This work uses the proposed definition of personalization established by Imhoff to achieve personalization goals (Imhoff et al., Citation2001), “Personalization is the ability of a company to recognize and treat its customers as individuals through personal messaging, targeted banner ads, special offers on bills, or other personal transactions.”
Previous works identified two personalization aims: delivering information relevant to specific individuals or groups of particular individuals in the format and layout specified at appointed time intervals. The second is the increase of the revenue and decrease of the business by applying a one-to-one marketing understanding of its customers’ needs, habits, lifestyle, preferences, likes, and dislikes. In the end, the combination of both aims is addressed or at least given the illusion of satisfying the customers’ individual needs and preferences (Hess et al., Citation2020; Jain et al., Citation2021, Citation2018; Won, Citation2002).
A hyper-personalization strategy has four elements: data foundation, decisions, design, and distribution (Boudet et al., Citation2017; Jain et al., Citation2021). All these elements are necessary; however, data foundation is the starting point because a hyper-personalization strategy needs a customer’s feedback to deliver the experiences. For example, if all customers are unknown, a hyper-personalization approach will help build the customer database to receive hyper-personalized experiences later on.
Digital clienteling is defined as improving customer engagement by providing a unified customer information resource (Jain et al., Citation2021); the increasing use of smartphone applications makes this device the preferred tool for customization (Mallya & Nair, Citation2016).
As the current literature sets, implementing hyper-personalization strategies can improve the clients’ contactability and customer engagement as needed (Jain et al., Citation2021; Micu et al., Citation2022; Ngoc Thang et al., Citation2020). However, it is necessary to study the impact, peak, and limit of these strategies and the best possible moment to implement a new approach to continue increasing the number of customers that can receive hyper-personalized engagements. Additionally, most studies rely on studying either e-commerce or physical stores but not a combination of both (Micu et al., Citation2022; Ngoc Thang et al., Citation2020). This study intends to demonstrate the added benefits of establishing a hyper-personalization strategy through physical and digital touchpoints concerning the number of customers receiving such a strategy.
An example of the previously mentioned occurred at a retail company selected to run hyper-personalization strategies. This trial was necessary to demonstrate the impact of implementing digitalization strategies on the number of customers who could receive Hyper-personalization strategies. Such a company made it possible to reach 15 million clients that could be considered during the research to demonstrate the effects of the aims of the project while being monitored for 15 months. In the end, all the work resulted in the increment of the number of customers. The collected data shows that more significant benefits can be obtained when customers receive hyper-personalized offers through such strategies, real-time data input through an architecture that links a customer data platform (real-time) and an MDM (near real-time).
2. Literature review
Data personalization strategy, data gathering, and master data management are the sections that conform to the theoretical framework. The literature review was performed to support the proposed architecture theoretically for the hyper-personalization experience.
2.1. Data for a personalization strategy
The necessity for integrating customer data across the organization has been an old problem that has been addressed by various technologies and governance methodologies (White et al., Citation2006). Three information types can be gathered from customers’ Identity, Contactability, and Traceability; despite customers providing information without being aware- hidden information, like cookies or IP addresses, this type of information can also be grouped into one or all three of those categories when handled correctly.
The customer information can be defined as identity (I): Personal Information from the customer such as their name, last name, date of birth, gender, social security number, tax ID, and all other types of information is used for authenticating an individual excluding contact information (Narayanan & Shmatikov, Citation2010).
Contactability (C): Contact information used in campaign management direct and online channels (Anderson, Citation2009), like address, telephone, cell phone, App, WhatsApp, social networks.
Traceability (T): identifies that a customer is interacting with the company and is divided into two types.
Transaction or receipt: the interaction where a transaction is carried out (Kurniawan et al., Citation2017), and there is a record of what occurred (or there should be a record), for example, a purchase, first and second-party data (Paulina, Citation2017), a complaint, balance inquiry.
Visit: interaction without creating a record, like a store customer’s visits without purchase.
Personalization is defined as individualization reached by considering specific customer preferences (Nobile and Kalbaska Citation2020). Therefore, the path toward hyper-personalization is based on customer information: Identity, Contactability, and Traceability.
shows the relationships among a customer’s knowledge elements. Relationship among information gathered from customers enables organizations to map their customer information and allocate it into each of the seven states. The initial result of mapping customer information in states A to Z will vary across industries and business models. Some industries have a more significant customer concentration in state A because of their innate customer relation, for example, e-commerce, banking, retail by membership, among others. However, some strategies help complete data profiles and upgrade towards an A state regardless of industry and business models. The initial result shall reflect its business model and its current process of customer data gathering.
Figure 1. Relationship among the three pillars of the hyper-personalization.
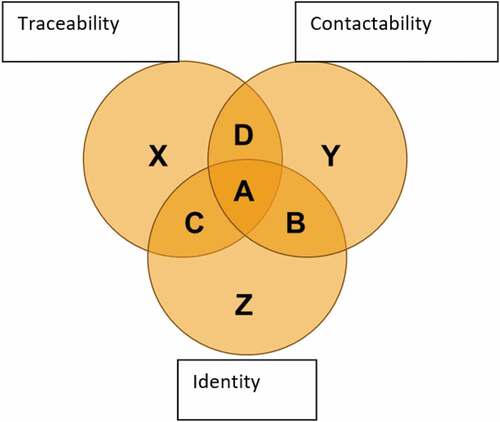
The initial result can be improved by migrating a customer record by completing the missing information (I, C, T). The desired state is A, where all three Customer Information types are present. Personalization can be delivered to customers in conditions A and D; the main difference is that state A allows to address them personally. Therefore, A state represents hyper-personalization. In addition, both states (A and D) will enable us to analyze and connect with them using historical omnichannel information.
2.2. Data gathering across touchpoints
Data gathering has been facilitated by digital technologies which interface through digital touchpoints (Erevelles et al., Citation2016; Straker & Wrigley, Citation2018). For pure digital business models, where most of its touchpoints are digital, customer data is easy to find (Wirtz, Citation2019). However, business models that rely on physical touchpoints must implement extra efforts to collect customer data.
compares a customer experience between purchasing online and through a physical store. The customer’s knowledge and identity are facilitated if digital touchpoints are being created or enhanced through the organization (López García et al., Citation2019).
Table 1. Customer’s knowledge comparison between the online and physical store (López García et al., Citation2019)
Depending on the business model, the customer information comprises different personalization levels; it is easy to imagine the knowledge that a Shared-ride app has about the customers: in addition to contact information, identity, and form of payment, it has collected all geographical coordinates from origins and destinations, AC preference (Gilibert & Ribas, Citation2019; Shaheen & Cohen, Citation2019).
2.3. Master data management
Master Data Management (MDM) enables organizations to have a customer core entity solution for data consistency, simplification, and uniformity of process, analysis, and communication across the enterprise (Erevelles et al., Citation2016; White et al., Citation2006). MDM has proved efficient in breaking data silos of a defined entity across an organization and delivering a unified customer record. However, its primary purposes have been described as Deduplicate and Regular Batch Matching for Duplicate Removal (Haneem et al., Citation2017; Oracle, Citation2015).
3. Proposed architecture for hyper-personalization experience
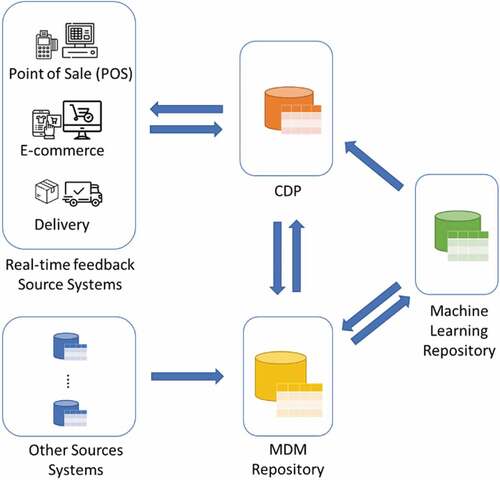
The architecture shown in is proposed to fulfill a complete customer information database. The proposed architecture comprises five blocks named Real-time feedback source systems, Other Source Systems, Master Data Management (MDM) Repository, Customer Data Platform (CDP), and Machine Learning Repository (Karanam et al., Citation2021; Richter & Wood, Citation2015), and each block is described as follows:
Real-time feedback Source Systems: three source systems selected to have real-time feedback for customer interaction- 1) Point of Sale, 2) E-commerce, and 3) Delivery. All three source systems would integrate contactability information for real-time matching- Mobile phone number and email. The flow of customer information from these source systems passes through the Customer Data Platform and then to the MDM, allowing the CDP to feed the real-time system required data.
Other Source Systems like customer data from all other source systems follow the traditional path and are connected directly to the Master Data Management system.
Master Data Management Repository contains the Customer Golden record after performing the following processes: Data Normalization, Data Cleaning, Matching, and De-duplicating processes.
Customer Data Platform: a historical version of MDM that includes all Sources Systems and is the real-time enabler between real-time source systems: 1) Point of Sale, 2) E-commerce, and 3) Delivery and the traditional MDM flow information. Through its connection with MDM, any interaction with a known customer triggers a real-time response that includes a Best Next Offer, or Best Next Action prepared for that customer in the Machine Learning Repository.
Machine Learning Repository: a repository that enables advanced matching through Customer Traceability or Contactability Information.
Figure 2. Proposed architecture to fulfill a complete customer information database (Karanam et al., Citation2021; Richter & Wood, Citation2015).
3.1. Realtime matching CDP
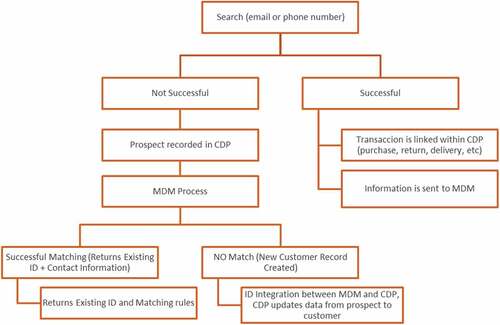
An algorithm to trigger a real-time response to customer interaction is implemented in the customer data platform. This algorithm works with a machine learning repository to successfully integrate master data management by creating new customer records and avoiding duplications (ActionIQ, Citation2021; Oracle, Citation2021). shows the proposed algorithm.
Figure 3. Real-time algorithm for creating new customer records and avoiding data duplication.
4. Architecture methodologies
Without regard to the applied business model or touchpoints, it is possible to have more significant customer participation in state A. However, the path for personalization may begin in the customer’s present status. shows the different communication efforts that can be performed in each state. When a customer is in the desired state, this does not mean to stop communicating with the customer; therefore, communication should be based on offering the best possible offer for each customer based on data mining- based on the specific preferences of each customer, in what is known as the Best Next Offer (or action) (BNO/BNA; Fabrizi & Banoub, Citation2014).
Table 2. Personalization strategies based on the customer data state (Fabrizi & Banoub, Citation2014)
States A and D enable personalized communication based on previous interactions where BNO and BNA can be achieved (Liermann & Stegmann, Citation2019; Valtonen, Citation2020). Best Next Offer and Best Next Action mean that different customers receive different content depending on their previous behavior. State B enables communication with minimal personalization derived from Identity Data. State Y promotes the simplest form of communication where no data but the contact information is known; therefore, almost all customers receive the same content.
It is crucial to have an omnichannel communication strategy that respects the number of touches for the customer at the company level. It is also fundamental to have a communication strategy that includes direct channels: email, SMS, push notification, www, app, and contact center (phone, WhatsApp, FB Messenger; Goersch, Citation2002). However, proven strategies can achieve a customer’s migration in any status to a better level.
A customer’s state determines if the company can develop active or passive communication strategies. Conditions that include Contactability (C) are enabled for active communication strategies, and State Y can be upgraded to D, B, and A, while D and B can be upgraded to A only. If the state does not include Contactability (C), the organization must wait until the next customer interaction to gather information. Strategies that upgrade a Customer Data Profile are shown in (Bolton et al., Citation2008; Wang & Hong, Citation2006) and can be described as follows:
Loyalty Program: A mechanism that allows the customer to access redemptions or levels that benefit under a system of points or visits. The loyalty program of preference must be built based on the customers’ Information in A and D to prevent losses (Rigby et al., Citation2003).
Data Quality Program: The Information about the customers must be kept constantly updated; all the contact points must seek confirmation of the information under business rules that do not create friction. The program monitors the data quality for each contact point and manages it to improve it.
Receipt Registration: a digital system through which customers who use Cash or have not used a digital channel previously are encouraged to register their receipt or folio and, in exchange, will participate in an activity or sweepstake.
Sweepstake or Digital Activation: digitalization of the sweepstakes, through which a customer registers their form of payment or digitalizes their receipts to participate in exchange for a benefit.
Digital Receipt: Process by which sending the receipt is done electronically to the Customer’s Email or Cell Phone, offering them the possibility to consult it on their digital profile.
Purchase with Home Delivery: The nature of this process means the customer is likely to give the delivery address and contact data to be constantly updated on the delivery status.
Digital Record: The digital channels offer all the information (I, C, and T), but they need to define the mandatory fields for registering a new customer.
Subscription: this medium keeps our customers close to receiving commercial, informative, and promotional Information.
Table 3. Customer migration strategies (Bolton et al., Citation2008; Wang & Hong, Citation2006)
5. Strategies application study case
5.1. The methodology
In the study case, authors analyzed migration data when hyper-personalization strategies were applied to a retail company with a client database of 15 million individuals classified in the seven states, according to . In addition, a snapshot of migration data was obtained every three months for 15 months after strategies application. All customer information is in the Master Data Management (MDM) and contains a recorded history of 5 years at this study. Before a record is kept in the MDM, a quality process is applied explicitly to each field, but all fields are set as optional to maximize the value of data gathering at each touchpoint; this sets this work apart, for it is customary that an MDM has a set of mandatory fields to be recorded in them. The database consists of 15 million customer records in the MDM, and the result of the first iteration of this methodology resulted in those records being placed in the seven states presented in and represented in Month 0. No new customer records are inputted in the data set, and all migration strategies in are put in place, so the data presented in represent the state transition due to data enrichment caused by migration strategies, current methodology, and real-time matching.
Table 4. Customer information quality level (Chuang & Lin, Citation2013)
Table 5. Customer record identification
Table 6. Customer information evaluation
Table 7. Traceability information evaluation
Table 8. Customer states evolution after strategies application
5.2. STAGE 1 completeness
This stage evaluates the completeness of a customer record and focuses on being able to Identify a customer through the set of fields. All records within the MDM were assigned a completeness level based on . This stage assesses the MDM records containing all required fields to determine a customer’s identity. While the MDM of this specific institution accepts null values for any given area, in this process, a mandatory or optional attribute is assigned to each field.
5.3. STAGE 2 matching
In order to determine the uniqueness of a customer record, it has to go through a process that evaluates if the record contains enough identity elements. According to , records with Quality Levels 1, 2, and 3 are assigned an Entity Level. This process matches records with the desired quality within the MDM, identifying which records are unique, which ones will have to go through a merge/unification process, and flags all records in which it is impossible to determine the unique identity of a customer (namesake). All Entity Level 3 results remain in this stage.
5.4. STAGE 3 merge
If two or more records correspond to a unique customer, these records must be merged and receive the same customer ID. Records with Entity Levels 1 and 2 go through a match and combine process to deliver a unique customer ID. Every customer record that is an output of this stage is guaranteed to have the Identity data type.
5.5. STAGE 4 evaluating contactability
Once identity has been determined through previous stages, this stage focuses on establishing the completeness of contactability information. All records assigned a unique customer ID are then evaluated on contact information according to . All contact levels excluding Level 5 guarantee the record to have the Contactability data type. All data from Step 1 with Quality Level 4 containing contact information fall under the anonymous but contactable category.
5.5. STAGE 5 evaluating traceability
This stage focuses on linking transactional information to customer IDs, enabling traditional transaction records to be assigned to a customer. Transactional sources include purchases, deliveries, contact center, wedding registry, e-commerce, app, credit card, curve-side pickup, tailoring, etc. All records assigned a unique customer ID are then given a Traceability Level based on . All other transactions that do not reach a Traceability Level remain anonymous.
5.6. STAGE 6 mapping the identity, contactability and traceability framework
This stage then assigned all records within States A, B, C, D, X, Y, Z shown in , enabling understanding customer records’ current identity, contactability, and traceability maturity.
5.7. STAGE 7 design and execute strategies
Once all records are within a State shown in , Strategies are designed and executed to help enhance customer information in the MDM. Eight actions were applied at the studied company following the hyper-personalization path, each stage was used at a time, and migration data were analyzed to define the customer state seen in modification ; the applied actions and the results on the customer state are presented in .
Table 9. Strategies contribution to the increased participation percentage
After a record has been placed under one of the seven states and subjected to data enhancement from migration strategies, its transitions can be observed in for 15 months. The participation of each state is then recorded every three months. From month 0 to month 3, significant shifts occur in State Z, X, D, and A, almost eliminating only Identifiable records in state Z. For Month 3 to 6, 6 to 9, 9 to 12, and 12 to 15, the transition occurs from state X to state A.
Since all eight migration strategies are put in place simultaneously, it is essential to record those with a significant impact on the record transition. State A is the desired state, and a detail of the migration strategies that helped increase State A participation from 16.53% to 31.37% are detailed in .
The behavior of the customer migration from different states to A state is presented in . When migration strategies are implemented, customer contactability increases with an exponential-like behavior. An exponential saturation equation (EquationEq. 1)(1)
(1) was proposed to model the increment on customers in state A to learn the possible limit of customer migration.
Figure 4. Customer evolution after migration strategies have been implemented; symbols represent the experimental data squares state A, solid line is the best fit to an exponential equation of the experimental data. The dotted line represents saturation values for the corresponding equation.
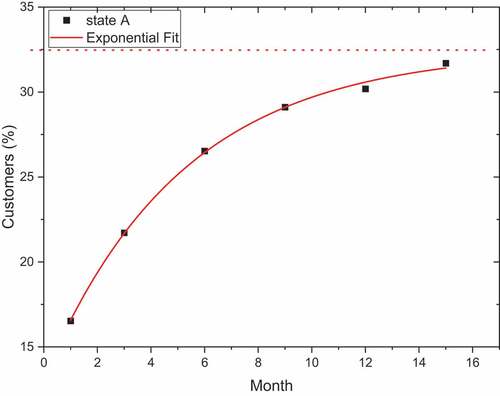
In the proposed model, A represents the saturation value, which means the maximum percentage of customers that can be attracted to the A state, is a time constant (in months) that regulates the customer migration to the A state. When data coming from the study case, Equationequation 1
(1)
(1) takes values expressed at EquationEquation 2
(2)
(2)
The proposed equation has a 0.99 R-square value indicating a substantial agreement with the proposed model. The model tends to a saturation value of 32.46%; therefore, it can be said that no more customers can be attracted after this value has been reached while implementing the same strategies over time.
6. Discussion
Personalization strategies depend on organizations’ capabilities of delivering personalized actions to their customers through an omnichannel system; most studies go in-depth into which capabilities must be present to implement a personalization strategy. The other key element to deliver a personalized approach is the set of known customers (I, C, T), which methods increase such customer sets and provide a framework to migrate customers’ information to the desired state A.
The proposed methodology allows the migration of customer information from incomplete states to a fully identifiable customer; each methodology block helps in the migration strategy. MDMs can be used to complete information and avoid duplicity by continuous update and batch matching for deduplication (DoHaneem et al., Citation2017; Ng et al., Citation2017)- MDM deduplication helps in enhancing the customer database behavior (Ng et al., Citation2017).
Touchpoints enable organizations to deliver personalized service; however, the customer must be identified before a customized service can be provided. This work implemented customer identification in physical touchpoints by requesting Email or Mobile- contactability information and deliberately excluded other customer identification data such as the customers’ name and last name. If such information matches with the CDP, a personalized action can occur while updating a State A; if not, a prospect is created that contains a mean for customer contact that achieves a State D or Y.
Matching real-time allows increasing the identifiable customer’s database through physical and digital channel integration, enhancing customer identification. Finally, establishing a data migration framework will enable organizations to develop migration strategies to the desired state and is key to the hyper-personalization strategies development.
In the study case, the initial mapping result reflected that State X contained more than half of the records while State A participated only 16.53%. As seen in , there is a significant upgrade from state X to State D and State A within three months.
After 15 months, States A and D together have total participation of 57.77%; these states enable advanced communications based on customer knowledge such as BNA and BNO, State X decreased 54.29% to 36.82%. Although the proposed model in EquationEquation 2(2)
(2) can accurately describe the studied company behavior, this model is valid in short time-lapses and changes according to the company conditions; therefore, the proposed model can explain the customer evolution for a limited advanced time.
While the model expects state A saturation at 32.46%, new migration strategies could deliver a new curve. During the 15 months of data observation, the sales channel participation remained at the same levels; if the digital sales channels increase their participation, this could also deliver a new curve. This methodology can be used for different industries other than retail and to various international markets where the fields required for determining a customer ID are needed; the detail of migration strategies would have to reflect the nature of the industry, many of the ones presented here have multi-industry purposes: Loyalty program, data quality program, sweepstake or digital activation, digital record and subscription requirements.
For this methodology to work, the existence of an MDM within the organization is required, and it is necessary to apply quality rules to the fields previously.
Marketing implications
States A and D enable the organization to communicate personally with their customers activating one or various personalization initiatives. Enabling personalization requires customer data and marketing technologies such as Campaign management, audience management, customer analytics platforms.
When measuring initiatives by the Return on Investment (ROI), product offerings and recommendations, in-person customer experience, online customer experience, and pricing strategies are already delivering a better ROI than social media that organizations currently render, it has been seen that none is more significant than 40%. Therefore, the ROI increase of these initiatives is expected to grow in the following years, and more adequate initiatives to leverage personalized information are expected to deliver more significant ROIs, as shown in .
Table 10. Return of investment on personalization initiatives adapted from (The age of personalization, crafting a finer edge, Citation2018)
Demonstrating the effectiveness of personalized initiatives and their progression in time will make institutions shift resources and budgets to more effective and measurable marketing initiatives.
7. conclusions
Personalization strategies help deliver personalized actions to customers and help increase the number of known customers by the organization. This cycle enables the organization to implement and robust its personalization strategies and establish means to migrate customers from poor information states to complete information states.
All migration strategies are intended to complete and upgrade to the original State of Information that an organization already has. Currently, most organizations plan to migrate to State A, which contains the intersection of Identity, Contactability, and Traceability (I, C, T). However, let it be noted that certain conditions are not attributed to the migration strategies that impede certain records from upgrading (invalid data, Identity data error, homonyms, among others). State X, which contains anonymous transactions, contributed more records to the complete State A’s transition.
Real-time matching helps deliver personalized experiences and adds prospects to the customer database with an initial state D, which is why the D state increases from 16.96% to 26.40%. It is imperative to note that the main migration path is X state to D state to A state.
The mobile or email request in physical touchpoints increased states Y and D; one of the data issues faced when managing mobile as customer identifier is that sometimes various customers can share such information within their accounts. In our experiment, 0.58% of customers shared a mobile number. A similar issue was found with email as a customer identifier, and it was found that 8.7% of all customers had more than one account, each with a different email.
While conducting this study, all digitalization strategies were implemented simultaneously. This study fails to address the impact, peak, and limit of each digitalization strategy running by itself. This might be because the corporation implemented a digitalization program that contained all eight digitalization strategies for a unified implementation to reduce costs and resource allocation. Therefore, the implementation of each digitalization strategy should run independently in future studies.
Disclosure statement
No potential conflict of interest was reported by the author(s).
Data availability statement
The datasets analyzed during the current study are not publicly available because the customer’s identity can be revealed from data analysis but are available from the corresponding author on reasonable request.
Additional information
Funding
Notes on contributors

J. M. Valdez Mendia
J. M. Valdez Mendia is a digital transformation executive that centers his research in customer centric data driven initiatives.
J. J. A. Flores-Cuautle
J. J. A. Flores-Cuautle is a Research fellow of the Mexican National Science and Research Council; his research interests include data analysis and processing.
References
- ActionIQ. (2021). What is a customer data platform (CDP)? Retrieved November 29, 2021 from https://www.actioniq.com/what-is-cdp/
- The age of personalization crafting a finer edge. (2018). H. b. review. https://hbr.org/resources/pdfs/comm/mastercard/TheAgeOfPersonalization.pdf
- Anderson, E. R. (2009). Next-generation campaign management: How campaign management will evolve to enable interactive marketing. Journal of Direct, Data and Digital Marketing Practice, 10(3), 272–16. https://doi.org/10.1057/dddmp.2008.46
- Andreassen, T. W., Lervik-Olsen, L., Snyder, H., Van Riel, A. C. R., Sweeney, J. C., & Van Vaerenbergh, Y. (2018). Business model innovation and value-creation: The triadic way. Journal of Service Management, 29(5), 883–906. https://doi.org/10.1108/JOSM-05-2018-0125
- Bleier, A., & Eisenbeiss, M. (2015). Personalized online advertising effectiveness: The interplay of what, when, and where. Marketing Science, 34(5), 669–688. https://doi.org/10.1287/mksc.2015.0930
- Bolton, R. N., Lemon, K. N., & Verhoef, P. C. (2008). Expanding business-to-business customer relationships: Modeling the customer’s upgrade decision. Journal of Marketing, 72(1), 46–64. https://doi.org/10.1509/jmkg.72.1.046
- Boudet, J., Gregg, B., Heller, J., & Tufft, C. (2017). The heartbeat of modern marketing: Data activation and personalization. McKinsey & Company 201711–2. Retrieved June 15,2021 from https://www.mckinsey.com/business-functions/marketing-and-sales/our-insights/the-heartbeat-of-modern-marketing
- Chuang, S.-H., & Lin, H.-N. (2013). The roles of infrastructure capability and customer orientation in enhancing customer-information quality in CRM systems: Empirical evidence from Taiwan. International Journal of Information Management, 33(2), 271–281. https://doi.org/10.1016/j.ijinfomgt.2012.12.003
- Ducange, P., Pecori, R., & Mezzina, P. (2018). A glimpse on big data analytics in the framework of marketing strategies. Soft Computing, 22(1), 325–342. https://doi.org/10.1007/s00500-017-2536-4
- Erevelles, S., Fukawa, N., & Swayne, L. (2016). Big data consumer analytics and the transformation of marketing. Journal of Business Research, 69(2), 897–904. https://doi.org/10.1016/j.jbusres.2015.07.001
- Fabrizi, A., & Banoub, T. (2014). Next Best Offer: how to re-think your marketingHewlett-Packard Development Compay. Hewlett-Packard. http://andreafabrizi.org/wp-content/uploads/2018/09/4AA4-TBDA-ENN-Next-Best-Offer-LONG.pdf
- Gilibert, M., & Ribas, I. (2019). Synergies between app-based car-related shared mobility services for the development of more profitable business models [Shared transport services, car sharing, ride hailing, ride sharing, business model]. Journal of Industrial Engineering and Management, 12(3), 16. https://doi.org/10.3926/jiem.2930
- Goersch, D. (2002). Multi-channel integration and its implications for retail web sites. ECIS 2002 Proceedings, Poland: AIS eLibrary.
- Haneem, F., Ali, R., Kama, N., & Basri, S. (2017, 16-17 July 2017). Resolving data duplication, inaccuracy and inconsistency issues using master data management. 2017 International Conference on Research and Innovation in Information Systems (ICRIIS), Malaysia: IEEE.
- Hess, N. J., Kelley, C. M., Scott, M. L., Mende, M., & Schumann, J. H. (2020). Getting personal in public!? How consumers respond to public personalized advertising in retail stores. Journal of Retailing, 96(3), 344–361. https://doi.org/10.1016/j.jretai.2019.11.005
- Imhoff, C., Loftis, L., & Geiger, J. G. (2001). Building the customer-centric enterprise: data warehousing techniques for supporting customer relationship management. Wiley. https://books.google.com.mx/books?id=b8UBFbBDAq0C
- Jain, G., Paul, J., & Shrivastava, A. (2021). Hyper-personalization, co-creation, digital clienteling and transformation. Journal of Business Research, 124(1), 12–23. https://doi.org/10.1016/j.jbusres.2020.11.034
- Jain, G., Rakesh, S., Kamalun Nabi, M., & Chaturvedi, K. R. (2018). Hyper-personalization – Fashion sustainability through digital clienteling. Research Journal of Textile and Apparel, 22(4), 320–334. https://doi.org/10.1108/RJTA-02-2018-0017
- Kalia, P., & Paul, J. (2021). E-service quality and e-retailers: Attribute-based multi-dimensional scaling. Computers in Human Behavior, 115(1), 106608. https://doi.org/10.1016/j.chb.2020.106608
- Karanam, S. D., Kamath, R. S., Kulkarni, R. V. R., & Pai, B. H. S. K. (2021). Big data integration solutions in organizations: A domain-specific analysis. In Santhosh Kumar, B. (Ed.), Data Integrity and Quality (pp. 1–31). IntechOpen.
- Kurniawan, F., Umayah, B., Hammad, J., Nugroho, S. M. S., & Hariadi, M. (2017). Market basket analysis to identify customer behaviours by way of transaction data. Knowledge Engineering and Data Science, 1(1), 6. https://doi.org/10.17977/um018v1i12018p20-25
- Liermann, V., & Stegmann, C. (2019). The impact of digital transformation and fintech on the finance professional. Springer International Publishing. https://books.google.com.mx/books?id=rZGzDwAAQBAJ
- López García, J. J., Lizcano, D., Ramos, C. M., & Matos, N. (2019). Digital marketing actions that achieve a better attraction and loyalty of users: An analytical study. Future Internet, 11(6), 130. https://doi.org/10.3390/fi11060130
- Low, G. S. (2000). Correlates of integrated marketing communications. Journal of Advertising Research, 40(3), 27–39. https://doi.org/10.2501/JAR-40-3-27-39
- Mallya, H., & Nair, A. (2016). The future of Indian e-commerce lies on the app route. YourStory Media. Retrieved June 26, 2021, from https://yourstory.com/2016/03/indian-e_commerce-future-apps/amp
- Micu, A., Capatina, A., Cristea, D. S., Munteanu, D., Micu, A.-E., & Sarpe, D. A. (2022). Assessing an on-site customer profiling and hyper-personalization system prototype based on a deep learning approach. Technological Forecasting and Social Change, 174(1), 121289. https://doi.org/10.1016/j.techfore.2021.121289
- Narayanan, A., & Shmatikov, V. (2010). Myths and fallacies of “Personally identifiable information”. Commun. ACM, 53(6), 24–26. https://doi.org/10.1145/1743546.1743558
- Ng, S. T., Xu, F. J., Yang, Y., & Lu, M. (2017). A master data management solution to unlock the value of big infrastructure data for smart, sustainable and resilient city planning. Procedia Engineering, 196(1), 939–947. https://doi.org/10.1016/j.proeng.2017.08.034
- Ngoc Thang, N., Anh Tuan, P., & Moses, Y. (2020). Knowledge acquisition, knowledge management strategy and innovation: An empirical study of Vietnamese firms. Cogent Business & Management, 7(1), 1786314. https://doi.org/10.1080/23311975.2020.1786314
- Nobile, T. H., & Kalbaska, N. (2020). An Exploration of Personalization in Digital Communication. Insights in Fashion. In F. F.-H. Nah, & K. Siau (Ed.), HCI in Business. Government and Organizations Cham. https://doi.org/10.1007/978-3-030-50341-3_35
- Oracle, C. (2015). Customer Data Services Pack Guide for Enterprise Data Quality. Oracle Corporation. Retrieved June 15, 2021 ,from https://docs.oracle.com/middleware/1221/edq/instsis/matching.htm#CDSIS212
- Oracle, C. (2021). What is data management? Retrieved November 29, 2021 from https://www.oracle.com/database/what-is-data-management/
- Paulina. (2017). 1st, 2nd and 3rd party data – what it all means? Adsquare, 2017(1), 01. https://www.adsquare.com/1st-2nd-and-3rd-party-data-what-it-all-means/
- Rekettye, G., & Rekettye, J. G. (2019). The effects of digitalization on customer experience. Proceedings of the ENTRENOVA - ENTerprise REsearch InNOVAtion Conference, 5(1), 340–346. https://hrcak.srce.hr/ojs/index.php/entrenova/article/view/13774
- Richter, A., & Wood, J. (2015). Practical Deployment of Cisco Identity Services Engine (ISE): Real-World Examples of AAA Deployments. Elsevier Science. https://books.google.com.mx/books?id=IfQqCgAAQBAJ
- Rigby, D., Reichheld, F., & Dawson, C. (2003). Winning customer loyalty is the key to a winning CRM strategy. IVEY Business Journal, 2003(1) , 5. https://iveybusinessjournal.com/publication/winning-customer-loyalty-is-the-key-to-a-winning-crm-strategy/
- Shaheen, S., & Cohen, A. (2019). Shared ride services in North America: Definitions, impacts, and the future of pooling. Transport Reviews, 39(4), 427–442. https://doi.org/10.1080/01441647.2018.1497728
- Straker, K., & Wrigley, C. (2018). Engaging passengers across digital channels: An international study of 100 airports. Journal of Hospitality and Tourism Management, 34(1), 82–92. https://doi.org/10.1016/j.jhtm.2018.01.001
- Valtonen, A. (2020). Applying machine learning to marketing: Implementation and management of a next best offer recommendation model in the financial industry. Jyväskylä University. https://jyx.jyu.fi/handle/123456789/68608
- Wang, H.-F., & Hong, W.-K. (2006). Managing customer profitability in a competitive market by continuous data mining. Industrial Marketing Management, 35(6), 715–723. https://doi.org/10.1016/j.indmarman.2005.06.005
- White, A., Newman, D., Logan, D., & Radcliffe, J. (2006). Mastering master data management. G. Inc.
- Wirtz, B. W. (2019). Digital business models: Concepts, models, and the alphabet case study. Springer International Publishing. https://books.google.com.mx/books?id=5wKQDwAAQBAJ
- Wolny, J., & Charoensuksai, N. (2014). Mapping customer journeys in multichannel decision-making. Journal of Direct, Data and Digital Marketing Practice, 15(4), 317–326. https://doi.org/10.1057/dddmp.2014.24
- Won, K. (2002). Personalization: Definition, status, and challenges ahead. Journal of Object Technology, 1(1), 29–40. https://doi.org/10.5381/jot.2002.1.1.c3