
Abstract
This study aims to assess the dimension and quality of the compassionate leadership measurement model (CLMM) using partial least square–confirmatory composite analysis. The Compassionate Leadership Questionnaire (CLQ) derived from the Compassionate Rationalism Leadership Questionnaire (CRLQ) was used to develop this model. Data were collected from 482 employees of the Rubber Authority of Thailand who completed the CLQ online and were randomly divided into two groups. The first and second groups comprise of 270 and 212 respondents for exploring the dimensions of the model and for confirming the model, respectively. The study investigated the dimensions, indicator loading, and reliability, convergent, discriminant, and nomological validity of the CLMM in the Thai context. The CLMM contains only 19 items out of a total of 27, and it employed dimensions that differed from the original model. The CLMM consists of three dimensions, namely, altruistic cooperation, empathy and humility, and trust-based empowerment. All items in the final CLMM displayed extremely high indicator loadings, which are ranked from acceptable to excellent. The findings suggest that the use of CLMM in the Thai context displayed adequate levels of convergent and discriminant validity and revealed a strong correlation between the CLMM and empathic leadership, which indicated that the CLMM achieved nomological validity. The current study provided substantial evidence regarding the high quality of the CLMM through confirmatory composite analysis.
1. Introduction
Scholars have extensively examined and explained the advantages of organizations that exhibit compassionate leadership. The benefits of compassionate leadership, that is, leaders who commit compassionate actions and leaders who exhibit and engage in acts of true compassion (; Goetz et al., Citation2010; Lilius et al., Citation2011), are helping to sustain employees through difficult situations and to facilitate fast recovery (Lilius et al., Citation2011). Furthermore, it can improve the engagement and retention of employees (Fryer, Citation2013; Lilius et al., Citation2011) and expose them to positive emotions such as increased productivity (Lilius et al., Citation2011), improved health (Fredrickson, Citation2000; Gross, Citation1994), and better delivery of customer service (Figley, Citation1995; Goetz et al., Citation2010).
Compassionate leadership realizes that one must prioritize care for oneself to be able to care for others (Lama et al., Citation2016). The ability to connect with others and accept their imperfections is important for compassionate leadership, which helps leaders understand why others require more than positive words and goodwill. These attributes mark the difference between compassionate leadership and other styles of leadership. Therefore, it becomes a tool for the pursuit of the superiority of individuals, respect of duty, and creation of value for stakeholders (Shuck et al., Citation2016).
Although compassionate leadership is important to social and corporate settings, only a few measurements exist, where only one study conducted across various countries worldwide presented the most objective tool for the assessment of compassionate leadership. Choi et al. (Citation2017) conducted a review on compassion-related studies and conducted focus group interviews with experts on leadership. Data were used to produce an instrument named Compassionate Rationalism Leadership Questionnaire (CRLQ) for measuring compassionate leadership.
Choi et al. (Citation2017) used exploratory and confirmatory factor analyses (EFA and CFA) based on covariance-based structure equation modeling (CB-SEM) to confirm the factor structure. Moreover, this measurement model used principal component analysis (PCA) and varimax axis rotation; however, PCA and orthogonal rotation are not ideal for the analysis of factor structure. The reasons underlying this notion is that PCA uses variables to create factors (Tabachnick et al., Citation2007), and orthogonal rotations may not correspond to variables and theory because individual components are likely to be related. Thus, the more suitable technique is factor analysis and oblique rotation to examine factors that underlie variable relationships (Costello & Osborne, Citation2005). However, the study of Choi et al. (Citation2017) lack important information such as average variance extracted, composite reliability (CR), discriminant validity, and nomological validity. Therefore, the current study adopted confirmatory composite analysis based on partial least square structural equation modeling (PLS-SEM) to revise the previous model.
A literature research demonstrated that international and Thai knowledge about the measurement of compassionate leadership is limited. Thus, the current study aims to explore the dimensions and quality of the CLMM in the Thai context. Developing a measurement model of compassionate leadership with alternative and relevant analytical methodologies is vital for building and expanding information and theory in contexts associated with the factor structure of compassionate leadership and tools for organizational development.
2. Literature review
2.1. Compassionate leadership and other leadership theories
The theories of leader–member exchange (LMX) and servant leadership will be examined, both of which are linked with compassionate leadership.
LMX shows how leaders and followers build relationships at work by going above and beyond what is expected of them. Followers perform duties outside of their roles, while leaders provide followers with more freedom and independence (Geertshuis et al., Citation2015). For this bond to happen, compassion must play a part, but at its core LMX is still an exchange, even if it is not a monetary one. Followers do more than what is required by the work contract, and leaders give rewards that are not part of the work contract. The focus of compassionate leadership, on the other hand, is not on an exchange. Leaders with compassion care about their followers no matter what they do at work. Compassionate and servant leaders know that their employees’ emotional needs must be taken into account and met, but the theories are different in important ways. Servant leadership was created as an ethical framework, and it still is. It says how leaders should treat the people who follow them (Mikkelson et al., Citation2019). Compassionate leadership is more about how leaders act than servant leadership, which is more about how a leader should act to reach a certain goal (Parris & Peachey, Citation2013). As with LMX, compassionate leadership employs a more dyadic approach than servant leadership. While servant leadership permits variety in how a leader satisfies the demands of followers, it nonetheless labels leaders as either servants or non-servants (Kock et al., Citation2019).
2.2. Measurement model of compassionate leadership
Choi et al. (Citation2017) developed a scale for compassionate leadership as part of the CRLQ with a two-step analysis, namely, EFA and CFA. Choi et al. recruited 738 participants whose responses were retrieved from online and offline surveys that targeted adults aged more than 20 years old. Afterward, unreliable responses were excluded, and the final 692 responses were used for analysis. Choi et al. found that the model for compassionate leadership consists of four dimensions, namely, trust-based empowerment (seven items; reliability: 0.864), empathic consideration (five items; reliability: 0.823), tolerant humility (six items; reliability: 0.795), and altruistic cooperation (nine items; reliability: of .891). The overall reliability reached 0.934 for a total of 27 questions. However, the results may differ and be more consistent in the Thai Buddhist society and public service context when analyzed with a different EFA and CCA approach compared to the CRLQ model.
Choi et al. (Citation2017) defined trust-based empowerment as a relationship based on truth and trust, which provides employees with opportunities and justifications to feel accomplished. Leaders should evaluate employees conditions by putting themselves in the place of employees to demonstrate empathetic consideration. Moreover, leaders who exhibit tolerant humility and respect for diverse viewpoints can enhance trust-based empowerment. Altruistic cooperation is illustrated as leaders perform selfless acts for others, provide members with support for their needs, and lead by being a role model.
2.3. Confirmatory composite analysis
Due to the weak performance of the common factor model testing (Henseler et al., Citation2014), researchers sought for alternatives to latent variables. Rigdon (Citation2012) remarked that research in statistics and psychometrics challenges the factor-centric worldview, whereas Rhemtulla et al. (Citation2020) advocated for the investigation of opportunities presented by confirmatory composite analysis (CCA).
The measurement model was identified as a composite, and this terminology was introduced in partial least square (PLS; Henseler et al., Citation2014). Henseler et al. (Citation2014) proposed that the CCA is a process of confirming the measurement model in PLS-SEM, and Sarstedt et al. (Citation2016) published articles that widely referred to the term composites. These studies found that approximate covariance-based structure equation modeling and PLS-SEM component structures were representative of the theoretical structure.
To achieve the objective of confirming a measurement model for developing or deploying multi-item measures, researchers can use CFA or CCA (Hair et al., Citation2020). Both techniques can be used to improve the reliability of questions; however, CCA displays certain advantages over CFA (e.g., the number of questions stored to measure the structure of a variable is greater than that using CFA), which helps improve content coverage and structural accuracy (Rigdon et al., Citation2019). Moreover, CCA can be applied to the formative measurement model (Hair et al., Citation2020). In addition, the goodness-of-fit (GOF) index is indispensable for CFA in verifying model validity. However, this index is not required for CCA because it may reduce the predictive power of CCA (Hair et al., Citation2017; Lohmöller, Citation1989; Vigoda-Gadot & Beeri, Citation2012).
3. Methodology
3.1. Participants
Using a small sample size, PLS-SEM can be utilized in the case where the population factor is appropriated (Rigdon, Citation2016) and follows the “rule of 10” used in SEM. According to certain authors (Barclay et al., Citation1995; Chin, Citation1998), approximately 10 examples per measured variable are required for the largest latent factor block. Choi et al. (Citation2017) recruited minimum approximately 90 participants for CCA because it used nine indicators for altruistic cooperation. Where a 10:1 ratio is acceptable for EFA (Hair et al., Citation2019). Therefore, the sample size of the current study should be approximately 270 for 27 variables. This study targeted employees of the Rubber Authority of Thailand, whose number of employees meets the minimum requirement. As the Rubber Authority of Thailand is a public service organization, it is appropriate to study compassionate leadership in accordance with the United Nations’ approach to public service. The employees were firstly classified into regional units using stratified random sampling followed by simple random sampling to select employees from 100 divisions.
The data were collected using Google Forms; the survey was distributed in quick response code format via an email to the participants. Participants were required to complete the survey by themselves. There were 482 responders in all. The samples were split into two groups at random: 270 for EFA and 212 for CCA.
3.2. Research instruments
To measure compassionate leadership, the study used the Compassionate Leadership Questionnaire (CLQ) from the CRLQ (Choi et al., Citation2017). The tool presents 27 questions and is composed of four 4 subconstructs, namely, trust-based empowerment (seven items), empathic consideration (five items), tolerant humility, (six items), and altruistic cooperation (nine items). The items were rated using a five-point Likert-type scale (1 = strongly disagree; 5 = strongly agree). The CL:Q displayed a high level of reliability at .934, where the four subconstructs produced satisfactory and high levels of reliability ranging from .795 to .891.
Empathic leadership was measured to examine nomological validity because previous studies proposed that the definition and theory of empathic leadership and compassion leadership are correlated (Kock et al., Citation2019). The questionnaire for empathic leadership was adapted from the Empathetic Leadership Scale (Kock et al., Citation2019). This measurement focused on how leaders exhibit emotional support for and understanding of their followers. The questionnaire consisted of three items rated using a five-point Likert-type scale (1 = strongly disagree; 5 = strongly agree; Cronbach’s alpha coefficient: 0.782).
3.3. Data analysis
The study used the following steps for data analysis:
Step 1: Examination of the dimensions
EFA was used to examine the dimensions of the measurement model for compassionate leadership using an approach that differed from that of Choi et al. (Citation2017). The current study used a subconstruct of the measurement model to determine the number of dimensions. A common factor with a principal factor axis extraction and promax rotation were conducted to identify an inherent structure between variables. For the number of factors retained, we consider retaining all factors with eigenvalues greater than 1.0 (Kaiser, Citation1974) and performing parallel analysis (Cattell, Citation1966).
Step 2: Confirmation of the quality of CLMM
Hair et al. (Citation2020) evaluated the measurement model in PLS-SEM with CCA using seven steps. The current study adjusted this method by using six steps, because the seventh step refers to predictive validity, where data for this criterion variable were collected at a later time. However, this study is cross-sectional in nature that it collected data only once at the same time, which rendered it unsuitable for predictive validity analysis. The six steps included examining indicator loadings, indicator reliability, CR, convergent validity, discriminant validity, and nomological validity. The process for measuring nomological validity was intended to correlate the score of each construct with one or more constructs in a nomological network. Moreover, the study used empathic leadership as another variable. According to the theory, if two variables are related (Kock et al., Citation2019) by displaying a statistically significant correlation, then nomological validity is achieved.
R software with psych package v. 2.2.3 was used for EFA, and ADANCO v. 2.3 was used for CCA testing.
4. Result and discussion
4.1. Results
Demographic factors
This section provides a summary of the demographic characteristics of 482 respondents by using frequency and percentages. Table displays the gender, age, level of education, and work experience of Rubber Authority of Thailand employees. The table revealed that 52.28 percent of the sample consisted of females (252 participants), while 47.7 percent were males (230 participants), with 74.48% (359 participants) of the participants between the ages of 24 and 41, as shown in Table . This was followed by the participants between the ages of 42 and 56, who made up 22.48% of the sample (108 participants) and 3.11% of the population which comprised people aged 56 and older (15 participants). The educational level demographic data revealed that 71.16% of respondents held a bachelor’s degree (343 participants). While 28.84% of respondents had a graduate degree or higher (139 participants). The final piece of demographic information was work experience, with 66.39% (320 participants) in the group with work experience between 5 and 10 years, followed by work experience greater than 10 years with 33.64% (162 participants).
Table 1. Summary analysis of the demographic features using frequency and percentage
Step 1: dimensions of CLMM
In this step, the study used 270 samples for EFA to identify the dimensions; Table presents the results. The Kaiser–Meyer–Olkin (KMO) measurement and Bartlett’s test of sphericity were performed to verify the validity and GOF of the item configuration on a subconstruct of the CLMM. The KMO measurement was used to investigate partial correlation between variables and to test the adequacy of the samples, which indicated whether the number of factors and data used in factor analysis were appropriate. The KMO value of the CLMM was 0.967; the Chi-square approximation value of Bartlett’s test of sphericity was significant at 8498.749 (df = 351, p < .001). Therefore, the item setting for factor analysis was appropriate.
Table 2. Result of exploratory factor analysis of dimensions
The study used the criteria presented by Choi et al. (Citation2017) as the questions produced factor loadings less than 0.40, and questions with cross-loading with other variables were preferentially omitted from the constructs. Eigenvalues greater than 1.0 were generally considered necessary for practical significance (Hair et al., Citation2019). Along with the eigenvalue, the study conducted parallel analysis to determine the number of dimensions, which is widely accepted as an accurate method (Velicer & Jackson, Citation1990). Based on the eigenvalues and parallel analysis, the results indicated that the three factors (or dimensions) were appropriate for the dataset. Furthermore, the GOF indexes exhibited a consistent result, that is, the three factors were suitable for the empirical data (RMSEA = 0.04, TLI = 0.901, SRMR = 0.069, Chi-square = 258.60, and p = .73), where the three factors can explain 55% of variance. The first factor was altruistic cooperation, which consisted of nine questions and whose factor loadings ranged from 0.513 to 0.855. The second factor, namely, empathy and humility, was a combination of empathic consideration and tolerant humility and consisted of nine questions with factor loadings ranging from 0.414 to 0.760. The third factor was trust-based empowerment, which consisted of six questions with factor loadings ranging from 0.457 to 0.856. However, each question was considered for theoretical concordance. Consequently, items THT1, THT5, and EBT10 were excluded from the model. Finally, the items were reduced from 27 to 22 prior to CCA testing.
Step 2: The quality of measurement model
CCA was used to confirm the quality of the measurement model using 212 samples. The results of analysis were as follows.
(1) The majority of the items achieved loadings higher than 0.708 (Hair et al., Citation2020), and all of them were statistically significant, except for ACP1 and EMC4 with loadings of .640 and .690, respectively; hence, both items were excluded from the measurement model.
(2) Indicator reliability was calculated using the amount of variance shared between individual indicator variables and their associated constructs (Hair et al., Citation2020) by squaring the individual indicator loadings. The loading of the indicator should be higher than 0.708 to render its squared greater than 0.500. After excluding items ACP1 and EMC4 from analysis, the study found no loadings below the threshold.
(3) Given Jöreskog’s rho (ρc), the study infers that ρc was the most popular value for determining CR in SEM, with a value of 0.7 or higher. As previously mentioned, the study considered internal consistency on the basis of Cronbach’s alpha coefficient (α; Cronbach, Citation1951), where each dimension should reach alpha coefficient of at least 0.7 (Nunnally, Citation1994) and should not exceed 0.95 (Hair et al., Citation2020). The results of the CR assessment demonstrated that the ρc exhibited high CR at 0.904, 0.927, and 0.928 for trust-based empowerment, empathy and humility, and altruistic cooperation, respectively. The alpha coefficient values of the three dimensions were high, which ranged from 0.873 to 0.911 and indicated high reliability.
(4) Convergent validity was measured using extracted average variance (AVE). This value should be 0.5 or higher (Fornell & Larcker, Citation1981). The results indicated that the AVEs ranged from 0.606 to 0.650 per dimension, which suggested convergent validity.
(5) AVE is a common method for testing discriminant validity (Anderson & Gerbing, Citation1988), which follows the Fornell–Larcker criterion (Fornell & Larcker, Citation1981) and comparing AVE values with squared correlations among dimensions (Table ). To indicate discriminant validity, each dimension should be able to measure characteristics independently of the others, and AVE values(diagonally) must be higher than the square correlations between dimensions (diagonally below).
Table 3. Average variance extracted (diagonal line) and square correlation between dimensions (off-diagonal)
(6) Nomological validity
The study looked at the correlation coefficients between the dimensions of compassionate leadership and the main construct (CL) and between CL and empathic leadership (EL) to figure out the nomological validity. The results of correlation analysis of the dimensions of the CLMM and constructs of EL were positively correlated, which ranged from 0.689 to 0.762 (p < .001) and indicates nomological validity. Furthermore, correlation between the main construct (CL) and EL reached 0.804 (t = 27.284, p < .001), which implied that the CLMM achieved nomological validity and could explain 64.66% of EL variation. In summary, the CLMM met the criteria for nomological validity (Table ; Figure ).
Figure 1. Final measurement model of compassionate leadership.
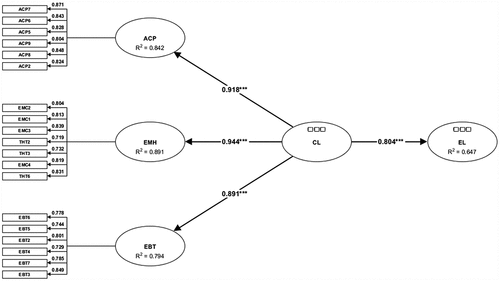
Table 4. Interconstruct correlations for nomological validity assessment
The final model of the CLMM, contains only 19 items out of a total of 27 items with three dimensions.
4.2 Discussion
This study evaluated the psychometric properties of the CLMM. Analysis consisted of two main steps. The first was to check the dimension of the measurement model using EFA. The second was to confirm the quality of the measurement model using CCA. The final model of the CLMM, which was constructed using two steps, retained 19 out of the original 27 items with three dimensions.
Dimensions of CLMM
To evaluate the dimensions of the CLMM, the authors employed EFA with principal axis factoring to extract factors, determined the number of factors using eigenvalues and parallel analysis, and utilized the promax method for an oblique rotation. EFA revealed three dimensions under compassionate leadership, namely, altruistic cooperation, empathy and humility, and trust-based empowerment. The CLMM developed in the step retained 22 out of 27 items.
Differences in dimensions and number of items were noted when comparing the proposed model and the original model of Choi et al. (Citation2017). The results indicated that compassionate leadership in the Thai social context displayed the dimensions of empathic consideration and tolerant humility, which were merged into one dimension, whereas trust-based empowerment and altruistic cooperation remained separate, which is similar to that of the model of Choi et al. Based on the Buddhism environment alongside with the Thai community, compassion pertains to a deep understanding of the emotional state of another and may lead to the feeling of empathy for another person (Goleman, Citation2003). Therefore, combining the two dimensions into one is possible.
The study proposes that the definition of the trust-based empowerment could be utilized similar to that of the definition of Choi et al. (Citation2017) however, humility needed to be slightly redefined as “having reflective viewpoints on self-thoughts and behaviors; looking back or reflecting on themselves and listening to the diverse perspectives of people; and positively accept their opinions.”
Choi et al. (Citation2017) evaluated dimensions using PCA, and the most common statistical software packages set PCA as a default. However, PCA is not a legitimate factor analysis method, and statistical theorists dispute on its utility. Other scholars propose that component analysis should be replaced by factor analysis (Bentler & Kano, Citation1990; Floyd & Widaman, Citation1995; Gorsuch, Citation1990; Loehlin, Citation1990; MacCallum & Tucker, Citation1991; Mulaik, Citation1990; Widaman, Citation1993). Costello and Osborne (Citation2005) indicated that factor analysis is an appropriate method; however, PCA has been widely used in the previous decade because it was a cheaper and quicker method compared with factor analysis due to its computation without attention to the latent variable structure. Factors (latent variables) were generated using the entire whole variance of manifest variables, which is represented in the solution (Ford et al., Citation1986). The common factor analysis is used for identifying underlying variables that lead to changes in manifest variables. During factor extraction, only the shared variance of a variable is used to expose the underlying factor structure; however, PCA ignores shared and unique variances (Costello & Osborne, Citation2005). Choi et al. (Citation2017) considered eigenvalue-containing components by retaining all factors with eigenvalues. The default in most statistical software packages is to retain all factors with eigenvalues greater than 1.0. However, scholars hold their view on this method, that is, it is one of the least accurate methods for retain components. Parallel analysis is another option for testing factor retention (Velicer & Jackson, Citation1990). The current study performed both strategies and produced consistent outcomes.
Rotating the factor axes is critical for measurement model analysis in terms of simplifying and elucidating data. A varimax rotation or an orthogonal rotation (Costello & Osborne, Citation2005), which commonly is used for rotating uncorrelated factors, was used in the original model analysis (Choi et al., Citation2017). However, factors in studies in the social sciences are generally correlated; thus, an oblique rotation should be more suitable for the current study to provide an accurate and reproducible solution (Costello & Osborne, Citation2005) compared with orthogonal rotation, which may lose crucial information. Furthermore, the study employed oblique rotation with promax rotation, which resulted in the elimination of certain items from the final model of the CLMM.
Quality of CLMM
Analysis confirmed the quality of the CLMM by utilizing CCA. The finding demonstrated that the loadings of the final model indicators were not less than 0.708, and its squared was not less than 0.50. Therefore, the study infers that all items in the final model of the CLMM displayed very high indicator loadings, and the reliability coefficients range between acceptable to excellent (Diamantopoulos et al., Citation2012). Internal consistency and reliability were measured using CR by Jöreskog (Citation1971); the finding revealed that each dimension ranged from 0.904 to 0.928, and the alpha coefficient ranged from 0.873 to 0.911, which indicated good reliability (Diamantopoulos et al., Citation2012) and no redundant item (Drolet & Morrison, Citation2001). This result was consistent with the model of Choi et al. (Citation2017), which found that the alpha coefficient for each dimension ranged from 0.795 to 0.891 (Choi et al., Citation2017); however, the alpha coefficient for each dimension of the CLMM was slightly higher, and the overall reliability for compassionate leadership of CRLQ (α = 0.934) is slightly lower than that of the CLMM (α = 0.949). The reason underlying this result is that each dimension of the CLMM displayed high levels of internal consistency, which renders the alpha coefficient higher as a whole (Table ).
Table 5. Comparison of reliability between CLMM and Choi et al.’s model (Choi et al., Citation2017)
The metric used for evaluating the convergent validity of a construct is AVE. The study found that the AVE values of all questions under each of the dimensions ranged from 0.727 to 0.849, which exceeded the minimum threshold (a value of 0.5). Therefore, the convergent validity of all dimensions was valid (Bagozzi & Yi, Citation1991). Discriminant validity was established by comparing AVE values with the squared of the correlation between dimensions. If the AVE value is higher than the squared of the correlation between dimensions, then discriminant validity is confirmed. The current findings suggested that the CLMM in the Thai context displayed adequate discriminant validity (Fornell & Larcker, Citation1981). The reason is that the cross-loading of the problem questions was eliminated during the EFA step and the first step of loading verification using CCA. Moreover, the result revealed that correlation estimates suggested that the three dimensions are positively correlated with EL, and the CLMM displayed statistically significantly high correlation with EL (r = 0.804, p < .001); hence, nomological validity was achieved.
As a result of using a different approach for analysis, the proposed model exhibited several advantages over that of Choi et al. (Citation2017) for the social context in Thailand. First, the CLMM has a lower number of questions and a higher level of reliability. Much of the previous research have shown that a high number of questions, a lower response rates (Gargon et al., Citation2019). Less questions indicate less errors and more authenticity. As such, lengthy questionnaires can lead to weariness, loss of concentration, and non-response mistakes (Schwanz & Polle, Citation2001). Second, omitting certain questions from the measurement model clarified the interpretation as there was no cross-loading problem and indicated that certain items were inappropriate for entities in the Thai government. Third, factor structure helped in enhancing the understanding of compassionate leadership in Thai society. This aspect is useful for the development of future compassionate leadership theory.
The results provide an option for confirming measurement models using CCA in addition to CFA (Hair et al., Citation2020). This result requires researchers to understand the implications of different outcomes in making informed decisions. CCA and CFA can be used to increase item and scale reliability, detect and signal items that required improvement for content validity, and render convergent and discriminant validity easy to achieve (Hair et al., Citation2020). CCA presents advantages over CFA because it can store and use a higher number of items for measuring the structure of variables, which, thus, improves content coverage and structural accuracy (Hair et al., Citation2020). The GOF index, which is an indispensable index for CFA in verifying the validity of a model, is not required for CCA. However, this study examined GOF between the model and empirical data during the EFA step, which was provided with psych package v. 2.2.3 in R.
The study’s main findings were a theoretical measurement model of compassionate leadership in the Thai social context. This model enables us to fill research gaps, discovering that the theoretical structure of compassionate leadership differs from the original model and that some questions are inappropriate for the Thai social context. As a result, when used in the Thai social context, it will produce high validity research results.
5. Conclusion and recommendations
The CLQ from CRLQ (Choi et al., Citation2017) was developed to become the CLMM, which contains only 19 out of 27 items with three dimensions. The current study provided strong evidence of the convergent, discriminant, and nomological validity of the CLMM using CCA.
5.1 Theoretical implications
The study’s main implication is the theoretical structure of CLMM in Thailand. The CLMM has several advantages over the model of Choi et al. (Citation2017) because the CLMM contains less questions and displays a high level of reliability. The model provided increased clarity in interpretation in the context of public sector organizations in Thailand. Additionally, various factor structures enhanced the understanding of the dimensions of compassionate leadership in the social context in Thailand. This aspect renders It useful for development and lays the foundation for the formulation of theories on compassionate leadership in the future.
5.2 Practical implication
This study is notable for various reasons. First, it enabled the understanding of the underlying structures of compassionate leadership in the social context of Thailand. Second, senior executives in public service organizations can use the CLMM to assess their strengths and weaknesses such that they can improve themselves appropriately. In addition, the questionnaire of the CLMM provided useful information about leadership. Finally, the development of the CLMM prompted the creation of other relevant research procedures to provide results that are relevant to the social environment in Thailand. This study could be presented to other parties in the future as a significant tool for initiating government-sponsored studies on compassion.
The implementation of a comprehensive training and coaching program for CLMM-based organizational leaders as part of this study will help government organizations improve their leadership skills. However, the implementation of the CLMM requires knowledge of the indication of each dimension for users. Thus, further research on the effectiveness of this program is required after a deployment of the CLMM-based training program.
Acknowledgements
The researchers would like to express their appreciation to the employees of the Rubber Authority of Thailand.
Disclosure statement
No potential conflict of interest was reported by the author(s).
Additional information
Funding
Notes on contributors

Watusiri Chaiprasit
Watusiri Chaiprasit is a Ph.D. candidate in Management at the Faculty of Management Sciences, Prince of Songkla University in Thailand. She obtained a Master of Business Administration Program in Agribusiness Management from Songkla University and a Bachelor of Science Program in Agribusiness from Kasetsart University, Thailand. Her research interests focus on leadership, public service management, and performance in public organizations.
Idsaratt Rinthaisong
Idsaratt Rinthaisong is an Assistant Professor at the Faculty of Management Sciences, Prince of Songkla University in Thailand. He obtained a Ph.D. in Applied Behavioral Science Research, Srinakharinwirot University, Thailand. He conducts research on leadership, behavioral science, public administration, and advanced research methodologies.
References
- Anderson, J. C., & Gerbing, D. W. (1988). Structural equation modeling in practice: A review and recommended two-step approach. Psychological Bulletin, 103(3), 411. https://doi.org/10.1037/0033-2909.103.3.411
- Bagozzi, R. P., & Yi, Y. (1991). Multitrait-multimethod matrices in consumer research. Journal of Consumer Research, 17(4), 426–15. https://doi.org/10.1086/208568
- Barclay, D., Higgins, C., & Thompson, R. (1995). The Partial Least Squares (PLS) Approach to Causal Modeling: Personal Computer Adoption and Use as an Illustration. Technology Studies, 2, 285–309.
- Bentler, P. M., & Kano, Y. (1990). On the equivalence of factors and components. Multivariate Behavioral Research, 25(1), 67–74. https://doi.org/10.1207/s15327906mbr2501_8
- Cattell, R. B. (1966). The scree test for the number of factors. Multivariate Behavioral Research, 1(2), 245–276. https://doi.org/10.1207/s15327906mbr0102_10
- Chin, W. W. (1998). Commentary: Issues and Opinion on Structural Equation Modeling. MIS Quarterly, 22(1), 7–16.
- Choi, E.-S., Yeon, J.-Y., & Shin, Y.-K. (2017). Compassionate Rationalism Leadership Questionnaire (CRLQ) as the Measurement Scale for the Leadership of Compassionate Rationalism in Lifelong Education Proceedings of the Tenth Asia-Pacific Conference on Global Business, Economics, Finance and Social Sciences . January, 1–23 .
- Costello, A. B., & Osborne, J. (2005). Best practices in exploratory factor analysis: Four recommendations for getting the most from your analysis. Practical Assessment, Research, and Evaluation, 10(1), 7.
- Cronbach, L. J. (1951). Coefficient alpha and the internal structure of tests. Psychometrika, 16(3), 297–334. https://doi.org/10.1007/BF02310555
- Diamantopoulos, A., Sarstedt, M., Fuchs, C., Wilczynski, P., & Kaiser, S. (2012). Guidelines for choosing between multi-item and single-item scales for construct measurement: A predictive validity perspective. Journal of the Academy of Marketing Science, 40(3), 434–449. https://doi.org/10.1007/s11747-011-0300-3
- Drolet, A. L., & Morrison, D. G. (2001). Do we really need multiple-item measures in service research? Journal of Service Research, 3(3), 196–204. https://doi.org/10.1177/109467050133001
- Figley, C. R. (1995). Compassion fatigue: Toward a new understanding of the costs of caring. In B. H. Stamm (Ed.), Secondary traumatic stress: Self-care issues for clinicians, researchers, and educators (pp. 3–28). The Sidran Press.
- Floyd, F. J., & Widaman, K. F. (1995). Factor analysis in the development and refinement of clinical assessment instruments. Psychological Assessment, 7(3), 286. https://doi.org/10.1037/1040-3590.7.3.286
- Ford, J. K., MacCallum, R. C., & Tait, M. (1986). The application of exploratory factor analysis in applied psychology: A critical review and analysis. Personnel Psychology, 39(2), 291–314. https://doi.org/10.1111/j.1744-6570.1986.tb00583.x
- Fornell, C., & Larcker, D. F. (1981). Structural equation models with unobservable variables and measurement error: Algebra and statistics. Sage Publications Sage CA: Los Angeles, CA.
- Fredrickson, B. L. (2000). Cultivating positive emotions to optimize health and well-being. Prevention & Treatment, 3(1), 1a. https://doi.org/10.1037/1522-3736.3.1.31a
- Fryer, R. G. (2013). Teacher incentives and student achievement: Evidence from New York City public schools. Journal of Labor Economics, 31(2), 373–407. https://doi.org/10.1086/667757
- Gargon, E., Crew, R., Burnside, G., & Williamson, P. R. (2019). Higher number of items associated with significantly lower response rates in COS Delphi surveys. Journal of Clinical Epidemiology, 108, 110–120. https://doi.org/10.1016/j.jclinepi.2018.12.010
- Geertshuis, S. A., Morrison, R. L., & Cooper-Thomas, H. D. (2015). It’s not what you say, it’s the way that you say it: The mediating effect of upward influencing communications on the relationship between leader-member exchange and performance ratings. International Journal of Business Communication, 52(2), 228–245. https://doi.org/10.1177/2329488415572784
- Goetz, J. L., Keltner, D., & Simon-Thomas, E. (2010). Compassion: An evolutionary analysis and empirical review. Psychological Bulletin, 136(3), 351. https://doi.org/10.1037/a0018807
- Goleman, D. (2003). Destrcutive emotions and how we can overcome them: A dialogue with the Dalai Lama. Bloomsbury.
- Gorsuch, R. L. (1990). Common factor analysis versus component analysis: Some well and little known facts. Multivariate Behavioral Research, 25(1), 33–39. https://doi.org/10.1207/s15327906mbr2501_3
- Gross, P. (1994). Die Multioptionsgesellschaft. Suhrkamp.
- Hair, J. F., Jr, Howard, M. C., & Nitzl, C. (2020). Assessing measurement model quality in PLS-SEM using confirmatory composite analysis. Journal of Business Research, 109, 101–110. https://doi.org/10.1016/j.jbusres.2019.11.069
- Hair, J. F., Hult, G. T. M., Ringle, C. M., Sarstedt, M., & Thiele, K. O. (2017). Mirror, mirror on the wall: A comparative evaluation of composite-based structural equation modeling methods. Journal of the Academy of Marketing Science, 45(5), 616–632. https://doi.org/10.1007/s11747-017-0517-x
- Hair, J. F., Risher, J. J., Sarstedt, M., & Ringle, C. M. (2019). When to use and how to report the results of PLS-SEM. European Business Review, 31(1), 2–24. https://doi.org/10.1108/EBR-11-2018-0203
- Henseler, J., Dijkstra, T. K., Sarstedt, M., Ringle, C. M., Diamantopoulos, A., Straub, D. W., Ketchen, D. J., Jr, Hair, J. F., Hult, G. T. M., & Calantone, R. J. (2014). Common beliefs and reality about PLS: Comments on Rönkkö and Evermann (2013). Organizational Research Methods, 17(2), 182–209. https://doi.org/10.1177/1094428114526928
- Jöreskog, K. (1971). Statistical Analysis of Sets of Congeneric Tests. Psychometrika, 36, 109–133 https://doi.org/10.1007/BF02291393.
- Kaiser, H. F. (1974). An index of factorial simplicity. Psychometrika, 39(1), 31–36. https://doi.org/10.1007/BF02291575
- Kock, N., Mayfield, M., Mayfield, J., Sexton, S., & De La Garza, L. M. (2019). Empathetic leadership: How leader emotional support and understanding influences follower performance. Journal of Leadership & Organizational Studies, 26(2), 217–236. https://doi.org/10.1177/1548051818806290
- Lama, D., Tutu, D., & Abrams, D. C. (2016). The book of joy: Lasting happiness in a changing world. Penguin.
- Lilius, J. M., Worline, M. C., Dutton, J. E., Kanov, J. M., & Maitlis, S. (2011). Understanding compassion capability. Human Relations, 64(7), 873–899. https://doi.org/10.1177/0018726710396250
- Loehlin, J. C. (1990). Component analysis versus common factor analysis: A case of disputed authorship. Multivariate Behavioral Research, 25(1), 29–31. https://doi.org/10.1207/s15327906mbr2501_2
- Lohmöller, J.-B. (1989). Predictive vs. Structural Modeling: PLS vs. ML BT - Latent Variable Path Modeling with Partial Least Squares. In J.-B. Lohmöller (Ed.), Latent Variable Path Modeling with Partial Least Squares (pp. 199–226). Physica-Verlag HD. https://doi.org/10.1007/978-3-642-52512-4_5
- MacCallum, R. C., & Tucker, L. R. (1991). Representing sources of error in the common-factor model: Implications for theory and practice. Psychological Bulletin, 109(3), 502. https://doi.org/10.1037/0033-2909.109.3.502
- Mikkelson, A. C., Sloan, D., & Hesse, C. (2019). Relational communication messages and leadership styles in supervisor/employee relationships. International Journal of Business Communication, 56(4), 586–604. https://doi.org/10.1177/2329488416687267
- Mulaik, S. A. (1990). Blurring the distinctions between component analysis and common factor analysis. Multivariate Behavioral Research, 25(1), 53–59. https://doi.org/10.1207/s15327906mbr2501_6
- Nunnally, J. C. (1994). The assessment of reliability. Psychometric Theory.
- Parris, D. L., & Peachey, J. W. (2013). A systematic literature review of servant leadership theory in organizational contexts. Journal of Business Ethics, 113(3), 377–393. https://doi.org/10.1007/s10551-012-1322-6
- Rhemtulla, M., van Bork, R., & Borsboom, D. (2020). Worse than measurement error: Consequences of inappropriate latent variable measurement models. Psychological Methods, 25(1), 30. https://doi.org/10.1037/met0000220
- Rigdon, E. E. (2012). Rethinking partial least squares path modeling: In praise of simple methods. Long Range Planning, 45(5–6), 341–358. https://doi.org/10.1016/j.lrp.2012.09.010
- Rigdon, E. E. (2016). Choosing PLS path modeling as analytical method in European management research: A realist perspective. European Management Journal, 34(6), 598–605. https://doi.org/10.1016/j.emj.2016.05.006
- Rigdon, E. E., Becker, J.-M., & Sarstedt, M. (2019). Parceling cannot reduce factor indeterminacy in factor analysis: A research note. Psychometrika, 84(3), 772–780. https://doi.org/10.1007/s11336-019-09677-2
- Sarstedt, M., Hair, J. F., Ringle, C. M., Thiele, K. O., & Gudergan, S. P. (2016). Estimation issues with PLS and CBSEM: Where the bias lies! Journal of Business Research, 69(10), 3998–4010. https://doi.org/10.1016/j.jbusres.2016.06.007
- Schwanz, P., & Polle, A. (2001). Differential stress responses of antioxidative systems to drought in pendunculate oak (Quercus robur) and maritime pine (Pinus pinaster) grown under high CO 2 concentrations. Journal of Experimental Botany, 52(354), 133–143 https://doi.org/10.1093/jexbot/52.354.133.
- Shuck, B., Alagaraja, M., Immekus, J., Cumberland, D. M., & Honeycutt-Elliott, M. (2016). Operationalizing Compassionate Leadership Behavior. Academy of Management Proceedings, 2016(1), 14266. https://doi.org/10.5465/ambpp.2016.14266abstract
- Tabachnick, B. G., Fidell, L. S., & Ullman, J. B. (2007). Using multivariate statistics (5th ed.). Allyn & Bacon/Pearson Education.
- Velicer, W. F., & Jackson, D. N. (1990). Component analysis versus common factor analysis: Some issues in selecting an appropriate procedure. Multivariate Behavioral Research, 25(1), 1–28. https://doi.org/10.1207/s15327906mbr2501_1
- Vigoda-Gadot, E., & Beeri, I. (2012). Change-oriented organizational citizenship behavior in public administration: The power of leadership and the cost of organizational politics. Journal of Public Administration Research and Theory, 22(3), 573–596. https://doi.org/10.1093/jopart/mur036
- Widaman, K. F. (1993). Common factor analysis versus principal component analysis: Differential bias in representing model parameters? Multivariate Behavioral Research, 28(3), 263–311. https://doi.org/10.1207/s15327906mbr2803_1