
 ?Mathematical formulae have been encoded as MathML and are displayed in this HTML version using MathJax in order to improve their display. Uncheck the box to turn MathJax off. This feature requires Javascript. Click on a formula to zoom.
Abstract
The Bank of Zambia has one of the highest central bank turnover averages in Africa and the inflationary effects of the low central bank autonomy are yet to be empirically quantified. This study develops an index of central bank turnover for the Zambian economy extending from 1984 to 2020 and applies continuous wavelet coherence techniques to examine its co-movement with inflation in a time-frequency domain. We find negative co-movements between the variables across the entire time window with higher (lower) frequency correlations being dominant in the pre-2000 (post-2000) period. Moreover, the phase difference dynamics indicate that central bank turnover has led inflation in all periods except during the 1990–1995 and 2016–2020 periods where reverse causality is observed. Altogether, our study paints a detailed narrative on the relationship between the variables for the Zambian economy and offers policy advice aimed at strengthening the independence and credibility of the country’s central bank.
1. Introduction
With the recent dismissal of Zambian central bank governor Denny Kalyalya, the Zambian economy now records the highest number of central bank governors and consequentially, exerts the highest central bank governor turnover average in the Southern African region (see, Table ). Historically, the longest serving Zambian central bank governor has served a shorter term in comparison to the longest serving central bank governors in other African countries. Moreover, the Bank of Zambia (BoZ) has recorded one of the shortest serving central bank governor’s on the continent i.e. 1-year term. Altogether, these statistics are of grave concern since high ratios of central bank governor turnover or replacements are academically associated with low levels of central bank independence and credibility, which in turn implies a weakened commitment of the central bank to price stability as a policy objective (Alesina & Summers, Citation1993; Cukierman, Citation2008; Cukierman et al., Citation2002; Cukierman & Webb, Citation1995; Cukierman et al., Citation1992; Garriga & Rodriguez, Citation2020; Klomp et al., Citation2010; Kokoszczynki & Mackiewicz-Lyziak, Citation2020).
Table 1. List of African countries with double digit central bank governors (1960–2020)
The extent to which a central bank can commit to price stability is closely linked to whether a central bank can be deemed as being autonomous or not. In a highly influential paper, Nobel laureates Kydland and Prescott (Citation1997) showed that under non-autonomous or discrete policymaking, the expectations of economic agents on future policy actions become variant to the policy plan selected in the future and any change in actual policy will alter the structure of the policy decision rules. Therefore, simulations conducted on macroeconomic models used by discrete policymakers to guide decision making can only provide solutions which would “look” optimal at the time of implementation and yet with the passing of time these policies will not remain optimal. The resulting “time-inconsistency” of policy plans ensures that discrete policymakers cannot apply optimal control theory to maximize their social objective functions over the infinite period, and any pursuits of “optimal policy” (at least that which will look optimal at that a particular moment of time) will only result in an inflationary bias and unchanged excess unemployment and/or output losses over infinite time horizons. Kydland and Prescott’s (Citation1997), Barro and Gordon (Citation1983), and Rogoff (Citation1985) provide sub-optimal equilibrium solutions to this “time-inconsistency” problem in monetary policy context by ensuring the central bank behaves as an autonomous entity who has a preference for low inflation and commits to a transparent policy rule. Consequentially, this enhances the policymaker’s credibility with economic agents and steers the agent’s future expectations of policy outcomes to be on par with current and past policy outcomes. It is for this reason that central banks worldwide have increasingly prioritized their commitments to price stability in which reserve banks are given autonomy in setting the monetary policy instrument which will keep inflation bound within some pre-determined band-width (Bernanke & Mishkin, Citation1997; Svensson, Citation1997; Walsh, Citation1995).
For central banks to fully commit to achieving price stability, executive powers need to be delegated to reserve bank governors in a manner which minimizes or eliminates the political influence of the state on monetary policy. However, in practice, the social objective function of the state tends to differ from that of price stability and therefore governments may pressure central banks towards implementing policies aimed at stimulating the economy at the cost of an inflationary bias arising from the expansionary policy. In some cases, the reserve bank governor will resign or be dismissed if the central bank fails to succumb to political pressure. Indeed, the literature predicts that central bank turnover is higher during periods of elections (Dreher et al., Citation2010), recessions (Klomp et al., Citation2010), debt crisis (Artha & de Hann, Citation2015) as well as where there exists weak rule of law (Sturm & de Haan, Citation2001); all which are features characterizing the Zambian economy at the time of dismissing governor Kalyalya.
1.1. Contribution of the study
Our study develops a time series index of central bank governor turnover for the BoZ by relying on the coding system presented in Dreher et al. (Citation2008, Citation2010) and we use the index to examine its correlationship with inflation over the period 1984–2020. We note that the time span of our empirical analysis covers a host of monetary policy and political regime shifts, from the traditional fixed exchange rate regime under the one-state economy in the mid-1980s, to the exchange rate reforms and monetary target regime implemented under the multi-party democracy in 1990s, and the more recent interest rate targeting era of the post-2010 period (Cheelo & Banda, Citation2017; Cheelo & Hinfelaar, Citation2020; Simatele et al., Citation2015). Moreover, there are other structural breaks such as the oil crisis of the 1970s, the Asian financial crisis of 1998–2000, global financial crisis of 2007, the oil gut period of 2015 and the ongoing coronavirus pandemic, all which had spillover effects into global copper prices and the Zambian macroeconomy. It is therefore important to employ analytical methods which are flexible enough to capture the asymmetric dynamics and structural changes reflected in the time series.
To capture possible structural breaks and nonlinearities, not only in the evolution of the individual time series, but also in the time-varying correlation between a pair of time series, we make use of continuous wavelet transform. These mathematical tools allow one to examine the amplitude and phase dynamics in the synchronization between central bank governor turnover and inflation within a time-frequency domain. Notably, most previous empirical studies do not account for the possibility of time-varying or asymmetric dynamics between central bank governor turnover and inflation. At best, previous studies make use of dummy indicators to capture structural changes such as policy regime change (De Haan & Siermann, Citation1996), financial and banking crisis (Artha & de Hann, Citation2015; Kokoszczynki & Mackiewicz-Lyziak, Citation2020), political cycles (Haga, Citation2015) and economic cycles (Ftiti et al., Citation2017). The closest studies to ours are presented in Bouwman et al. (Citation2005) and Siklos (Citation2008), who make use of quantile regressions to capture the varying strength of correlation between central bank governor turnover and inflation at different quantiles of conditional distribution. Whilst this allows the authors to account for heterogeneity by capturing the varying strength of the relationship between the time series at different distributions of inflation, the empirical analysis remains “static” from a time-frequency perspective.
As far as we are concerned, this study becomes the first to make use of Wavelet coherence analysis to model the dynamic correlation between central bank governor turnover and inflation within a time-frequency domain. We find this quite surprising considering that the methodology has been virtuous in unveiling dynamic co-movements in monetary policy functions including, but not limited to, policy reaction functions (Aguiar-Conraria et al., Citation2018), Phillips curve (Aguiar-Conraria et al., Citation2019; Gallegati et al., Citation2011) and the yield curve (Aguiar-Conraria et al., Citation2012; Gallegati et al., Citation2014; Ojo et al., Citation2020). A common theme of these papers is that asymmetries in monetary relations emerge in two forms, firstly, via time-varying changes caused by structural breaks in the data and, secondly, via frequency-variations caused by changing cyclical dynamics in the series, e.g., economic and political cycles.
By making use of continuous wavelet transforms (CWT), such as wavelet power spectrums, wavelet coherence analysis and phase difference dynamics, which are employed to model i) the time-frequency properties of the individual series (central bank governor turnover and inflation), and ii) the time-frequency co-movement between the time series with respect to the strength (strong or weak), the sign (negative or positive) and causal direction of the relationship, our study presents three key contributions to the burgeoning literature.
Firstly, by conducting a country-specific analysis for the Zambian economy, we more effectively separate “the wheat from chaff” in determining the true effects of central bank governor turnover on inflation. Note that previous studies which have included Zambia in the empirical analysis between central bank turnover and inflation predominantly find a negative relationship between the series (Alesina & Summers, Citation1993; Crowe & Meade, Citation2008; Cukierman, Citation2008; Cukierman et al., Citation2002; Cukierman & Webb, Citation1995; Cukierman et al., Citation1992; Garriga & Rodriguez, Citation2020; Kokoszczynki & Mackiewicz-Lyziak, Citation2020) whilst a smaller group of more recent literature has found little or no relationship between the variables (Agoba, Abor, Sa-Aadu et al., Citation2017a; Baumann et al., Citation2021; Cheelo & Banda, Citation2017; Kusi et al., Citation2019; Lim, Citation2021).
Secondly, our study demonstrates that continuous wavelet transfers are flexible enough to capture the irregular patterns in the central bank governor turnover time series which is shaped as a sawtooth wave or triangular wave. The wavelet power spectrum (WPS) segregates the high- and low-frequency cyclical features of the unorthodox shaped turnover series and the inflation rate across a sliding time window, which in turn, allows us to link the cyclical features of the data to different time tenures of the central bank governors.
Thirdly, the wavelet coherence and phase-difference tools enable us to reveal new stylized facts on the co-movement between central bank governor turnover and price stability which may have been difficult to uncover using more traditional econometric analysis. We find that the co-movement between turnover rate and inflation for the Zambian economy has been historically characterized by out-of-phase (negatively) synchronized cyclical swings of higher frequency bands of 3–5 years between 1984 and 2000 whilst lower frequency bands of 7–12 years bands dominate from 1992 onwards. Moreover, our findings reveal that, at least for the Zambian economy, causality runs uni-directional from the turnover rate to inflation in all periods except between 1992–1995 and 2016–2020 were reverse causality is observed.
The overall implications derived from the empirical analysis are just as intriguing as the methods used to obtain the results. For instance, our study demonstrates on how shorter governor cycles in Zambia lead to higher inflation whilst longer governor cycles have an inflation reducing effect and this fits well with the narrative that “beyond some threshold” governor turnover worsens inflation (Cukierman et al., Citation1992). This, in turn, implies that the BOZ needs institutional and legislative reforms which can grant the governor complete “de facto” independence from political pressures which threaten the tenure of the governors. And whilst our study solely focuses on governor turnover as a measure of CBI, it sets the tone for future policy discussions and research on the personnel qualities of the central bank governor (and staff) who should be granted longer tenures based on decision-making abilities.
The rest of the study is organized as follows. The next section of the paper discusses our measurement of central bank governor turnover time series. The third section of the paper presents an overview of inflation and central bank governor turnover. The fourth section present an outline of our continuous wavelet methodology. The fifth section of the paper present our empirical findings whilst the sixth section concludes the paper in the form of policy implications and recommendations.
2. Discussion of the data
2.1. Measuring central bank governor turnover and review of literature
The first element of complexity in our study is constructing a time series measure of central bank governor turnover. Cukierman et al. (Citation1992), Cukierman et al. (Citation1992), Cukierman and Webb (Citation1995), and Eijffinger et al. (Citation1998) were amongst the first to provide a comprehensive measure of central bank turnover which is computed as the reciprocal of the average number of years a central bank governor stays in office and the authors consider the turnover rate as the “actual” or “de facto” measure of CBI independence. The indicator is based on the presumption that, at least above some threshold, more rapid turnover of central bank governors indicates a lower CBI. This is distinguishable from the “legal” or “de jure” measures such as independence granted by legislature which do not explicitly specify the limits political authorities and therefore do not present a complete measure CBI in the sense required by theory (Chrigui et al., Citation2011; De Haan & Kooi, Citation2000; Sturm & de Haan, Citation2001; Vuletin & Zhu, Citation2011). Moreover, the turnover rate has been considered as a more suitable measure of CBI for developing countries since these countries tend to have “less regard for the law” embedded in political culture (Cukierman et al., Citation1992). Whilst many empirical studies have used governor turnover rate as a behavioural measure of CBI (see, Crowe and Meade (Citation2008), Garriga (Citation2016), and Fouad et al. (Citation2019) for extensive reviews), one shortcoming with this proxy is that it averages different governors term office for individual economies and thus is only suitable with cross-sectional analysis which are often subsampled over various periods for comparative purposes.
There also exists a separate, and notably smaller, group of studies which have relied on time series measures of central bank turnovers based on the number of years a governor spends in office. Dreher et al. (Citation2008) initially developed time series cyclical index of the number of years different central bank governors spend in office for 137 countries (inclusive of Zambia) between 1970–2004 and use these indices to compute the probability of the governor losing her/his job due to inflation, political and instability and the occurrence of elections and coups, all which are found to be significant determinants. Dreher et al. (Citation2010) use a similar “term-in-office” data to determine the probability that a governor is replaced before the end of their legal term in office for 137 countries (inclusive of Zambia) between 1970 and 2005, and find factors such political and regime instability, occurrence of elections and private credit to GDP ratio are most significant in determining the governor’s tenure. Moser and Dreher (Citation2010) examine the effect of central bank appointments and dismals on stock market, bond market and foreign exchanges for 20 emerging economies (excluding Zambia) over the period 1992–2006 and find that the resignation of governor adversely affects financial markets on the day of the announcements whilst newly appointment governors suffer from systematic credibility problem at the start of their tenure. Hayat and Farque (Citation2011) replicate Dreher et al. (Citation2008) data over the period 1980–2005 to examine the determinants of central bankers’ removals for 103 countries (inclusive of Zambia) and find that current crisis, banking crisis, strength of democracy and inflation performance are all significant determinants. Nonetheless, previous studies have not used or extended on Dreher et al. (Citation2008) “term-in-office” data as measure of central bank turnover in determining its effects on inflation, which is a “hiatus” our study fills using the Zambian economy as a case study.
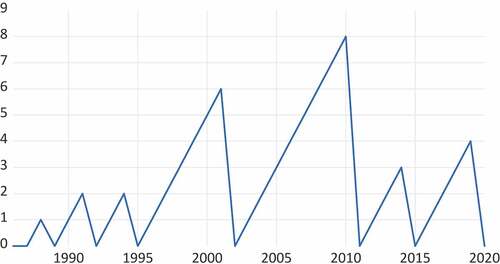
Figure presents the extended time series of “term-in-office” data using the coding system of Dreher et al. (Citation2008) and Dreher et al. (Citation2010) for the BoZ between 1986 and 2020. Note that between these time periods the BoZ has made seven governor changes which can be easily identified by either counting the number of “peaks” in the cyclical series or the number of points lying on the horizontal axis. The “peaks” in the series indicate the ending term of the central bank governor whilst the points on the horizontal axis represent the starting term of the next or new governor. The transversal space between, and connecting, the points on the horizontal axis measure the number of years the central bank governor has stayed in office. The names of the governors and their tenure periods, which have been used to construct the data, are provided at the bottom of Figure .
Figure 1. BoZ Central Bank Governor Turnover (1984–2020).
2.2. Inflation in Zambia (1986-2020)
We source our inflation data from the World Bank Development Indicators (WBDI) and we choose the longest available series of annual percentage change in consumer price inflation (CPI) which extends from 1986 to 2020. Ideally, we would want to source from as far as 1964, when Zambia first attained her independence and established the BoZ. However, due to constraints on data availability, our inflation data covers a period corresponding to 9 out of the 16 appointed BoZ governors. Figure presents the time series plots of the series whilst Table summarizes the information on central bank governors, their tenure, and the average inflation rate under their tenure.
Figure 2. Zambia consumer prices inflation (1986–2020).
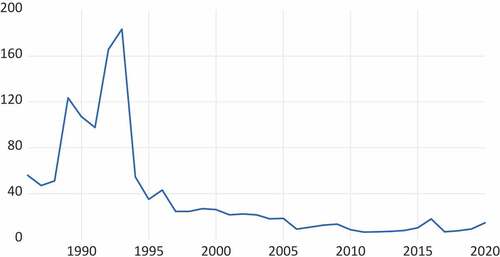
Table 2. Governor tenure years and their inflation averages
Our data coverage begins at a time when Zambia was a one-party state which was trying to implement nationalist policies based on import substitution industrialization in the midst of severe economic distress attributed to the global oil crisis of the early and late 1970s. The sharp increase in inflation experienced in the early-to-mid 1980s was mainly caused by i) global inflationary pressures (Odhiambo, Citation2012) ii) the increased printing of money by the BoZ to finance the widening fiscal deficit (Wulf, Citation1988) iii) the BoZ’s implementation of exchange rate auctions which depreciated the kwacha (Aron & Elbadawi, Citation1992). Dissatisfied with the IMF supported exchange rate auction scheme, which more than doubled the inflation rate from 20.4% in 1984 to 55% in 1986, President Kaunda fired governor David Phiri in 1986 and replaced him with Leonard Chivinuo who introduced various changes, including a partial “Dutch auction” system of foreign exchange auctions and ceilings on debt service payments (Kydd, Citation1988).
Following worsening economic conditions, including an inflation rate of 55% in 1986, governor Chivuno was replaced by Francis Nkomo in 1987 after the Zambian government tried to amend her relations with the Washington institutions (Jalakas, Citation1987). In conformity to the IMF’s structural programme the government began economic reforms inclusive of price deregulation and the abolishment of food subsidies which added pressure to the already rising inflation rate which then increased from 47% to 123% between 1987 and 1989 (Adam, Citation1995). These turns of events cumulated into the infamous Copperbelt riots which forced government to abandon the IMF sponsored programmes and embark on a “New Economic Recovery Programme” (Simatele, Citation2004).
In 1989, Zambia had entered into triple digit inflation rates and the government sought assistance away from the Washington-based institutions and towards the Canadian government who recommended Jacques Bussiered who then replaced Governor Nkomo in 1990 when inflation was 107%. Governor Bussiered tried to change the mentality on the role and importance of the Central Bank in ensuring financial and macroeconomic stability (Cheelo & Hinfelaar, Citation2020) and yet this did not slow down central bank financing of fiscal debt which led to a 95% per cent increase in broad money and inflation rate of 165% by 1992 (Brownbridge, Citation1996). Following the first multi-democratic elections in 1992, Dominic Mulaisho was appointed as BoZ governor and under his tenure the Reserve Bank experienced significant monetary reforms through interest rate liberalization, exchange rate unifications, introduction of formal payment systems and implementation of a cash-budget (Simatele et al., Citation2015). Notably under governor Mulaisho’s tenure, inflation experienced its most dramatic decrease from 183% in 1993 to 34% in 1995 and yet he was fired by the new President Chiluba and replaced by Jacob Mwanza following the collapse of Meridien Bank and the continuous decline of the Kwacha in 1995 (Cheelo & Hinfelaar, Citation2020).
Under governor Mwanza a new Central Bank act of 1996 was introduced and differing from the Bank act of 1964, the BoZ was mandated the responsibility of ensuring price stability and during his 7-year tenure inflation fell from 34% in 1995 to 21% in 2001, the economy recorded her first fiscal surplus although several banks collapsed during this period due to the BoZ’s poor supervisory and regulatory governance of financial institutions (Maimbo, Citation2002; Simuchile & Pamu, Citation2004). Caleb Fundanga succeeded governor Mwanza in 2002 as appointed by the 3rd incoming president Levy Mwanawasa, who increased the BoZ’s reputation, credibility and overall functionality, and has been generally hailed as “Zambia’s inflation champion”. It is under governor Fundanga that the BOZ was better managed, having “survived” the aftermath of Asian Financial crisis of 1999–2001 and the global financial crisis of 2007–2009, and by 2011 the Zambian economy averaged single digit inflation rates. However, governor Fundanga, being the first BoZ governor to serve under consecutive presidents Mwanawasa and Banda, was fired by the 5th incoming President Michela Sata and replaced by Micheal Gondwe in 2011.
In 2012, there was a shift from the use of monetary aggregates as policy instrument towards an interest rate targeting framework based on the policy rate from the overnight interbank rate (Cheelo & Banda, Citation2017; Mwafulirwa, Citation2019) and in 2013 the Zambian Kwacha was redominated by 1000 (Simpasa et al., Citation2015) whilst inflation remained below 7% between 2012 and 2013. However, between 2013 and 2015, the economy experienced several shocks including a decline in global cooper prices due to slowdown of China, underperforming mining sector, sovereign rating downgrade and electricity crisis, and during this period inflation increased from 6% to 10% (Chipili, Citation2021; Roger et al., Citation2017). In 2015, the sixth incoming President Edgar Lungu replaced Governor Gondwe with Denny Kalyalya, who was successful in bringing inflation down from 17% in 2016 to 6% in 2017, and under his tenure the BoZ has committed themselves to keeping inflation between 6–8% target. However, with the recent coronavirus pandemic, inflation doubled from 7% in 2018 to 14% in 2020, and in the midst of the pandemic governor Kalyalya was fired and recently replaced with Christopher Mvunga and inflation has been on an upward trend since his short appointment
3. Discussion of the methodology
Our study uses continuous wavelet transforms to investigate the co-movement between the central bank turnover (Y) and inflation (X) across a time-frequency domain. A majority of the literature examining the relationship between the variables have predominantly relied on OLS estimators (Agoba, Abor, Osei et al., Citation2017a; Alesina & Summers, Citation1993; Baumann et al., Citation2021; Cheelo & Banda, Citation2017; Crowe & Meade, Citation2008; Cukierman, Citation2008; Cukierman et al., Citation2002; Cukierman & Webb, Citation1995; Cukierman et al., Citation1992; Garriga & Rodriguez, Citation2020; Kokoszczynki & Mackiewicz-Lyziak, Citation2020; Kusi et al., Citation2019) whilst a few other studies have used quantile regressions to account for distributional asymmetries in the relationship (Bouwman et al., 2004; Siklos, Citation2008). An analytical shortcoming with these methods is that they provide no information on the time-varying relationship between the time series and are strictly localized in time which provides no information on possible frequency relationships between the variables.
Wavelets take a Fourier process, which can localize signals in frequency domain, and replace its complex exponentials by “wavelet functions” which decompose a time series in a scale-by-scale manner. Therefore, wavelets present the “best of both worlds” in the sense that they can localize a time series in both time and frequency via dilation and translation operators and yet the Heisenberg uncertainty principle insinuates that time and frequency cannot simultaneously be measured at high precision such that when one is more precisely measured, the other is less precisely measured, i.e. trade-off between time and frequency (Aguiar-Conraria & Soares, Citation2014). Morlet et al. (Citation1982) use Heisenberg principle to keep the product of the time and frequency widths of the wavelet constant such that the “mother wavelet” has exponential decay in time-frequency space and thus produces optimal join time-frequency resolution compared to other types of wavelet functions (Raihan et al., Citation2005).
In our study we make use of complex Morlet wavelets whose spectrum has non-negative frequencies which allow us to explore the instantaneous phase information of the signal(s) in time-frequency plane. Complex value wavelets, like the complex sine waves, have two parts, the real and the imaginary part which can be visualized along a 3-dimensional space consisting of time, the real part and the imaginary part and it’s convolution with the signal results in a series of complex numbers representable through Euler’s notation from which the amplitude and phase can be extracted. From the amplitude and phase dynamics, we are able to depict the synchronization between the pair of time series, Y and X, across 5 dimensions i) a time-varying dimension ii) frequency-varying dimension iii) strength-varying dimension iv) in-phase (positive co-movement) or anti-phase (negative co-movement) dimension v) led-lag (causality) dimension.
3.1. Mathematical representation of continuous wavelets
We define a continuous wavelet transform (CWT) for a wavelet through the following function:
Where * denotes a complex conjugation, τ is the translation parameter which dictates where the wavelet is centred, and s is the scaling parameter controlling the length of the wavelet which is compressed . The window size adjusts itself optimally to longer basis functions (wider windows) at low frequencies, by stretching, and to shorter basis functions (narrower windows) at high frequency, by compressing. hence allowing for sharp frequency resolutions at low frequency movements and sharp time resolution for high frequency movements (Raihan et al., Citation2005). Since the wavelet coefficients contain combined information on both x(t) and ψ(t), propose the use of a complex-valued wavelet function since its corresponding transform will also be complex and can be separated into an amplitude and a phase. There are a number of “families” of complex wavelet. In this study we focus on complex Morlet wavelets which has advantages over other wavelets (see Torrence and Combo (1992) for detailed discussions) and consists of a complex sinusoid (sine wave) modulate by a gaussian envelope:
To ensure that the parameterization of the Morlet wavelet depicts an inverse relation between wavelet scales and the frequencies, , the Morlet be set to approximately 6 (i.e. ω0 = 2π) in order for the wavelet scale, s, to be almost equal to the Fourier period. Within the continuous complex Morlet wavelet, the wavelet power spectrum (WPS) can be extracted, which measures the variance of a time series across a two-dimension plane i.e. time and scale. Formally, the WPS for a discrete time series, xn, can be expressed as:
Where S is a smoothing operator in both time and scale. The cross wavelet transform allows us to derive information about the phase difference between two signals and thus obtain information about the led-lag synchronizations of the two series over a time and frequency plane (Aguiar-Conraria et al., Citation2012). The phase-difference can be defined as:
Where ϕx,y is parametrized in radians, bound between π and -π. A phase-difference of zero implies that the series are in phase with x leading y. If ϕ
), then the series are said to be in-phase (positive correlation) with y leading x in the former and x leading y in the latter. Conversely, if ϕx,y ∈ (
, π) and ϕx,y ∈ (
,
π), then the series are said to be in an anti-phase (negative correlation) with x leading y in the former and y leading x in the latter.
4. Discussion of the results
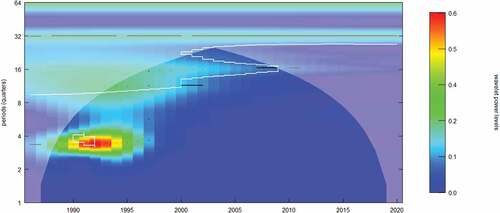
4.1. Wavelet power spectrum (WPS) analysis
Figure presents the wavelet power spectrum (WPS) plots for the central bank turnover and inflation series, respectively. These plots capture the distribution of energy within the time series at different scales and informs us of how much frequency band has contributed to the energy in the series at different time intervals. From the WPS plots, the horizontal axis measures time whilst the vertical horizon measures the frequency variations which can be specified as a reciprocal of time i.e. f = 1/t. Therefore, higher frequencies represent shorter and more abrupt cycles periods whilst lower frequency components represent longer and smoother cycles. The different contour colours measure the strength of variation within the time series at different cycles, with warmer colours indicating stronger variation and cooler colours denoting weaker variation. The white lines surrounding the coloured contours represent the 5% significance level which is computed using 1000 simulation runs. Moreover, the cone influence (i.e. inverted U-shaped contour) accounts for edge effects caused by “zero padding” effects and caution should be practiced in observing regions very close to the ‘cone’.
Figure 3. wavelet power spectrum for central bank turnover
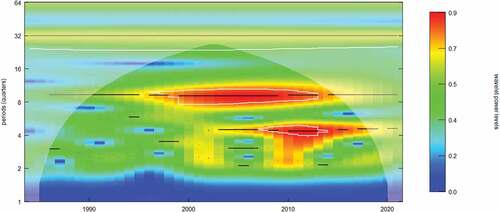
Starting with Figure , one observes that the WPS manages to capture the irregular cyclical patterns in the governor turnover series and we identify two main frequency cycles in the time series where variation is strong. Firstly, there are dominant lower frequency cycles of between 6–9 years which emerge around 1995 and extend until 2012. We note that this first cyclical band corresponds to the tenure periods of governors Mwanza (1995–2002) and Fundanga (2002–2012) who have historically being the longest serving governors of the BoZ. Secondly, in the post-financial crisis period of 2007–08 we observe other frequency oscillations between 3–5 years and we note that these cycles corresponded to the more recent tenures of governors Gondwe (2011–2015) and Kalyalya (2015–2020).
Proceeding to Figure , the WPS of the inflation series identifies four distinct cyclical oscillations in the data between 1986 and 2020. Firstly, there are extremely high-frequency components of 2–4 years which capture the “hyperflation” period of 1987–1992 sparked by the 1970ʹs oil crisis and yet fuelled by poor monetary and fiscal policy decisions. Secondly, there are lower frequency cycles of 6–7 year bands which occur between 1992–1995 corresponding to the early post-democratic period where governor Mulaisho managed to, through fiscal discipline and a change in monetary policy, bring inflation from triple digits to double digits. Thirdly, there exist more dominant low-frequency components of 12–24 year oscillations which are present from 1995 to 2000 which correspond to governor Mwanza tenure. Lastly, there are, from the year 2000 onwards corresponding to the consecutive tenures of the last 4 governors (i.e. Fundanga, Gondwe, Kalylaya and Mvunga), cyclical bands of 12–16 years loose significance to much lower frequency bands of 16–24 cycles, which, in turn loss strength in variability, i.e. much cooler contour colours around significant frequency bands
Figure 4. wavelet power spectrum inflation
Altogether, the WPS presented for central bank turnover and inflation in Figures allow us to discern different structural changes reflected in the varying strength and size of cyclical oscillations in the data. On one hand, we find the WPS manages to capture the cyclical features of the irregularly shaped central bank turnover series from 1995 onwards, that is, for frequency oscillations between 3–9 years, but fails to do so for cyclical oscillations below 3 year frequencies which corresponds to the tenures of the last 3 governors in the Kaunda regime. On the other hand, the WPS for the inflation series distinguishes inflation dynamics during the Kaunda era where inflation was high and volatile and in the post-democratic era where inflation has been lowered and is stable particularly in the post 2000 period. Having examined the individual time series across a time-frequency domain, we proceed to present the findings of the wavelet coherence between the series in the following subsection.
4.2. Wavelet coherence analysis
The wavelet coherence analysis between central bank turnover and inflation in the Zambian economy is presented in Figure and describes the co-movement between the time series over a time-frequency plane using spectrum plots. The colour contours within the spectrum plots measure the strength of synchronization between the variables whilst the faint white line surrounding the colour contours represent the 5% significance obtained by 1000 simulation runs. The arrows within the spectrum plots represent the phase-dynamics between the series and provides us with information on the “sign of the relationship” (negative or positive) and the direction of causality (does central bank turnover lead inflation or vice versa). Technically, we state that the series are in-phase (anti-phase) if the variables have positive (negative) correlations which are represented by arrow notations ,
,
and
(
,
,
and
). Moreover, the series are considered i) in-phase with central bank turnover leading (lagging) inflation if the arrow orientation are
,
and
(
) and ii) anti-phase with central bank turnover leading (lagging) inflation if the arrow orientation is
,
and
(
).
Figure 5. Wavelet coherence plot:Boz Governor turnoTver Vs Inflation.
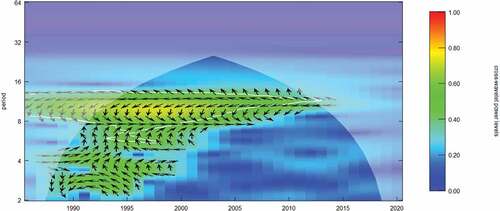
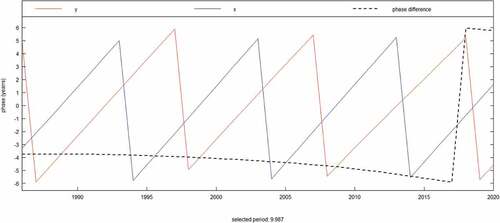
From the wavelet coherence spectrum plot in Figure , our findings can be summarized in three points. Firstly, from a time perspective, we observe two broad bands of frequency oscillations over the entire time window with i) higher frequency bands of 3 to 5 year cycles observed between 1984 and 2000 ii) lower frequency bands of 7 to 12 year cycles observed between 1992 and 2021. Secondly, the strength of the higher frequency oscillations observed in pre-2000 era is weaker (i.e. green colour contour) compared to oscillations of lower frequency bands (i.e. yellow colour contour). Lastly, from a phase-perspective, we observe that i) higher frequency oscillations of 3–5 years between 1986 and 2000 are anti-phase (negative) with central bank turnover leading inflation between 1984 and 1992 whilst between 1992 and 2000 the series are still exhibit in-phase synchronization and yet central bank turnover leads inflation. These dynamics are reflected in the phase-difference plot at a selected frequency band of 3 years presented in Figure ii) lower frequency oscillations of 7–12 years observed throughout the sample period are anti-phase (negative) with central bank turnover leading inflation until 2016 where the series are still positively synchronized and yet inflation leads central bank turnover. These dynamics are reflected in the phase-difference plot at a selected frequency band of 3 and 9 years presented in , respectively.
Figure 6. Phase difference Dynamic (3 years frequency Band).
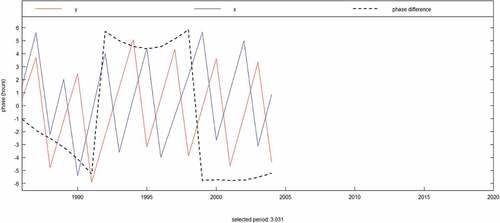
Figure 7. Phase difference Dynamic (9 years frequency Band).
Altogether our results paint a detailed narrative on the relationship between central bank turnover and inflation in Zambia over the last four decades or so. We find under the tenures of governors Phiri (1984–1986), Chinonu (1986–1987), Nkoma (1987–1989) and Bussierres (1990–1992) who served under the Kaunda government, lower central bank independence was the cause of higher inflation as the central bank was forced support government deficit and expenditure items as opposed to directly controlling inflation. However, immediately following the political, economic and monetary reforms in the early 1990ʹs, we observe a change in the causal dynamics of the relationship, with inflation leading to central bank turnover during the tenure of governor Mulaisho between 1992 and 1995. This blends well with the narrative that governor Mulaisho was fired by president Chiluba due to rising inflation and poor exchange rate performance (Cheelo & Hinfelaar, Citation2020). However, subsequent to the tenure of governor Fundanga in early 2000, we note that the high-frequency relationships disappear altogether and only low-frequency relations remain in which higher office tenure led to lower inflation until around governor Kalyalya’s tenure when the causality changes and higher inflation leads central bank governor turnover.
Our results also have academic relevance. From an empirical perspective, our findings bridge three strands of empirical literature. Firstly, our findings concur with previous studies which find that higher (lower) central bank turnover results in higher (lower) inflation in developing and African economies (Cukierman et al., Citation1992; Cukierman & Webb, Citation1995; Alesina & Summers, Citation1993; Cukierman et al., Citation2002; Crowe & Meade, Citation2008; Cukierman, Citation2008; Garriga & Rodriguez, Citation2020; Kokoszczynki and Mackiewicz-Lyziak, 2019). Secondly, we prove that “reverse causality” or the “endogeneity problem” is only applicable during the tenure periods of governors Mulaisho (1992–1995) and Kalyalya (2015–2020) whilst during the remaining governors central bank turnover leads inflation. Lastly, consistent with the works of Bouwman et al. (2004) and Siklos (Citation2008), we find that the relationship between central bank turnover and inflation is nonlinear, and in this current study, we show that the relationship is predominantly negative and stronger at tenure cycles of above 9 years for the Zambian economy.
From a theoretical perspective, our findings narrate the “time-(in)consistency” problem of monetary policy in application to different BoZ governor tenures (Kydland and Prescott, 1977; Barro & Gordon, Citation1983; Rogoff, Citation1985) and indicate that whilst the BOZ acted in a “time-consistent” manner during the longer tenure years of Jacob Mwanza (1995–2002) and Caleb Fundanga (2002–2011) resulting in lower inflation rates, the BOZ has acted “time-inconsistently” during the earlier tenures of Leonard Chivonu (1986–1987), Francis Nkoma (1987–1989), Jacques Bussieres (1990–1992) and Dominic Mulaisho (1992–1995) as well as the more recent tenure of Denny Kalyalya (2015–2020) which has been accompanied with high (or increasing) rates of inflation.
5. Conclusions
This study has examined the impact of central bank turnover on inflation for the Zambian economy between 1984 and 2020. We use the coding system of Dreher et al. (Citation2008) to create a time series of central bank turnover for the nine different BOZ governors and rely on continuous complex wavelet analysis to examine the dynamic co-movement between the turnover series and inflation across a time-frequency domain. Our analysis reveals an inverse relationship between the variables with causality running from governor turnover to inflation throughout the entire time window with the exception of the 1992–1995 and 2016–2021 periods, where reverse causality is observed. Altogether, we observe that wavelet coherence analysis depicts a detailed narrative on the relationship between the two series across the different governor tenures and further binds “bits and pieces” of different empirical evidences from previous literature in harmonious manner for the Zambian economy.
Overall, our findings have some important policy implications. For instance, our study indicates that the BoZ needs to put into place policies which minimizes government’s invention in central bank decision making as a means of increasing independence. Based on our empirical findings the optimal frequency cycle for the governors “term in office” is 9 years which is equivalent to more than two presidential terms. On the forefront of policy proposals, we suggest the amendment of the current BoZ act which currently grants the Zambian president the authority to remove the governor at will, as well as to make amendments to the constitution of Zambia, which up-to-date makes no provision for the functional purpose of the BoZ at all. These legislative acts need to specifically delegate “de facto” independence to the Zambian monetary authorities such as those practiced by other African inflation-targeting countries like Ghana and South Africa. So even though the Bank of Zambia may not possess all the necessary “pre-requisites” for adopting a full-fledged inflation targeting regime, the BoZ can borrow from the principles of IT and enhance it’s independence (and credibility) through legislative changes to BoZ act and the constitution. And whilst there is a need to ensure that the appointed central bank governor of the BoZ needs to serve longer tenures in the interest of enhancing independence and credibility, it is important for the “right” candidate to be put in the position. We therefore propose that future studies focus on determining the personnel qualities (including educational attainment, academic field of study, ability to read and write research etc) of the governor and the accompanying staff who are most suitable to run the Central Bank.
Disclosure statement
No potential conflict of interest was reported by the author(s).
Additional information
Funding
References
- Adam, C. (1995). Fiscal adjustment, financial liberalization, and the dynamics of inflation: Some evidence from Zambia. World Development, 23(5), 735–16. https://doi.org/10.1016/0305-750X(95)00012-2
- Agoba, A., Abor, J., Osei, K., & Sa-Aadu, J. (2017a). The Independence of central banks, political institutional quality and financial sector development. Journal of Emerging Market Finance, 19(2), 154–188. https://doi.org/10.1177/0972652719877474
- Agoba, A., Abor, J., Sa-Aadu, J., & Sa-Aadu, J. (2017a). Central bank Independence and inflation in Africa: The role of financial systems and institutional quality. Central Bank Review, 17(4), 131–146. https://doi.org/10.1016/j.cbrev.2017.11.001
- Aguiar-Conraria, L., Martins, M., & Soares, J. (2012). The yield curve and the macroeconomy across time and frequency. Journal of Economic Dynamics & Control, 36(12), 1950–1970. https://doi.org/10.1016/j.jedc.2012.05.008
- Aguiar-Conraria, L., Martins, M., & Soares, J. (2018). Estimating the Tylor rule in the time-frequency domain. Journal of Macroeconomics, 57(3), 122–137. https://doi.org/10.1016/j.jmacro.2018.05.008
- Aguiar-Conraria, L., Martins, M., & Soares, J. (2019). “The Phillips curve at 60: Time for time and frequency”, NIPE Working Papers No. 04, May.
- Aguiar-Conraria, L., & Soares, J. (2014). Continous wavelet transforms: Moving beyond uni- and bivariate analysis. Journal of Economic Surveys, 28(2), 344–375. https://doi.org/10.1111/joes.12012
- Alesina, A., & Summers, L. (1993). Central bank Independence and macroeconomic performance: Some comparative evidence. Journal of Money, Credit, and Banking, 25(2), 151–162. https://doi.org/10.2307/2077833
- Aron, J., & Elbadawi, I. (1992). “Parallel markets, the foreign exchange auction, and exchange rate unification in Zambia”, World Bank Policy Research Working Paper Series No. 909, May.
- Artha, K., & de Hann, J. (2015). Financial crises and the dismissal of central bank governors: New evidence. International Journal of Finance and Economics, 20(1), 80–95. https://doi.org/10.1002/ijfe.1508
- Barro, R., & Gordon, R. (1983). A positive theory of monetary policy in a natural rate model. Journal of Political Economy, 91(4), 589–610. https://doi.org/10.1086/261167
- Baumann, P., Schomaker, M., & Rossi, E. (2021). Estimating the effect of central bank Independence on inflation using longitudinal targeted maximum likelihood estimation. Journal of Causal Inference, 9(1), 109–146. https://doi.org/10.1515/jci-2020-0016
- Bernanke, B., & Mishkin, F. (1997). Inflation targeting: A new framework for monetary policy? Journal of Economic Perspectives, 11(2), 97–116. https://doi.org/10.1257/jep.11.2.97
- Bouwman, K., Jong-A-Pin, R., & de Haan, J. (2005). On the relationship between central bank Independence and inflation: Some more bad new. Applied Financial Economic Letters, 1(6), 381–385. https://doi.org/10.1080/17446540500395604
- Brownbridge, M. (1996). “Financial policies and the banking sector in Zambia’, IDS Working Paper 32, Brighton.
- Cheelo, C., & Banda, T. (2017). “Towards an inflation targeting regime in Zambia”, ZIPAR Working Paper No. 23.
- Cheelo, C., & Hinfelaar, M. (2020). “Bank of Zambia autonomy amidst political turnovers in Zambia”, ESID Working Paper No. 153.
- Chipili, J. (2021). “Inflation dynamics in Zambia”, AERC Policy Brief. 742.
- Chrigui, Z., Boujelbene, Y., & Mhamdi, G. (2011). Central Bank Independence and inflation: Evidence from emerging countries. Journal of Policy Modeling, 33(3), 453–469. https://doi.org/10.1016/j.jpolmod.2010.06.002
- Crowe, C., & Meade, E. (2008). Central bank Independence and transparency: Evolution and effectiveness. European Journal of Political Economy, 24(4), 763–777. https://doi.org/10.1016/j.ejpoleco.2008.06.004
- Cukierman, A. (2008). Central bank Independence and monetary policy-making institutions: Past, present and future. European Journal of Political Economy, 24(4), 722–736. https://doi.org/10.1016/j.ejpoleco.2008.07.007
- Cukierman, A., Miller, G., & Neyapti, B. (2002). Central bank reform, liberalization and inflation in transition economies: An international perspective. Journal of Monetary Economics, 49(2), 237–264. https://doi.org/10.1016/S0304-3932(01)00107-6
- Cukierman, A., & Webb, S. (1995). Political influence on the central bank: International evidence. The World Bank Economic Review, 9(3), 397–423. https://doi.org/10.1093/wber/9.3.397
- Cukierman, A., Webb, S., & Neyapti, B. (1992). Measuring the Independence of central banks and its effects on policy outcomes. The World Bank Economic Review, 6(3), 353–398. https://doi.org/10.1093/wber/6.3.353
- De Haan, J., & Kooi, W. (2000). Does central bank Independence really mater? New evidence for developing countries using a new indicator. Journal of Banking and Finance, 24(4), 643–664. https://doi.org/10.1016/S0378-4266(99)00084-9
- De Haan, J., & Siermann, L. (1996). Central bank Independence, inflation and political instability in developing countries. The Journal of Policy Reform, 1(2), 135–147. https://doi.org/10.1080/13841289608523360
- Dreher, A., Sturm, J.-E., & de Haan, J. (2008). Does high inflation cause central bankers to lose their job: Evidence based on a new dataset. Journal of Political Economy, 24(4), 778–787. https://doi.org/10.1016/j.ejpoleco.2008.04.001
- Dreher, A., Sturm, J.-E., & de Haan, J. (2010). When is a central bank governor replaced? Evidence based on a new data set. Journal of Macroeconomics, 32(3), 766–781. https://doi.org/10.1016/j.jmacro.2010.04.001
- Eijffinger, S., Schaling, E., & Hoeberichts, M. (1998). Central bank Independence: A sensitivity analysis. European Journal of Political Economy, 14(1), 73–88. https://doi.org/10.1016/S0176-2680(97)00040-2
- Fouad, J., Fayed, M., & Emam, H. (2019). A new insight into the measurement of central bank Independence. Journal of Central Banking Theory and Practice, 8(1), 67–96. https://doi.org/10.2478/jcbtp-2019-0004
- Ftiti, Z., Aguir, A., & Smida, M. (2017). Time-inconsistency and expansionary business cycle theories: What does matter for the central bank Independence-inflation relationship. Economic Modelling, 67, 215–227. https://doi.org/10.1016/j.econmod.2016.12.013
- Gallegati, M., Gallegati, M., Ramsey, J., & Semmier, W. (2011). The US wage Phillips curve across frequencies and time. Oxford Bulletin of Economics and Statistics, 73(4), 489–508. https://doi.org/10.1111/j.1468-0084.2010.00624.x
- Gallegati, M., Ramsey, J., & Semmier, W. (2014). Interest rate spreads and output: A time scale decomposition analysis using wavelets. Computational Statistics and Data Analysis, 76, 283–290. https://doi.org/10.1016/j.csda.2014.02.024
- Garriga, A. (2016). Central bank Independence in the world: A new dataset. International Interactions, 42(5), 849–868. https://doi.org/10.1080/03050629.2016.1188813
- Garriga, A., & Rodriguez, C. (2020). More effective than we thought: Central Bank Independence and inflation in developing countries. Economic Modelling, 85, 87–105. https://doi.org/10.1016/j.econmod.2019.05.009
- Haga, M. (2015). On central bank Independence and political cycles. Journal of Applied Economics, 18(2), 267–296. https://doi.org/10.1016/S1514-0326(15)30012-X
- Hayat, M., & Farque, E. (2011). When are central bankers removed? Revenue Economique, 62(3), 471–478. https://doi.org/10.3917/reco.623.0471
- Jalakas, R. (1987). “Foreign exchange Zambia: An evaluation of the auction system in the Zambian economy”, SIDA Evaluation Report 1987/2.
- Klomp, J., & de Haan, J., & Klomp and de Haan. (2010). Do central bank law reforms affect the term in office of central bank governors? Economic Letters, 106(3), 219–222. https://doi.org/10.1016/j.econlet.2009.12.004
- Kokoszczynki, R., & Mackiewicz-Lyziak, J. (2020). Central bank Independence and inflation – Old story told a new. International Journal of Finance and Economics, 25(1), 72–89. https://doi.org/10.1002/ijfe.1730
- Kusi, B., Nortey, O., & Dzeha, G. (2019). Central bank Independence and economic welfare in Africa: Do institutional quality and levels of central bank Independence matter? Review of Development Finance Journal, 9(1), 79–93. https://hdl.handle.net/10520/EJC-17cee9acee
- Kydd, J. (1988). Coffee after copper? Structural adjustment, liberalization, and agriculture in Zambia. The Journal of Modern African Studies, 26(2), 227–251. https://doi.org/10.1017/S0022278X00010454
- Kydland, F., & Prescott, E. (1997). Rules rather than discretion: The inconsistency of optimal plans. The Journal of Political Economy, 85(3), 473–492. https://doi.org/10.1086/260580
- Lim, J. (2021). The limits to central bank Independence for inflation performance. Public Choice, 186(3–4), 309–335. https://doi.org/10.1007/s11127-019-00771-8
- Maimbo, S. (2002). The diagnosis and prediction of bank failures in Zambia, 1990-98. Development Policy Review, 20(3), 261–278. https://doi.org/10.1111/1467-7679.00170
- Morlet, J., Arens, G., Fourgeau, E., & Giard, D. (1982). Wave propagation and sampling theory; Part I, complex signal and scattering in multi-layered media. Geophysics, 47(2), 203–221. https://doi.org/10.1190/1.1441328
- Moser, C., & Dreher, A. (2010). Do markets care about central governor changes? Evidence from emerging markets. Journal of Money, Credit, and Banking, 42(8), 1589–1612. https://doi.org/10.1111/j.1538-4616.2010.00355.x
- Mwafulirwa, J. (2019). “Estimation of monetary policy response function in Zambia”, BoZ Working Paper No. 2019-04.
- Odhiambo, N. (2012). The impact of inflation on financial sector development: Experience from Zambia. The Journal of Applied Business Research, 28(6), 1497–1508. https://doi.org/10.19030/jabr.v28i6.7357
- Ojo, M., Aguiar-Conraria, L., & Soares, M. (2020). A time-frequency analysis of the Canadian macroeconomy and the yield curve. Empirical Economics, 58(5), 2333–2351. https://doi.org/10.1007/s00181-018-1580-y
- Raihan, S., Wen, Y., & Zeng, B. (2005). “Wavelet: A new tool for business cycle analysis”, Federal Reserve Bank of St. Louis Working Paper No. 2005-050.
- Roger, L., Smith, G., & Morrissey, O. (2017). “Exchange rate and inflation dynamics in Zambia”, World Bank Policy Research Paper No. 8128.
- Rogoff, K. (1985). The optimal degree of commitment to an intermediate monetary target. The Quarterly Journal of Economics, 100(4), 1169–1189. https://doi.org/10.2307/1885679
- Siklos, P. (2008). No single definition of central bank Independence is right for all countries. European Journal of Political Economy, 24(4), 802–816. https://doi.org/10.1016/j.ejpoleco.2008.07.004
- Simatele, M. (2004). “Financial sector reforms and monetary policy reforms in Zambia”, MPRA Paper. 21575.
- Simatele, M., Schaling, E., & Alagidede, P. (2015). Is Zambia ready for inflation targeting? African Review of Economics and Finance, 7(2), 1–26. https://hdl.handle.net/10520/EJC182434
- Simpasa, A., Nandwa, B., & Nabassaga, T. (2015). Bank lending channel of monetary policy transmission in Zambia: Evidence from bank-level data. Journal of Economic Studies, 42(6), 1159–1174. https://doi.org/10.1108/JES-10-2014-0172
- Simuchile, H., & Pamu, E. (2004). Exchange rate pass-through to domestic prices: The case of Zambia. BoZ Reader, 1(2), 64–75. extension://efaidnbmnnnibpcajpcglclefindmkaj/https://www.boz.zm/THEREADER2004.pdf
- Sturm, J., & de Haan, J. (2001), “Inflation in developing countries: Does central bank Independence matter?”, CESifo Working Paper Series No. 511.
- Svensson, L. (1997). Optimal inflation targets, ‘conservative’ central banks, and linear inflation contracts. American Economic Review, 87(1), 98–114. https://www.jstor.org/stable/2950856
- Torrence, C., & Compo, G. (1998). A practical guide to Wavelet analysis. Bulletin of the American Meteorological Society, 79(1), 61–78. https://doi.org/10.1175/1520-0477(1998)079<0061:APGTWA>2.0.CO;2
- Vuletin, G., & Zhu, L. (2011). Replacing a “disobedient” central bank governor with a “docile” one: A novel measure of central bank Independence and its effect on inflation. Journal of Money, Credit, and Banking, 43(6), 1185–1215. https://doi.org/10.1111/j.1538-4616.2011.00422.x
- Walsh, C. (1995). Optimal contracts for central bankers. American Economic Review, 85(1), 150–167. https://www.jstor.org/stable/2118001
- Wulf, J. (1988). Zambia under the IMF regime. African Affairs, 87(349), 579–594. https://doi.org/10.1093/oxfordjournals.afraf.a098092