
 ?Mathematical formulae have been encoded as MathML and are displayed in this HTML version using MathJax in order to improve their display. Uncheck the box to turn MathJax off. This feature requires Javascript. Click on a formula to zoom.
Abstract
This study aims to examine whether there is any evidence of momentum in Moroccan industries and whether these momentum returns are attributed to the market status, UP and Down based on monthly data from December 1997 to December 2019. The portfolio methodology was used to classify 17 Moroccan industries within four portfolios; each portfolio constitutes 25% of Moroccan industries. The 3-factor model of Fama and French was employed to consider the risk-adjusted returns. The results showed that there is ample evidence and statistically significant momentum returns in Moroccan industries. The sub-sample findings support the evidence of momentum. This study also shows that momentum returns in the Moroccan industry are not exclusive to the UP or DOWN market because momentum returns are present in both “Up” and “Down” markets. These results are important for investors to design their investment strategies and take advantage of the momentum returns in Moroccan industries. This study contradicts the efficient market hypothesis because of the inability of the Fama-French 3-factor model to account for momentum profits; therefore, the paper recommends using the Fama-French five-factor model.
Keywords:
1. Introduction
Momentum returns are an important topic in the recent financial literature. The first to describe this momentum phenomenon was Jegadeesh and Titman (Citation1993, Citation2001), where they noted that creating a zero-sum investment portfolio based on purchasing shares of companies that have recently outperformed the market (3, 6, 9 and 12 months) continue through the coming holding periods (3, 6, 9 and 12 months). At the same time, selling stocks that underperformed in the recent past (3, 6, 9 and 12 months) continue to perform over the upcoming holding periods (3, 6, 9 and 12 months). This trading strategy is called the momentum strategy. Several studies have confirmed that the application of this approach in international markets yields significant positive profits (Balvers & Wu, Citation2006; Chan et al., Citation2000; Griffin et al., Citation2003; Rouwenhorst, Citation1998).
Cooper et al. (Citation2004) use a methodology to define market states based on UP and DOWN as follows: “UP” indicates when the lagged one-, two- and three-year market return is positive, while “DOWN” shows when the one-, two- and 3-year market lagged return is negative. Cooper et al. (Citation2004) investigated the existence of momentum return over UP and DOWN markets at the level of firms in the US market. They reported that momentum returns are exclusive to the UP market and point out that this is attributed to investor overconfidence. Huang (Citation2006) emphasise their conclusion that momentum returns are only found in the UP market in an international context. Huang (Citation2006) also support this finding when another test, lagging global industrial production growth, was used to categorise the market state, but the latest test showed that abnormal profits also appear in a DOWN market. On the other hand, Cheema and Nartea (Citation2017) examined the existence of momentum return over UP and DOWN markets at the level of firms in the China market. Cheema and Nartea (Citation2017) reached the opposite conclusion, showing that momentum returns are exclusive to the DOWN market.
The investigation of the momentum impact with the market condition in Morocco was chosen for the following reasons. First, one of the MENA markets with the greatest growth is the Casablanca Stock Exchange, which serves as Morocco’s primary stock market (Farooq & Benali, Citation2012). Second, based on the monthly Moroccan industries stock returns data offered on the Casablanca Stock Exchange website, it is clear that the Moroccan industries stock returns are highly volatile; this volatility may help us to understand the behaviour of the momentum strategy with the state of the market and enrich the previous few studies on this topic. Third, examining this strategy in Morocco as an emerging market helps to deepen our understanding of this strategy and compare it with the results of previous studies. Finally, given that Moroccan enterprises are experiencing a momentum effect documented by Gharaibeh (Citation2016) and Lekhal and El Oubani (Citation2020), it will be useful to compare the results of the current study that is based on the level of Moroccan industries with a previous study that is based on the level of Moroccan firms.
The current study was conducted for several reasons. Firstly, the need to check whether there is any short-term momentum impact at the level of Moroccan industry. While the evidence for the effect of momentum in many developed countries has been examined by many studies, few have examined the impact of momentum on emerging economies. Therefore, the present paper is the first to investigates if the Moroccan industry has a momentum impact. Secondly, this paper was also performed due as asset allocation is a key component of the trading strategy used to manage portfolios, mutual funds and hedge funds in the financial world. Asset allocation across industries also plays an important role in managing portfolios around the world. Therefore, one of the gaps in previous studies is the lack of studies examining whether industry returns are showing momentum. Thirdly, while Cooper et al. (Citation2004) and Huang (Citation2006) examined how momentum portfolios interact with the market at the level of stocks and international markets, there is a lack of research on whether market states can play an important role at the industry level. Therefore, this paper investigates whether conditioning on the market state is vital to the momentum profits at the level of Moroccan industry.
This study contributes to the literature in several ways. First, This study examines the momentum in the Moroccan market, one of the emerging markets in which the Casablanca Stock Exchange experienced the largest growth in the MENA markets during the study period. Second, this paper investigates the effect of momentum considering the state of the market whether it is UP or DOWN based on different time periods based on the last 12, 24 and 36 months. It provides strong evidence of momentum in the UP and DOWN market. This result does not agree with previous studies that find momentum in either the UP or DOWN market. Finally, this research adds to the limited literature that examines the impact of momentum at the level of industries in the Moroccan market, while the studies of Gharaibeh (Citation2016) and Lekhal and El Oubani (Citation2020), were at the level of corporate equity returns. Therefore, this study contributes to our understanding of Moroccan industries’ ineffective stock return performance and market conditions either in the up or down market, and will also help portfolio managers, investors and traders to take appropriate decisions when using momentum trading strategies and achieving abnormal profits.
The design of this study is as follows. Reviews the available literature in Section 2, while, the data and methods employed in this study are explained in Section 3. Section 4 shows the empirical findings regarding the momentum strategy, post-formation period analysis, sub-period analysis, and market state and momentum returns. The summary of the paper is presented in Section 5.
2. Literature review
Regarding the industry momentum strategies applied in the US market, Grobys and Kolari (Citation2020) reported that industry portfolios that did well in prior months had significantly larger average returns in the holding period than those portfolios that underperformed. From the Chinese market, Wang (Citation2020) shows that the momentum effect exists, but there are large differences between different markets; in the A-share market, the effect of momentum exists on the long (one year) and short (less than a year) level, while in the B-share market, the effect of momentum is strong on the short level while weak on the long level. The difference was linked to the fact that the liquidity in the A-share market is much greater than in the B-share market.
In the Middle East markets, Ejaz and Polak (Citation2015) examined the existence of momentum effects. Seven stock exchanges from six countries in the Middle East were chosen: the Abu Dhabi Securities Exchange, the Dubai Financial Market, the Egypt Stock Exchange, the Amman Stock Exchange, the Casablanca Stock Exchange, the Muscat Securities Market and Tadawul. Using data starting from the beginning of January 2008 to the end of December 2013, they found that the momentum impact is present in these markets. The CAPM was unable to explain the short-term momentum profits. Using 18 emerging stock markets from 1990 to 2011, Cakici et al. (Citation2013) demonstrated strong evidence for momentum in all emerging regions, excluding Eastern Europe. At 10 Arabic index level data extending from January 1989 to August 2013, Gharaibeh (Citation2017) studied the presence of momentum profits. In addition, Gharaibeh (Citation2017) classified momentum portfolios into two categories with regard to previous long-term performance, creating early and late-stage momentum strategies. Gharaibeh (Citation2017) showed that the momentum profits provide significant profits in ten Arabic market indices during all formation periods.
In the Moroccan market, Lekhal and El Oubani (Citation2020) investigated its efficiency using the MASI index during the time period from 1992–2019. They used tests that are linear and nonlinear, based on daily data. Lekhal and El Oubani (Citation2020) showed that there were opportunities to make profits at different times depending on the level of efficiency and the state of the market. Based on non-linear tests, it was found that the momentum strategy was highly profitable. In another study in Morocco, using stock level data from 1995–2016, Gharaibeh (Citation2016) revealed significant evidence for the momentum effect. The return momentum method generates a notable return of 0.51% monthly on average in Moroccan company portfolios with a six-month holding term. Gharaibeh (Citation2016) displayed that the Fama and French 3-factor model failed to clarify the momentum profits for the Moroccan market. According to the discussion above, the first hypothesis is proposed as follows:
H1: The short winner portfolios statistically outperform the short loser (SL) portfolios during the holding period.
Most previous studies in the US imply that momentum returns are exclusive in market states; for example, Cooper et al. (Citation2004) examined the theories of overreaction for short-term momentum across stock returns. They concluded that momentum returns are exclusive to the UP market condition. Following up market returns, the average monthly momentum return is 0.93%, while down market results are typically followed by a − 0.37% return. They illustrated how momentum profits are not adequately explained by macroeconomic forces. Compatible with the stock-level findings of Cooper et al. (Citation2004), Huang (Citation2006) documented that the international momentum returns exist only in the up market. Asem and Tian (Citation2010) confirmed the previous findings and explained that the nonexistence of momentum returns in the down market is a result of market dynamics. They explained their results using the behaviour model of Daniel et al. (Citation1998). In a related study, Li and Galvani (Citation2018) showed that momentum returns for firm bonds exclusively follow UP periods, while down periods produce momentum losses. Their results suggest that momentum returns are linked by under-pricing and proxied by low sentiment. In short, UP market momentum gains are only produced by momentum portfolios, which were created during times of low sentiment. Recently, Cheema and Nartea (Citation2017) discovered that China is relatively different by showing that momentum profits completely follow DOWN markets. They revealed that market dynamics are inadequate to account for the lack of momentum returns following UP markets. Su (Citation2021) examines the effect of momentum in the Chinese stock market for the period 1994 to 2017. Their results showed that momentum effect was absent from the Chinese market for the period 1994–2006, while it was proven in the period 2007–2017. Their results have confirmed that momentum is strongly correlated with DOWN market. Thus, investors follow the momentum strategy when the stock market is exposed to a significant decline. Based on the above discussion, the next hypothesis is proposed:
H2: Momentum returns are exclusive to the up or down market status.
In the Australian stock exchange, Dempsey (Citation2010) found that stock returns are highly correlated with the book to market equity. Dempsey (Citation2010) provided robust evidence that the relationship comes from an internalisation of the B/E ratio of the impact of the firm’s leverage as a risk factor. Despite the peculiarities of Australian stock markets, these findings are largely in line with those of US stocks, such as Fama and French (Citation1993) and Peterkort and Nielsen (Citation2005). Kassimatis (Citation2008) provided solid evidence that the 4-factor model, which includes size, BE/ME and momentum, has independent factors in expected returns in Australia, while CAPM is unable to clarify expected returns because it assumes beta stability during the study period. Simlai (Citation2009) indicated that size and value have a great ability to clarify the portfolio of stock returns over the years from 1926 to 2007. Therefore, the Fama and French 3-factor model is important for explaining the risk factors and the excess returns. Considering the above discussion, the third hypothesis is proposed:
H3: The three-factor Fama and French model explains momentum returns.
3. Data and methodology
3.1. Data
The dataset spans 17 Moroccan industries from December 1997 to December 2019 and contains value-weighted monthly returns, company sizes, and BE/ME ratios. The current study started in 1997 due to the availability of data, while the study was only extended to 2019 to minimise the influence of the COVID-19 epidemic, which started on 30 December 2019, and avoid bias in the research as the effect of the COVID-19 pandemic was exceptional in all markets. The market data for the monthly Moroccan index are collected from Morgan Stanley Capital International (MSCI). All variables employed are taken from Data Stream. The industries involved in the current study are Distributors, Investment Companies & Other Finance, Beverages, Banks, Food Producers & Processors, Mining, Real Estate, Utilities, Electronical & Electronic Equipment, Insurance, Leisure & Hotels, Oil & Gas, the Pharmaceutical Industry, Chemicals, Materials, Software & Computer services, Engineering & Equipment Industrial Goods, and Construction & Building Materials. The risk-free rate is collected from the library of the Moroccan Central Bank and is specified for one-month Treasury bills at the beginning of each month.
Table reports statistical descriptions of the 17 Moroccan industries included in the study. Columns 2 and 3 display the average monthly returns and the monthly standard deviation for each industry, respectively, while Columns 3 and 4 provide the Skewness and Kurtosis. The average return across all Moroccan industries is −0.23% per month, while the standard deviation is 10.94% per month. This indicates that the returns on shares of Moroccan industries are low and highly volatile. The skewness indicates that most industries are close to zero and 8 Moroccan industrial returns are heading to the left, while the others are heading to the right. Overall, 13 out of 17 industries have more kurtosis than 3, indicating that there are extreme returns in these industries. The sampling period ran from January 1997 to December 2019.
Table 1. Summary statistics
Table shows 17 Moroccan industries’ returns. The “av.” represents the average monthly returns while “S.D.” represents the standard deviation of monthly returns. The fourth and fifth columns show Skewness and Kurtosis as measures of normal distribution. The last column is the number of observations (NOBS).
3.2. Momentum strategy
This paper performs a portfolio sorting methodology like that used in previous studies (Jegadeesh and Titman, Citation1993; Chordia and Shivakumar (Citation2002). In particular, at the end of every month, Moroccan industries are arranged based on their previous return (J-month = 3, 6, 9 and 12). We ranked the first four industries that achieved the highest returns in the winner’s portfolio, and the last four industries that achieved the lowest returns in the loser’s portfolio. Then, we took the difference between the winning and losing portfolios as an arbitrage portfolio based on the following months (K = 1, 3, 6, 9 and 12) and for Q following quarters (Q = 1, 2, 3, and 4), and annual event time return following Year (1, 2, 3, 4 and 5). To avoid matters such as bid and bounce, this study skipped one month before the holding period. Also, to ensure that the test used in the current study was robust, this paper employs overlapping returns to form momentum returns. Thus, for a specific month t, the momentum strategy refers to the holding industries chosen in the present month and those chosen by strategies in the previous J − 1 months. The momentum returns in a specific month are calculated as the average of the returns of K zero-investment portfolios. As a robustness test, the current study splits the sample into two roughly equal sub-periods: from January 1998 to August 2008 and from September 2008 to December 2019.
3.3. Momentum returns and lagged market condition
Using the methodology of Cooper et al. (Citation2004), based on the DOWN and UP groupings of the market state. In this study, value-weighted market returns is used before the portfolio construction date to determine the market condition. When the value-weighted market return based on the lagged 36 months is positive or negative, the state of the market is then defined as UP or DOWN, respectively. A longer period can be used to infer more changes in market condition, but this decreases the number of observations. Therefore, there was a relatively long period of time employed in the current study. As another check, 24-month lagged and 12-month lagged returns were used to specify the states of the market. In short, only the strategy due to J = 6 months will be examined and K = 6 as the base case for the reported discussion.
3.4. The 3-factor model
The extent to which these profits are adjusted for risk will be measured. This is covered by applying the 3-factor model used by Fama and French (Citation1993). The 3-factor model includes market return, returns of small industries minus big industries and returns of value industries minus growth industries as follows:
The current study’s dependent variable is the excess monthly return to the industry for the value of the weighted portfolio p. The industry monthly return of portfolio p at time t is denoted by Pt, while ft is the risk-free monthly rate at time t denoted by the one-monthly recovery of Moroccan treasury bills. The independent variables of the three-factor models are as follows: is the excess monthly market return for month t,
is the monthly size factor at time t and
is the monthly ME/BE factor at time t.
is the alpha of portfolio, while
are coefficients of three independent variables and
is the errors.
4. Analysis of results
One of the main research purposes in the current study is to consider the momentum profitability at the Moroccan industry level. By investing in the portfolio of Moroccan industries that had high returns in the past and shorting the portfolio of Moroccan industries with low previous returns, the momentum strategy is able to provide positive and significant returns that continue for up to 12 months.
The outcomes of Morocco’s momentum strategy are presented in the next section. Section 4.2 provides certainty tests of the momentum strategy with respect to the sub-period examination. Section 4.3 demonstrates the regression of risk-adjustment.
4.1. Momentum strategy
Table summarises Morocco industry returns from the momentum strategy depending on various formation J and K periods, consistent with the method of Jegadeesh and Titman (Citation1993). Depending on the previous J-month returns, the 17 industries can be divided into four portfolios. Industries with the lowest historical returns are represented in the short portfolio (SL), while those with the highest historical returns are represented in the long portfolio (SW). A one-month gap is used between the end of the formation period and the start of the holding periods. Throughout the momentum strategies, and to be consistent in the discussion of findings and for comparison purposes, the base case strategy of the J/K = (6, 6) formation/holding period will be investigated in more detail.
Table 2. Momentum profits at Morocco industries
The findings provided in Table present robust evidence of a momentum effect. The momentum strategy SW-SL presented in Table generates significant returns for all J = 3 to 12 and all K. For example, based on a six-month formation period with a six-month holding period case, previous short-term losers produce an average of −1.79% per month, while previous short-term winners produce an average of 1.26% per month over the same period. The momentum strategy SW-SL generates returns of 3.05% per month and is statistically significant (t-stat 5.64).
In summary, there are statistically significant profits created by a momentum strategy. The results of the first four quarters of the first year after the holding period started are shown in the following section.
The above table details the average monthly returns of the short-winner, short-loser, and arbitrage portfolios represented by the short-winner minus the short-loser as a momentum strategy. Portfolios are formed according to the approach of Jegadeesh and Titman (Citation1993), where industries are categorized in each month t due to the compound return in regard to past J = 6 formation months. The highest 25% of industries are those with the largest past returns and collected in the short-term winner denoted by SW, while the lowest 25% are the industries with the lowest past returns and collected in the short-term loser portfolio denoted by SL. The arbitrage portfolio SW-SL, which is momentum strategy, raises buying the winning portfolio and selling the losing portfolio to be held for various K month holding periods. The t-values are provided in parentheses.
4.2. Post holding analysis
Table shows the average compounded returns of the K = 1 short, long and arbitrage portfolios for the first 4 quarters and for the first five years following the beginning of the holding period. Clearly, the momentum strategy results demonstrated in Table support the prior findings in Table . The momentum profits continue from Quarter 1 to Quarter 4 and throughout the first year. All of these profits are statistically significant. The pattern of momentum effect is also evident in Figure .
Figure 1. Cumulative returns of momentum strategy.
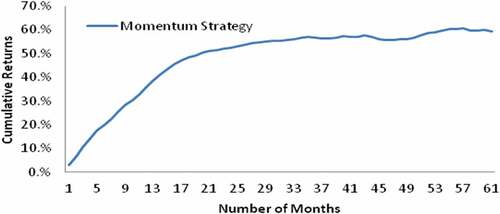
Table 3. Quarterly and first year returns at Morocco industries
Table offers no proof of the long-term contrary returns for 17 Moroccan industries. For example, looking at the 6-month formation period as a base case, with the exception of Year 4, all five years had positive returns. In general, the universally positive event-time returns propose that there is no reversal throughout the first five years’ post-formation. A comparable pattern can be seen in the cumulative returns for the first 60 months in Figure .
This table shows the average returns for the period of holding winning portfolios SW and losing portfolios SL in the short-term, and the difference between them based on the first year divided into four quarters, followed by five years after the formation of the investment portfolio. Error correction used two delays for quarterly returns and 11 delays for annual returns by Newey-West, along with a t-statistic value placed in parentheses.
Figure illustrates the post-formation cumulative momentum profits up to 60-month for the 6-month creation momentum strategy with a one month (K = 1) holding period. The graph demonstrates that the strategy’s cumulative return increases monotonically until it reaches 50 at the end of month 17 and then increases slowly until the end of month 60.
4.3. Sub-period analysis
To check the previous results, the current work examines the performance of the momentum strategy over two sub-periods. The sample sub-periods are also divided into roughly equal halves: the first sub-period runs from January 1998 to August 2008 and the second sub-period runs from September 2008 to December 2019.
Table presents the first and second sub-period of profitability of the momentum strategy in Panel A and B. To save space, the results shown are for the momentum strategy with a 6-month formation period (J = 6-month). Panel A of Table demonstrates that the momentum strategy in the first sub-period provides significant profits in all holding periods. For instance, with a 6-month holding period (K = 6), the momentum strategy earns a first sub-period profit of 5.48 per month (t-stat 6.09). The profit of momentum strategy for first sub-period is very large because the short-term loser SL is negative and produces a profit of −4.17 per month.
Table 4. Momentum profits in first and second in sub-period
Table details the percentage average monthly returns for the short-term winner, short-term loser, and short-term winner minus short-term loser portfolios of the momentum strategy in subperiods. Panel A and B reports the findings for the first subperiod from January 1998 to August 2008, and the findings for the second subperiod from September 2008 to December 2019, respectively. The method of raising these portfolios is described in Table .
In the second sub-period, the momentum strategy in Panel B of Table tells a similar story. The momentum strategy yields significant profits for K = 1 and 3 holding periods, with weak yet significant profits for the K = 12 holding period. Although the 6-month holding period (K = 6) momentum strategy does not provide statistical profits for a second sub-period of 0.71, it is still economically large. Comparing the short-term winner SW either in the first or second sub-periods, they provide significant profits of 1.31 per month (t-stat 2.48) and 1.15 per month (t-stat 2.24), respectively. Generally, the results of sub-periods shown in Table confirm the momentum profitability among 17 Moroccan industries. The next section examines momentum returns subject to market states.
4.4. Momentum returns and lagged market states
Table demonstrates how Moroccan momentum returns are affected by market conditions. Conditional momentum returns in Morocco are large and statistically significant. More significantly, Table indicates that momentum depending on the previous 12, 24, and 36-month market returns in Morocco follow UP and DOWN markets; these findings are inconsistent with the results of Cooper et al. (Citation2004) and Asem and Tian (Citation2010) applied to US markets, who document significant momentum returns that only follow UP markets. In addition, the results of this study differ from the results of previous studies in China such as Cheema and Nartea (Citation2017) and Su (Citation2021), who provide that the momentum is only follow DOWN markets.
Table 5. Momentum returns and market states
Panel A in Table offers the findings of the momentum returns for the holding periods over the first, third, sixth, ninth, and twelfth months of the delayed UP and DOWN market conditions based on the previous 12 months. Panel B shows the momentum returns of the delayed UP and DOWN market conditions based on the last 24 months, and Panel C shows the momentum returns of the delayed market conditions based on the previous 36 months. Panel A displays the momentum strategy’s returns in the arbitrage portfolio (SW-SL) holding six months are 2.68% and 3.16% per month and statistically significant in the UP and DOWN market, respectively. Panels B and C emphasise the returns of momentum strategy over the same holding period and provide statistically significant returns but momentum returns are relatively low compared to Panel A.
Table displays that the Moroccan market has relatively DOWN market conditions compared to the UP market. In panel A, the DOWN market makes up 75%, while the UP market comprises 25%. Likewise, in panels B and C, the DOWN market is clearly greater than the UP market. Given the 36-month momentum returns in Panel C, it is clear that the value-weighted momentum returns following UP are statistically significant at 1.60% per month (t-stat 2.09), while the value-weighted momentum returns following DOWN are weakly significant; this is still economically large at 1.03% per month (t-stat 1.71).
At the beginning of each month t, all industries are classified into four portfolios based on their 6-month compounding returns; portfolios are designed one month after the compounding returns. These portfolios are held for 1, 3, 6, 9 and 12 months. Positive (negative) MSCI Moroccan market returns during months t-m (m = 12, 24, 36) are employed to determine UP and DOWN market states for each industry. SL, SW, and SW-SL are detailed in the second row. Panel A shows the average return of momentum strategy after 12 months, while Panels B and C display the average returns of momentum strategy after 24- and 36-month MSCI Moroccan market returns, respectively. All of the returns are detailed as percentages and the Newey-West t-statistics are shown in parentheses. The sampling time frame is from December 1997 to December 2019.
4.5. Risk adjustments analysis
The extent to which these profits are adjusted for risk will be measured. This is covered by applying a 3-factor model used by Fama and French (Citation1993). The proof of abnormal profits is shown when the alpha is large and statistically significantly different from zero. By using White’s (Citation1980) test, the t-values that correspond to the coefficients are modified for heteroskedasticity.
This table details the Fama-French 3-factor model findings for the monthly returns of the momentum strategy by holding K = 6 months. SW refers to the portfolio containing 25% of industries with the highest returns over the previous 6 months and SL refers to the portfolio containing 25% of industries with the lowest returns over the preceding 6 months. The 3-factor regression is as follows:
To check whether the 3-factor model proposed by Fama and French can explain the momentum profits with J = 6 and for the 6-month holding period (K = 6), the results are shown in Table . The momentum strategy SW-SL alpha is 0.0147 and statistically significant (t-stat 3.32). This means that there is an abnormal return of momentum in Moroccan industry. These abnormal returns cannot be clarified by the Fama-French 3-factor model. In short, the momentum strategy provides strong risk-adjusted profits.
Table 6. Risk-adjusted momentum profits
5. Conclusion
This study examines whether there is a momentum impact in Moroccan industries and attempt to explain its profit by using the three-factor model. In addition, this study examines whether the momentum returns are subject to market states. Using 17 Moroccan industries from December 1997 to December 2019, this study provides the first solid evidence of momentum profits at the level of Moroccan industries. The impact of momentum on Moroccan industries is an important finding because they provide the largest average monthly return with a six-month holding period of 3.05%, while the return momentum strategy in Moroccan firm portfolios for the same holding period yields an average return of 0.51% per month. This indicates that investing in Moroccan industries provide six times more profits than those in Moroccan companies.
This study contributes to the momentum literature by establishing the existence of momentum in Moroccan industries, whether the market state is UP or DOWN. In other words, this study demonstrates that the momentum profits are not subjected to market state. A six-month case shows that the momentum portfolio is profitable, irrespective of the UP and DOWN market conditions; this is incompatible with the outcomes of Cooper et al. (Citation2004), Asem and Tian (Citation2010), and Huang (Citation2006) who applied their studies to US and international markets, and their momentum results were confined in the case of UP markets. This result also contrasts with the results of Cheema and Nartea (Citation2017) and Su (Citation2021) who provided evidence of momentum returns in the DOWN market state in China.
This study helps the traders in Moroccan markets at the level of industries to achieve abnormal profits either in the up or down market by following momentum trading strategies. In particular, Moroccan industries are 66% to 75% down market. However, traders can make abnormal profits by following the momentum strategy, purchasing the winning industry stocks and selling the losing industries’ stocks in the past three, six, nine or twelve months and holding them over the next three, six, nine or twelve. The previous findings propose that that Moroccan industries are not isolated and are open to the opportunity to compare the returns of Moroccan industries with other industry returns either in developed or developing countries. It is clear that the three-factor model has been unable to explain momentum profits for Moroccan industries. Therefore, the paper recommends using the Fama-French five-factor model. The findings of this study also recommend employing a behavioural financing model to study the reasons for the momentum returns.
Disclosure statement
No potential conflict of interest was reported by the author(s).
Additional information
Funding
References
- Asem, E., & Tian, G. Y. (2010). Market dynamics and momentum profits. Journal of Financial and Quantitative Analysis, 45(6), 1549–15. https://doi.org/10.1017/S0022109010000542
- Balvers, R. J., & Wu, Y. (2006). Momentum and mean reversion across national equity markets. Journal of Empirical Finance, 13(1), 24–48. https://doi.org/10.1016/j.jempfin.2005.05.001
- Cakici, N., Fabozzi, F. J., & Tan, S. (2013). Size, value, and momentum in emerging market stock returns. Emerging Markets Review, 16, 46–65. https://doi.org/10.1016/j.ememar.2013.03.001
- Chan, K., Hameed, A., & Tong, W. (2000). Profitability of momentum stragegies in the international equity markets. Journal of Financial and Quantitative Analysis, 35(2), 153–172. https://doi.org/10.2307/2676188
- Cheema, M. A., & Nartea, G. V. (2017). Momentum returns, market states, and market dynamics: Is China different? International Review of Economics & Finance, 50, 85–97. https://doi.org/10.1016/j.iref.2017.04.003
- Chordia, T., & Shivakumar, L. (2002). Momentum, business cycle, and time‐varying expected returns. The Journal of Finance, 57(2), 985–1019. https://doi.org/10.1111/1540-6261.00449
- Cooper, M. J., Gutierrez, R. C., & Hameed, A. (2004). Market states and momentum. The Journal of Finance, 59(3), 1345–1365. https://doi.org/10.1111/j.1540-6261.2004.00665.x
- Daniel, K., Hirshleifer, D., & Subrahmanyam, A. (1998). Investor psychology and security.
- Dempsey, M. (2010). The book-to-market equity ratio as a proxy for risk: Evidence from Australian markets. Australian Journal of Management, 35(1), 7–21. https://doi.org/10.1177/0312896209351451
- Ejaz, A., & Polak, P. (2015). Short-term momentum effect: A Case of Middle East stoCK marKets. Verslas: teorija ir praktika, (1), 104–112. https://doi.org/10.3846/btp.2015.438
- Fama, E. F., & French, K. R. (1993). Common risk factors in the returns on stocks and bonds. Journal of Financial Economics, 33(1), 3–56. https://doi.org/10.1016/0304-405X(93)90023-5
- Farooq, O., & Benali, M. (2012). “Earnings management behavior of the initial public offering (IPO) firms during pre-IPO and post-IPO years: Evidence from the Casablanca Stock Exchange “. African Journal of Business Management, 6(31), 9005–9014. https://doi.org/10.5897/AJBM11.2413
- Gharaibeh, O. (2016). Evidence of the momentum effect in the Morocco stock market: 1995–2014. International Review of Management and Business Research, 5(1), 204. https://www.irmbrjournal.com/papers/1455103505
- Gharaibeh, O. (2017). Strong and weak price momentum components: Evidence from 10 Arabic market indices. International Journal of Academic Research in Accounting, Finance and Management Sciences, 7(1), 151–161. https://doi.org/10.6007/IJARAFMS/v7-i1/2591
- Griffin, J. M., Ji, X., & Martin, J. S. (2003). Momentum investing and business cycle risk: Evidence from pole to pole. The Journal of Finance, 58(6), 2515–2547. https://doi.org/10.1046/j.1540-6261.2003.00614.x
- Grobys, K., & Kolari, J. (2020). On industry momentum strategies. Journal of Financial Research, 43(1), 95–119. https://doi.org/10.1111/jfir.12205
- Huang, D. (2006). Market states and international momentum strategies. The Quarterly Review of Economics and Finance, 46(3), 437–446. https://doi.org/10.1016/j.qref.2004.07.009
- Jegadeesh, N. and Titman,S. 1993: Returns to Buying Winners and Selling Losers: Implications for Stock Market Efficiency, Journal of Finance 48, 65. https://doi.org/10.1111/j.1540-6261.1993.tb04702.x
- Jegadeesh, N. and Titman, S. (2001). Profitability of Momentum Strategies: An Evaluation of Alternative Explianations, Journal of Finance, 56, 699. https://doi.org/10.1111/0022-1082.00342
- Kassimatis, K. (2008). Size, book to market and momentum effects in the Australian stock market. Australian Journal of Management, 33(1), 145. https://doi.org/10.1177/031289620803300108
- Lekhal, M., & El Oubani, A. (2020). Does the adaptive market hypothesis explain the evolution of emerging markets efficiency? Evidence from the Moroccan financial market. Heliyon, 6(7), 7. https://doi.org/10.1016/j.heliyon.2020.e04429
- Li, L., & Galvani, V. (2018). Market states, sentiment, and momentum in the corporate bond market. Journal of Banking & Finance, 89, 249–265. https://doi.org/10.1016/j.jbankfin.2018.02.007
- Peterkort, R. F., & Nielsen, J. F. (2005). Is the book-to-market ratio a measure of risk?. Journal of Financial Research, 28(4), 487–502. https://doi.org/10.1111/j.1475-6803.2005.00135.x
- Rouwenhorst, K. G. (1998). International momentum strategies. The Journal of Finance, 53(1), 267–284. https://doi.org/10.1111/0022-1082.95722
- Simlai, P. (2009). Stock returns, size, and book-to-market equity. Studies in Economics and Finance, 26(3), 198–212. https://doi.org/10.1108/10867370910974026
- Su, C. (2021). A comprehensive investigation into style momentum strategies in China. Financial Markets and Portfolio Management, 35(1), 101–144. https://doi.org/10.1007/s11408-020-00375-z
- Wang, S. (2020). The momentum effects and market timing of momentum strategies in Chinese stock market. University of Groningen. Faculty of Economics and Business.
- White, H. (1980). A Heteroskedasticity Consistent Covariance Matrix Estimator and a Direct Test for Heteroskedasticity. Econometrica, 48(4), 817–838. https://doi.org/10.2307/1912934